| Issue |
A&A
Volume 682, February 2024
|
|
|---|---|---|
| Article Number | A75 | |
| Number of page(s) | 18 | |
| Section | Interstellar and circumstellar matter | |
| DOI | https://doi.org/10.1051/0004-6361/202245740 | |
| Published online | 05 February 2024 | |
The disk of the eruptive protostar V900 Mon
A MATISSE/VLTI and MUSE/VLT perspective★
1
Konkoly Observatory, HUN-REN Research Centre for Astronomy and Earth Sciences,
Konkoly Thege Miklós út 15-17,
1121
Budapest,
Hungary
2
CSFK, MTA Centre of Excellence, Budapest,
Konkoly Thege Miklós út 15-17,
1121
Budapest,
Hungary
e-mail: This email address is being protected from spambots. You need JavaScript enabled to view it.
3
ELTE Eötvös Loránd University, Institute of Physics,
Pázmány Péter sétány 1/A,
1117
Budapest,
Hungary
4
Department of Astrophysics, University of Vienna,
Türkenschanzstrasse 17,
1180
Vienna,
Austria
5
Institut de Recherche en Astrophysique et Planétologie, Universityé de Toulouse, UT3-PS, OMP, CNRS,
9 av. du Colonel-Roche,
31028
Toulouse Cedex 4,
France
6
Leiden Observatory, Leiden University,
PO Box 9513,
NL2300 RA
Leiden,
The Netherlands
7
Max Planck Institute for Astronomy,
Königstuhl 17,
69117
Heidelberg,
Germany
8
Astrophysics Group, Department of Physics and Astronomy, University of Exeter,
Stocker Road,
Exeter
EX4 4QL,
UK
9
Space Science Institute,
4765 Walnut St., Suite B,
Boulder,
CO
80301,
USA
10
Department of Physics, University of Cincinnati,
Cincinnati,
OH
45221,
USA
11
Observations Unlimited,
1417 11th Street,
Manhattan Beach,
CA
90266-6107,
USA
12
The Aerospace Corporation,
PO Box 92957,
Los Angeles,
CA
90009-2957,
USA
13
Prague,
15000,
Czech Republic
Received:
20
December
2022
Accepted:
3
November
2023
Abstract
Aims. In this work, we study the silicate dust content in the disk of one of the youngest eruptive stars, V900 Mon, at the highest angular resolution, probing down to the inner 10 au of said disk, and study the historical evolution of the system, traced in part by a newly discovered emission clump.
Methods. We performed high angular resolution MIR interferometric observations of V900 Mon with MATISSE/VLTI with a spatial coverage ranging from 38 to 130-m baselines, and compared them to archival MIDI/VLTI data. We also mined and re-analyzed archival optical and infrared photometry of the star to study its long-term evolution since its eruption in the 1990s. We complemented our findings with integral field spectroscopy data from MUSE/VLT.
Results. The MATISSE/VLTI data suggest a radial variation in the silicate feature in the dusty disk, whereby at large spatial scales (≥10 au) the protostellar disk’s emission is dominated by large-sized (≥1μm) silicate grains, while at smaller spatial scales and closer to the star (≤5 au) silicate emission is absent, suggesting self-shielding. We propose that the self-shielding may be the result of small dust grains at the base of the collimated CO outflow previously detected by ALMA. A newly discovered knot in the MUSE/VLT data, located at a projected distance approximately 27 000 au from the star, is co-aligned with the molecular gas outflow at a P.A. of 250°(±5°) consistent with the position angle and inclination of the disk. The knot is seen in emission in Hα [N II], and the [S II] doublet and its kinematic age is about 5150 yr. This ejected material could originate from a previous eruption.
Key words: techniques: imaging spectroscopy / techniques: interferometric / protoplanetary disks / circumstellar matter / stars: individual: V900 Mon / infrared: stars
Based on observations collected at the European Southern Observatory under programs 092.C-0513(A), 094.C-0476(B), 0104.C-0607(A) and 0106.C-0510(A).
Visiting Astronomer, NASA Infrared Telescope Facility.
© The Authors 2024
 Open Access article, published by EDP Sciences, under the terms of the Creative Commons Attribution License (https://creativecommons.org/licenses/by/4.0), which permits unrestricted use, distribution, and reproduction in any medium, provided the original work is properly cited.
This article is published in open access under the Subscribe to Open model. This email address is being protected from spambots. You need JavaScript enabled to view it. to support open access publication.
1 Introduction
Mass accretion is an important factor in the process of star formation. In the case of low-mass young stellar objects (YSOs), and during their transition from Class I to Class II, circumstel-lar material is accreted onto a protostar through its circumstellar disk. Between evolutionary stages, the mass accretion rate can vary by a factor of 100–1000 or higher, especially if the star goes through eruptive phases (e.g., Hartmann 1998). It is a matter of debate whether eruptive phases are common in all low-mass YSOs, or whether these occur only in a unique subclass of objects (e.g., Fischer et al. 2023). The most well-known category of such events are the FU Orionis-type (FUor) eruptions (Herbig 1966, 1977; Hartmann & Kenyon 1996; Audard et al. 2014).
FUor eruptions are perhaps the most powerful events during star formation. The outbursts are due to episodically highly increased mass accretion (as high as ~10−4 M⊙ yr−1), leading to an extraordinarily high bolometric luminosity (up to 500 L⊙), which may last for a few decades. The archetype of the class, FU Orionis, was already known to have a protoplanetary disk (Hartmann & Kenyon 1985). More recently, studies using high-angular-resolution imaging techniques have found it to be rather compact compared to typical protoplanetary disks (e.g., Pérez et al. 2020; Liu et al. 2021; Lykou et al. 2022) . One of the most recent members of the FUor class is V900 Mon, whose eruption occurred sometime between 1950 and 2010 (Reipurth et al. 2012). It appears that the eruption is still ongoing based on photometric monitoring in the optical and infrared (Samus & Kazarovets 2011; Semkov et al. 2021). The star is surrounded by an intricate reflection nebula discovered by an amateur astronomer (Thommes et al. 2011).
V900 Mon is located at a distance of  pc (Gaia DR3; Bailer-Jones et al. 2021) in the vicinity of the Galactic plane (b ≈ −2.5°). The Infrared Astronomical Satellite (IRAS) dust extinction maps suggest an interstellar extinction, AV ≈ 6.4 mag in this direction (Schlafly & Finkbeiner 2011) but this measurement may be affected by the strong far-infrared emission of the nearby region LBN1022. Carvalho & Hillenbrand (2022) used the 5780 and 6614 Å diffuse interstellar bands (DIBs) to derive the local interstellar extinction to V900 Mon at AV ≈ 2.8 ± 0.4 mag. Young stellar objects are usually deeply embedded in the dust clouds from which they form, and therefore it is expected that the extinction toward V900 Mon might be higher when accounting for circumstellar matter. Connelley & Reipurth (2018) suggest an extinction of AV = 13.5 ± 2 mag, similar to Reipurth et al. (2012), by comparing the near-infrared (NIR) spectrum of V900 Mon to that of FU Ori. This is not surprising since the higher value of Connelley & Reipurth (2018) contains both circumstellar and interstellar extinction.
Atacama Large Millimeter/submillimeter Array (ALMA) observations of the molecular gas (carbon monoxide, CO) around the star suggest a biconical spatial distribution, with an opening angle of 70° for the blueshifted 12CO emission (Takami et al. 2019). This low-velocity component extends westward up to 5″ from the protostar, while the bulk of the emission arises within a region approximately 0.5″ in radius. The direction of said western outflow is oriented at roughly 250° east of north. Biconical molecular emission outflows typically have wide opening angles and low-velocity components (e.g., <100 km s−1) as opposed to collimated jets that show narrow opening angles with high-velocity shock-excited gas emission (e.g., ≥ 100 km s−1). Takami et al. (2019) hypothesized that the low-velocity outflow seen by ALMA could be formed by a collimated jet interacting with the surrounding gas.
Collimated jets have been found in just a few of the already known eruptive stars. Well-known examples are V346 Nor (Kóspál et al. 2020b), as evidenced by forbidden-line emission in the optical and the NIR (e.g., [O I], [S II], [Fe II]), and the binary system Z CMa (Antoniucci et al. 2016). Reipurth et al. (2012) obtained integral field unit (IFU) spectroscopic observations of V900 Mon with the Near-Infrared Integral Field Spectrometer (NIFS) on the Gemini North telescope, but they did not find signatures of jet-like emission within the instrumental 3″× 3″ field of view(FOV).
The intricate molecular emission could be associated with the reflection nebula around V900 Mon. The nebula is very bright only on the western side of the protostar, while if there is any emission eastward, this is very faint, as is the 12CO red-shifted emission (e.g., Fig. 2 in Reipurth et al. 2012 against Fig. 2 in Takami et al. 2019). This is consistent with a disk seen pole-on, as material behind the disk can be obscured. The complex reflection nebula displays helicoidal-like features, as seen in broadband imaging, for example in the r′-band maps of Reipurth et al. (2012) or in archival data from the VST Photometric Hα Survey of the Southern Galactic Plane and Bulge (VPHAS+, Drew et al. 2014) in the red, and the UKIRT Infrared Deep Sky Survey (UKIDSS, Lawrence et al. 2007) in the NIR.
According to Takami et al. (2019), a 1.3 mm continuum-emission component was marginally resolved at 200 × 150 milliarcseconds (mas) by ALMA. The authors estimate deconvolved sizes for the disk at about 67 × 58 mas. This translates to approximately 82 × 71 au at the Gaia distance. A re-analysis of those data sets by Kóspál et al. (2021) found that the disk position angle (PA) is 169 ± 73 degrees and the inclination is i = 28 ± 20 degrees1, suggesting the disk is nearly pole-on in our line of sight. Kóspál et al. (2021) give a lower limit for the disk mass at 0.01 M⊙ when utilizing the bolometric luminosity of Reipurth et al. (2012), however their RADMC-3D radiative transfer model predicts a higher disk mass at 0.3 M⊙, making this one of the most massive FUor disks.
Eruptive phenomena cause strong feedback on the surrounding circumstellar environment. Among the different physical, chemical, and mineralogical processes, the crystallization of amorphous silicates is one that was always anticipated in the literature but that has never been actually observed in FUors (e.g., Quanz et al. 2006). Interestingly, crystallization via thermal annealing at T > 1000 K has been detected in the less powerful and shorter outburst of EX Lup (Ábrahám et al. 2009). Kóspál et al. (2020a) analyzed VLT Imager and Spectrometer for mid Infrared (VISIR/VLT) mid-infrared (MIR) spectra of V900 Mon that indicated the presence of large-sized silicate grains in the disk, but could not provide a definitive answer on the presence of crystalline silicates at spatial scales ≤200 mas.
An initial study of eruptive stars at a high angular resolution in the MIR was performed by Varga et al. (2018) with the MID-infrared Interferometric instrument (MIDI; Leinert et al. 2003) of the Very Large Telescope Interferometer (VLTI). Recent technological developments with the introduction of the Multi AperTure mid-Infrared SpectroScopic Experiment (MATISSE; Lopez et al. 2014, 2022), which is the imaging interferometric instrument of the VLTI that operates in the MIR (3–13 μm), allow the simultaneous observations of eruptive star disks at superior uυ-coverage. Following the observations of the archetype FU Ori (Lykou et al. 2022), we employed MATISSE for an in-depth analysis of the disk of V900 Mon.
We also follow up on the detection of a collimated molecular outflow by ALMA (Takami et al. 2019) with wide-field, optical IFU observations of V900 Mon with the Multi Unit Spectroscopic Explorer (MUSE; Bacon et al. 2010) on the VLT.
A description of the observing program follows below (Sect. 2), while the observational results are presented in Sect. 3. Interpretations of said results can be found in Sect. 4, and these are followed by our conclusions in the last section.
2 Observations and methodology
2.1 MATISSE
We obtained snapshot observations with MATISSE/VLTI in the L and N bands (0104.C-0607(A); PI: P. Ábrahám). The source was observed at two epochs with the 8.2-m Unit Telescope (UT) array on December 11, 2019 and January 9, 2020. The observation log can be found in Table A.1.
In this work, we use the generic term “baseline” as opposed to the more accurate term “projected baseline” that takes into account its projection – length and/or PA – on the sky. The baseline coverage offered by the UTs was between 38 and 130 meters, and the respective angular resolutions ranged at ~3–9 mas in the L band and ~8–26 mas in the N band. We opted for the UT array due to the source’s faintness (correlated flux, Fcorr,N < 5 Jy). Although MATISSE offers simultaneous observations in the M band, these were rendered useless in this case, since the target’s correlated M-band flux was lower than the designated limits2 for the UTs. Hence, the M band is not used in this work. The FOV of MATISSE for the UTs is the size of the pinhole spatial filter, that is, 1.5λ/D ≈ 0.13″ at 3.5 μm and 2λ/D ≈ 0.5″ at 10 μm, where D = 8.2 m is the diameter of a single UT.
The observations were obtained in the low spectral resolution mode for all spectral bands (R = λ/∆λ ~ 30). Due to the lack of a hybrid calibrator for both bands, we opted for a CAL-SCI-CAL sequence, whereby each science exposure was bracketed by a calibrator suitable for the N and L bands: HD 47667 (K2III; = 2.61 mas) and HD 59381 (K4/5III; = 2.33 mas). The calibrator diameters were obtained from Bourgés et al. (2014). The data sets were reduced, processed, and calibrated with the standard MATISSE DRS pipeline (v. 1.7.5) and the wrapper Python tools3. Flux calibration was performed with a customized tool, as in Varga et al. (2021).
2.2 MUSE
In addition to the interferometric data, we report here MUSE/VLT observations of the circumstellar environment of V900 Mon and its reflection nebula. These were obtained on January 24, 2021 (program ID: 106.21KL; PI: F. Cruz-Saenz de Miera) using the WFM-AO-N mode. The “wide field mode” (WFM) provides a FOV covering 1′ × 1′ and a pixel size of 0.2″ × 0.2″. MUSE’s nominal mode (N) has a spectral coverage from 4700 to 9300 Å with a resolving power between 1770 and 3590. The Na Notch filter of the adaptive optics (AO) system creates a discontinuity in the spectrograph at 5800–5970 Å. The observations were executed in six 175 s exposures, resulting in a total integration time of 17.5 min. Each exposure after the first one was dithered by 1″ and rotated by 90°.
The observations were reduced using the MUSE pipeline (v.2.8.4) by ESO (Weilbacher et al. 2020), resulting in a fully calibrated and combined MUSE data cube with the instrumental signature and local sky background removed. Further analysis, such as extraction of stellar spectra and integrated images, was performed with designated IFU tools: <mono>mpdaf</mono>4 and QFits View5.
2.3 IRTF spectroscopy
We obtained NIR spectra using the SpeX spectrograph (Rayner et al. 2003) on January 15, 2015 and January 25–26, 2016 (cf. Table A.2). The spectra were recorded using the Echelle grating in both the short wavelength mode (SXD, 0.8–2.4 μm) and the long wavelength mode (LXD, 2.3–5.4 μm) using a 0.8″ slit. The spectra were reduced, corrected for telluric absorption, and flux-calibrated against a number of A0V calibrator stars using the SPEXTOOL data reduction package (for a detailed description of the methods used, we refer to Vacca et al. 2003 and Cushing et al. 2004).
Photometry was obtained using the SpeX guide camera in the K band on four nights between January 22 and January 26, 2016. The entrance aperture had a radius of 1.9″ (15 pixels on the camera) and the subtracted sky background was determined using an annulus of 2.4″ to 3.6″ (20–30 pixels).
The MIR spectra were obtained with the Aerospace Corporation's Broadband Array Spectrograph System (BASS, Hackwell et al. 1990) on January 14, 2015. BASS uses a cold beamsplitter to separate the light into two separate wavelength regimes. The short wavelength beam includes light from 2.9–6 μm, while the long wavelength beam covers 6–13.5 μm. Each beam is dispersed onto a 58-element Blocked Impurity Band linear array, thus allowing for simultaneous coverage of the spectrum from 2.9–13.5 μm. The spectral resolution, R, is wavelength-dependent, ranging from about 30 to 125 over each of the two wavelength regions (Hackwell et al. 1990). The (fixed) circular entrance aperture was 4″. The standard star, α Tau (K5+III), which was observed at a similar airmass to V900 Mon, was used for absolute photometric calibration.
The SpeX spectra from January 15, 2015 were scaled (due to light loss at the slit for the SpeX observations) to the flux-calibrated BASS data. The SpeX spectra from January 25–26, 2016 were scaled to the mean of the K-band photometry on January 22–26, 2016 (Table A.3).
2.4 Infrared photometry
We obtained NIR JHK images using two instruments between 2012 and 2019: CAIN-III on the 1.52-m Telescopio Carlos Sanchez (TCS) at Teide Observatory in Tenerife, Spain (PI: P. Ábrahám; detector specifications: 256 × 256 pixels, 1 arcsec/pix−1), and A Novel Dual Imaging CAMera (ANDICAM) on the 1.3 m Small and Moderate Aperture Research Telescope System (SMARTS) instrument located at Cerro Tololo Interamerican Observatory (CTIO) in Chile (PI: Á. Kóspál; detector specifications: 512 × 512 pixels, 0.27″ pix−1). We also mined archival data from REMIR on the Rapid Eye Mount telescope (REM; Zerbi et al. 2004) in La Silla Observatory, Chile (PI: M. Curé; detector specifications: 512 × 512 pixels, 1.23″ pix−1). The log of observations is presented in Table A.2.
Observations were performed in a 5-point dither pattern in order to enable proper sky subtraction. Exposure times of individual frames ranged between 0.5 and 6 sec. The images were reduced using our custom-made IDL6 routines. Data reduction steps included sky subtraction, flat-fielding, registration, and co-adding exposures by dither position and filter. To calibrate our photometry, we used the Two Micron All Sky Survey (2MASS) catalog (Cutri et al. 2003). The instrumental magnitudes of the target and typically 5–15 good-quality 2MASS stars in the field were extracted using an aperture radius of 2″ and a sky annulus between 3.6″ and 4.8″ in all filters. The annulus was intentionally placed inside the extended nebulosity surrounding the star, in an attempt to remove the nebula’s contribution, which finally turned out to be only a minor factor in the photometry. We determined a constant offset between the instrumental and the 2MASS magnitudes and used it to calibrate V900 Mon. The results are listed in Table A.3 and Fig. 1.
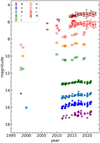 |
Fig. 1 Evolution of V900 Mon. For a description of the data, see the main text in Sects. 2.4 and 3.1. |
2.5 MIDI
V900 Mon was observed with MIDI/VLTI on December 21, 2013 and January 7, 2015 (program IDs: 092.C-0513(A), 094.C-0476(B); PI: M. Curé) with the UT2-UT3 (47 m) and UT1-UT4 (130 m) baselines, respectively. Both observations were obtained in average seeing conditions (0.8″–1.1″) however the latter suffered from a short atmospheric coherence time (Table A.1).
The first data set was reduced and analyzed for the MIDI Atlas project7 (Varga et al. 2018). The second data set was obtained with the use of an external fringe tracker, namely the Phase-Referenced Imaging and Micro-arcsecond Astrome-try Fringe Tracking Unit A (PRIMA FSU-A), operating in the K band (Müller et al. 2014). Only the correlated flux is recorded in this instrumental mode, and therefore no photometry was obtained for this run. This data set was reduced with MIDI’s EWS pipeline using calibrators HD 36673 (F0Ib, = 1.69 mas) and HD 44951 (K2III, = 1.73 mas). The calibrator properties were extracted from Bourgés et al. (2014).
The MIDI correlated spectra shown here (cf. Sect. 3.2) are the mean of the individual spectra from each calibrator. The typical uncertainty for MIDI is about 10% (Chesneau 2007). Since both MIDI observations were obtained with baselines identical to those of MATISSE, we compare these data sets’ correlated fluxes against the MATISSE data in Sect. 4.2.
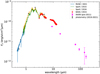 |
Fig. 2 Spectral energy distribution of V900 Mon from the optical to the far-infrared. The two absorption lines seen in the MUSE spectrum are the Hβ and Hα lines. The SED has not been corrected for extinction. |
3 Results
3.1 The evolution of V900 Mon
The optical light curve of V900 Mon is shown in Fig. 1. The archival data were extracted from Semkov et al. (2021) in BVRcIc filters, including the earlier Deep Near Infrared Survey of the Southern Sky (DENIS) I-band photometry.
Figure 1 also shows the infrared light curve of V900 Mon in the JHKL and M bands. It comprises our own photometry (Sect. 2.4) and archival data from: DENIS (JKs), 2MASS (JHKs), Spitzer (3.6 and 4.5 μm), the Wide-field Infrared Survey Explorer (WISE, 2010–2012; Wright et al. 2010), and the Near-Earth Object Wide-field Infrared Survey Explorer Reactivation Mission (NEOWISE, post-2014; Mainzer et al. 2014), Samus & Kazarovets (2011), JHK), Reipurth et al. (2012), JHKL′M′), Varricatt et al. (2015), L′M′), and Connelley & Reipurth (2018), K). The WISE and NEOWISE data are binned per 180 days and were corrected for saturation following the instrument’s documentation8. Differences between the WISE/NEOWISE and ground-based photometry (e.g., 2011 and 2016) can be attributed to different photometric apertures used between satellite and terrestrial observations, an overcorrection for source saturation in the WISE/NEOWISE data, and differences in the filters used.
As is evident in Fig. 1 the source has continued to slowly brighten over the last 20 yr, with a temporary fade in the period 2018–2019. The infrared light curve in J, H, and K could suggest an overshoot in 2010 (photometry by Reipurth et al. 2012), however there was no contemporaneous photometry in the optical to confirm this.
Figure 2 shows the spectral energy distribution (SED) of V900 Mon, which is that of a typical FUor. SpeX/IRTF spectra also indicate a small brightening within a single year, similar to what is seen in the light curve (Fig. 1). Earlier photometry by the AKARI satellite might also indicate that the source was fainter in the MIR before 2011. The SED of Fig. 2 has not been corrected for extinction.
The evolution of the source in the NIR and the optical is shown in the color-magnitude diagrams in Fig. B.3. The V – R versus V color-magnitude diagram of the Semkov et al. (2021) optical photometry suggests that a decrease in the extinction may have contributed to the brightening of V900 Mon after 2012. However, the R – I versus R diagram (Fig. B.3, bottom) indicates that the source became bluer after the 2018/9 dimming.
Disk sizes (FWHM) at 1.3 mm continuum from the literature compared with MATISSE N-band results.
3.2 MATISSE
Typically in young stellar objects – including FUors – the inner accretion disk extends to a distance of ≤1 au from the star, while the outer passive disk extends further outward up to ~100 au (e.g., Dullemond & Monnier 2010; Hartmann et al. 2016, and references therein). The hot inner disk emits at wavelengths below 3 μm, while the cooler outer disk emits mainly at longer wavelengths (e.g., N-band and sub-millimeter).
The MATISSE L- and N-band data suggest a partially resolved source with squared visibilities9, V2 ≥ 0.2 at 3.5 μm. Initial estimates of the source’s geometry were made by fitting ID Gaussian functions to the MATISSE data at 3.5 μm and 10.7 μm (Figs. 3a,b). The full width at half maximum (FWHM) for each band is 2.4 ± 0.2 and 7.0 ± 0.2 mas, respectively. These translate to physical diameters of about 3 and 9 au, respectively. Therefore, the inner accretion disk is confined within a 1.5 au radius, while the majority of the emission of the dusty disk in the N band originates within a radius of roughly 10 au.
The MATISSE closure phases, shown indicatively in Figs. B.l and B.2, were of poorer S/N due primarily to atmospheric variations during the observing runs. Although some closure phases are nonzero, which could suggest asymmetry, they also appear to be relatively constant, but the uncertainties are quite large. As such, the closure phases are not used in this work.
The most prominent result from these MATISSE observations is the variation in the N-band correlated fluxes with respect to the baselines. In Fig. 4 (top panel), the correlated fluxes are plotted from top to bottom per increasing baseline length for each epoch, indicating the difference in flux levels. The distinct decrease in correlated flux levels per baseline suggests a radial variation in the emitting region. This is corroborated by the MIDI correlated fluxes (black and gray lines in Fig. 4) that were obtained at similar baselines (cf. Sect. 2.5), which bracket the MATISSE data and follow a similar pattern for each baseline. This variation is also illustrated when the MATISSE correlated spectra are shown against spatial frequency and color-coded for each wavelength (bottom panel, Fig. 4). We explore this variation aspect further in subsequent sections (Sect. 4.2).
V900 Mon’s disk was detected first in the millimeter regime by ALMA (Takami et al. 2019) and it was found to be oriented nearly pole-on (cf. Table 1). Here, we attempt to estimate the disk’s 2D size in the N band following the same method as in Varga et al. (2021). The fitting process of a 2D Gaussian distribution resulted in a FWHM of  mas at 9.5 μm, with a major axis PA of
  degrees, and an inclination,
  degrees (χ2 = 2.4). For such a small inclination, the fit of the PA was not well constrained, as is evident by the large errors, because the disk itself is nearly pole-on and it is therefore difficult to constrain its ellipsoidal geometry. Literature values for the disk’s inclination vary (Table 1). Recently, Kóspál et al. (2021) calculated an inclination of 28 ± 20 degrees from ALMA data. Unless higher-angular-resolution ALMA observations are obtained in the future, we cannot come to a conclusion about a potential misalignment between the MATISSE and ALMA detections.
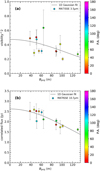 |
Fig. 3 Centro-symmetric model fits (ID Gaussian distributions) to the monochromatic squared visibilities at 3.5 μm (top panel), and to the monochromatic correlated fluxes at 10.7 μm (bottom panel). |
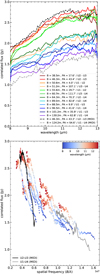 |
Fig. 4 MATISSE and MIDI correlated fluxes. Top panel: each MATISSE correlated spectrum is color-coded by the individual baseline; in the legend, we specify the length and PA of each one. The apparent decrease in flux levels with increasing baseline length from top to bottom is indicative of a radial variation in the emitting region. Also shown here are the MIDI spectra (dashed black and gray lines) that follow a similar pattern. Bottom panel: the MATISSE correlated fluxes are plotted vs. spatial frequency and they are color-coded with respect to wavelength (as indicated in the color bar). The MIDI data are shown for reference (black and gray lines). |
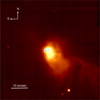 |
Fig. 5 White image of V900 Mon and Thommes’ nebula from MUSE (4700–9300 Å). The cross sign marks the location of the star and the drawn green line marks the bulk of the emitting region that includes the ellipsoidal component (Sect. 3.3.2). The FOV is 1′ × 1′. The image has been stretched at arbitrary levels of the square root of intensity to enhance the nebula's features. |
3.3 MUSE
The MUSE data are a forest of information. In this work, we explore the relationship between star, disk, and environment using gas and/or dust measurements from ALMA, MATISSE, and MUSE. A full analysis of the MUSE data sets will be presented in a forthcoming paper (F. Cruz-Sáenz de Miera et al., in prep.).
3.3.1 The spectrum of the inner circumstellar region
Figure 5 shows the white image of the collapsed MUSE spectral cube along the entire spectral axis (4700–9300 Å). As is evident, emission from the reflection nebula (Thommes’ nebula) dominates. A description of the complex nebular morphology can be found in Appendix C.
The star itself is not resolved, but the majority of the emission originates within a few MUSE spaxels around the Gaia position of V900 Mon. Our aim was to construct the spectrum of the inner part of the system (cf. Sect. 3.2) with minimal contribution from the nebula. Therefore, even if the physical radius of the proto-planetary disk were 100 au, the disk’s angular size would be ≈ 160 mas at the adopted Gaia distance, and as such the entire system is confined within a single MUSE spaxel. We consider this to be the inner circumstellar region or else the “star+disk” component.
We extracted a spectrum within a 0.6″ radius aperture at the location of V900 Mon. The spectrum (blue, Fig. 6) is typically FUor-like with lines such as Hβ, Hα, and the Ca II triplet, seen in absorption. All lines are blueshifted with respect to rest wavelengths (bottom panels, Fig. 6). Typical signature lines of jet-like origin are absent (e.g., [O I] at 5577, 6300, and 6364 Å and Fe lines). We cannot compare the Na D doublet to earlier results by Reipurth et al. (2012), since this falls within the spectral discontinuity of MUSE.
The Balmer lines are quite broad (width larger than 600 km s−1). We estimate the blueshifted radial velocities of the Balmer lines – after applying barycentric and heliocentric corrections – in the deepest troughs to be about −230 ± 10 km s−1. These velocities are slightly higher than those found by Reipurth et al. (2012) for Hα, however their observations were obtained at a higher spectral resolution, which allowed the separation of individual peaks within the trough.
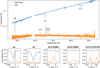 |
Fig. 6 MUSE spectra of V900 Mon (star+disk; blue) and the ELK (orange). Prominent lines in the V900 Mon spectrum, like hydrogen Balmer lines and the Ca II triplet, are seen in absorption. In the knot spectrum, the Hα, [N II], and [S II] lines are clearly seen in emission, while the [O I] line suffers from terrestrial contamination (e.g., airglow O I). Both spectra are affected by skyline contamination at the blue and red ends. The spectra have not been corrected for extinction. Normalized line profiles vs. radial velocities (corrected for systemic velocity) are shown in the bottom panels. |
3.3.2 Synthetic photometry
When comparing the above-mentioned MUSE IFU spectrum to the NIR SpeX spectrum, we note a significant difference in absolute flux levels; the MUSE spectrum is fainter by a factor of thirty. We attribute this difference to the continuum contribution from the reflection nebula (Fig. 5), which has also been shown to emit strongly in the NIR (Reipurth et al. 2012), since the absolute photometric calibration of the SpeX spectra was based on wide-aperture photometry. If we increase the aperture radius for the extracted MUSE spectrum to 1″, and thereby allow additional continuum emission within the aperture, then we can finally float the two spectra. We also note that when such a large aperture is used the blue end of the MUSE spectrum increases, suggesting an increase in scattered light emission from the nebula.
As such, extracting synthetic photometry of the star+disk system from the MUSE data can be problematic. One-dimensional cuts vertically and horizontally through the star’s position at various cube channels indicate three sources of emission: (1) the star+disk system (within a 1″ radius), (2) an ellipsoidal component adjacent to the star toward the northwest (cf. Fig. 5), and (3) a large-scale source to the west and southwest (Thommes’ nebula). To minimize the contribution from the last two sources, we opted to subtract the nebular emission over each channel map using a median-subtraction algorithm and an 11 × 11 pixels box. Although this technique leaves some residual emission over the nebula, it can separate the stronger emission components, that is, the star+disk and the ellipsoidal component.
Broadband-equivalent images were created from this median-subtracted spectral cube in the Johnson V and Cousins Rc and Ic filters with <mono>mpdaf</mono> routines. To further remove the residual contribution from the nebula to the spectrum of the circumstellar region, we clipped the western section of each broadband image (i.e., west of the star) and replaced it with a mirror image of the eastern section. The latter had already been “cleaned” of any nebular emission by the median-subtraction process. Aperture photometry with an aperture radius of 2″ was extracted from these images, with various methods used to confirm the consistency. The synthetic photometry in the Johnson V, Cousins Rc, and Cousins Ic bands is 17.34, 15.67, and 14.01 mag, respectively. The uncertainty (0.06 mag) reflects the differences between the aperture photometry algorithms used in this exercise. The MUSE photometry is used to constrain the model in Sect. 4.1.
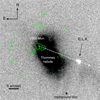 |
Fig. 7 Continuum-subtracted Hα linemap of V900 Mon and Thommes’ nebula. The map has been linearly scaled to enhance the emission features (in white) and designate the scattered light continuum from the nebula and background sources (shaded black regions). The green contours (arbitrary levels) mark the CO (2–1) moment-zero map similar to Takami et al. (2019), showing the blueshifted emission component to the west and part of the redshifted wide-angle lobe to the east. The ELK is clearly visible and co-aligned with the blueshifted CO outflow, as indicated by the guiding arrow (PA ~ 250° east of north). The FOV is 50″ × 50″. |
3.3.3 Discovery of an emission line knot
A visual inspection of the continuum-subtracted line maps at the Balmer lines, as well as the typical lines suggesting jet-like signatures (e.g., [O I], [S II]), revealed an emission line knot (ELK) at a distance of 22″ ± 1″ from the stellar position (see Fig. 7). The projected distance of the knot, by adopting the Gaia distance, translates to approximately 27 000 au or 0.13 pc. The size of the knot is approximately 1.30″ × 0.98″ (2D Gaussian fit). The knot is well aligned with the collimated CO outflow detected within 5″ of the star by Takami et al. (2019), which is within a PA of 250 ± 5 degrees east of north. This is perpendicular to the disk’s major axis. If the disk’s inclination is i = 14° then the knot’s distance can be de-projected (i.e., when divided by sin(i)) onto the polar axis of the disk, which translates to approximately 111 600 au or 0.54 pc.
Figure 6 also shows the knot’s spectrum (orange). The Hα line is dominant, while Hβ is not detected (that spectral region is of lower S/N). It also shows the [O I] 6300 Å in emission but this might be blended with terrestrial O I emission, while the 6364 Å line is absent or too weak to be detected. On the other hand, the [N II] blue component at 6548 Å is very weak, as opposed to the red component at 6584 Å. Most importantly, the [S II] doublet (6716/30 Å) is seen in emission. All of the above hints that the gas is shock-excited.
All emission lines are blueshifted with respect to rest wavelengths, with an average radial velocity (after applying barycen-tric and heliocentric corrections; cf. bottom panels in Fig. 6) of about −100 km s−1. The de-projected velocity of the knot in the plane of sky is 25 km s−1 and the knot’s kinematic age is approximately 5150 yr, assuming a constant velocity. This age is far greater than the alleged post-1960s eruption of V900 Mon; however, the true motion of the knot can only be revealed with future IFU observations to determine whether the gas is in expansion.
We used <mono>mpdaf</mono> routines to calculate integrated fluxes for each emission line, and the <mono>PyNeb</mono> software (Luridiana et al. 2015) for line diagnostics. From the [S II] 6716/30 Å line flux ratio we estimated an electron density, ne = 950 ± 100 cm−3, assuming Te = 10 000 K. From the Balmer line ratio, and assuming Case B recombination as per Osterbrock & Ferland (2006), we deduced an extinction of AV = 3.4 ± 0.2 mag for typical Milky Way values (RV = 3.1). This value is similar to the interstellar extinction derived by Carvalho & Hillenbrand (2022), that is, AV ≈ 2.8 ± 0.4 mag.
The reflection nebula itself appears to have some structure. At least one globule is visible within the nebula but it is not in emission (Fig. C.1). Their nature is unclear. A full analysis of MUSE data on the reflection nebula will be the basis of a forthcoming paper.
4 Discussion
4.1 Accretion disk model
The MATISSE observations revealed a marginally resolved structure toward the center, smaller than 2.5 mas (Sect. 3.2) or a diameter of <3 au), which we interpret as an inner accretion disk, a usual component of FUor disks (Hartmann & Kenyon 1996). Since the interpretation of these MATISSE snapshot observations is model-dependent, we opted to simulate the inner accretion disk with a typical, steady-state, geometrically thin but optically thick disk model as in Lykou et al. (2022).
The disk model was fitted to the MUSE synthetic photometry, the SMARTS JHKs photometry (Table A.3), and the averaged 2019–2021 NEOWISE photometry (W1 and W2 bands) that was corrected for saturation (Fig. 8). While these observations are not simultaneous, they were obtained within a few years, and according to the light curve (Fig. 1) V900 Mon’s brightness was relatively constant during that time. Therefore, we could combine these observations into an SED.
In the case of V900 Mon, the fitted parameters (Table 2) were the product of the stellar mass and the mass accretion rate (M*Ṁ) and the extinction (AV). The fitted parameters’ uncertainties were estimated with a Monte Carlo approach, assuming 0.05 mag uncertainty on each measured photometric point, and then allowing 100 iterations on slightly modified photometric data randomly tuned within the error bars.
The disk’s inclination was fixed at 14°, as was estimated from the MATISSE N-band data. We also attempted to fit the disk at the inclination suggested by the ALMA data (Table 1) but the results were similar for such a pole-on disk. The disk’s outer radius, Rout, was fixed at 1.5 au based on the angular size estimates in the L band. Overall, extending the outer radius further does not modify the fit to the SED, since the majority of the disk flux originates within a region of 1–1.5 au.. The inner radius, Rin, was fixed equal to the stellar radius at R* = 2 R⊙. The latter is based on the FU Ori model of Lykou et al. (2022), presuming that V900 Mon is another typical FUor. However, the inner radius cannot be constrained further and this is a known degeneracy for this model10. The best-fit model from our parametric search is shown in Fig. 8. By integrating the synthetic SED, we calculated an accretion disk luminosity, Ldisk = 314 L⊙.
A first assessment of the extinction was made using a similar comparison to Connelley & Reipurth (2018) between the FU Ori SpeX/IRTF spectrum (Connelley, priv. comm.) and our V900 Mon spectrum from the same instrument (see Sect. 2.3) between 1 and 4 μm. We cannot confirm a circumstellar extinction as high at 13.5 mag, as was derived by Connelley & Reipurth (2018), as we note that the slope of the V900 Mon spectrum increases toward the blue (that is, below 1.4 μm) when AV > 9 mag.
For the given parameters and photometry, the accretion disk model predicts an extinction, AV = 8.80 ± 0.06 mag, and  . Assuming a stellar mass of 1 M⊙, the accretion rate, Ṁ, becomes ≈4 × 10⁻⁵ M⊙ yr−1. If the eruption occurred 30 yr ago and the accretion rate was stable at this value for this 30-yr period, then the star has already accreted approximately 1 Mjup.
This accretion disk model can give a first approximation of the inner disk’s properties based on the current observables. Future interferometric observations (e.g., K-band with GRAVITY/VLTI for hydrogen and CO gas) would help to constrain further the accretion disk’s properties.
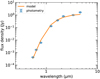 |
Fig. 8 Accretion disk model against the 2019–2021 photometry of V900 Mon from MUSE, SMARTS, and NEOWISE. |
Accretion disk model parameters.
4.2 Dusty disk
In Sect. 3.2 we showed the radial variation of the correlated spectra with respect to the baseline length in the MATISSE and MIDI data. Protoplanetary disks in FUors are silicate-rich; however, this is not clear from the correlated spectra. In the following, we disentangle the 10 μm silicate feature from the spectra and examine any variations with respect to baseline length.
4.2.1 Radial distribution of amorphous silicates
We followed the method of van Boekel et al. (2003) to enhance the 10 μm silicate feature by subtracting the continuum emission from each baseline. The continuum was linearly fit between 8.5 and 12.5 μm at each baseline. This allows the removal of the noisier part of the spectrum at longer wavelengths, an effect that appears to be common in MATISSE observations of faint targets (i.e., ≤5 Jy). The continuum was subsequently subtracted from the correlated spectrum, and then the correlated spectrum was normalized by dividing it with the mean value of the continuum. These normalized and continuum-subtracted correlated spectra are shown in Fig. 9. Here, the spectra have been plotted from top to bottom and left to right in decreasing baseline length – from U1-U4 ( ~ 130 m) to U2-U3 ( ~ 40 m) – and an offset has been applied for clarity. Darker colors correspond to the 2019 data and lighter colors to the 2020 data. Also plotted for reference are the MIDI spectra (black and gray lines). The uncertainties of the correlated spectra are shown as shaded regions in Fig. 9, indicating the low S/N for V900 Mon.
A change in the strength of the 10 μm silicate emission feature with respect to each baseline is noticeable in these normalized spectra (Fig. 9). The feature is stronger and in emission at the largest spatial scales of the disk (i.e., r < 18 au), as is indicated by the shortest baselines (U2-U3 and U1-U2). It presents the typical trapezoidal shape expected for larger-sized grains (grain size ≥ 1 μm; e.g., Bouwman et al. 2003).
The strength of the feature diminishes at smaller spatial scales and at the intermediate-length baselines (U3-U4 and U2-U4), while it appears to be near-zero or even negative at the smallest spatial scales (i.e., r < 7 au) and at the maximum baseline length (U1-U2 and U1-U4). This variation is supported by the archival MIDI correlated spectra for which a similar process was followed (also in Fig. 9). The short-baseline spectrum (U2-U3) also indicates a trapezoidal shape as in the MATISSE data, while the long-baseline spectrum (U1-U4) are more heavily affected by the terrestrial ozone layer (9.4–9.9 μm). It is worth noting that the peak of the normalized spectrum for the shortest baseline is near 11.4 μm, unlike the MATISSE spectrum. However, the MIDI spectrum suffered from an abrupt jump in flux between 11.7 and 12.2 μm, which could have affected the final shape of the normalized spectrum.
Considering that the disk of V900 Mon is viewed nearly pole-on, this suggests that silicate emission from larger grains originates from the disk surface at radii larger than 10 au from the star, while at the inner-most regions of the disk (r < 7 au), the silicate emission is either absent or this region is self-shielded by optically thicker material consisting of small-sized grains.
This radial variation can be elucidated further when averaging baselines (from Fig. 9) that cover similar spatial scales -and therefore different disk regions – over both epochs. These averages are shown in Fig. 10. In more detail, these show the average of the shortest baselines (U2-U3 and U1-U2) that probe regions r < 16 au (blue line), then intermediate baselines (U3-U4 and U2-U4) which probe regions r < 12 au (orange line), and finally the longest baselines (U1-U3 and U1-U4) for r < 7 au (green line). Furthermore, we compared these to the MIDI normalized correlated spectra (dashed gray lines) at similar baselines (Fig. 9). The silicate feature not only weakens, but its shape changes as well: the 9.7 μm part weakens, while the longer wavelength part remains stable, and the overall shape becomes more triangular, with a peak around 11 μm. The error bars shown in Fig. 10 are the standard deviations of the averaged spectra. Further mineralogical analysis follows in the next section.
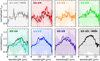 |
Fig. 9 MATISSE and MIDI normalized continuum-subtracted correlated spectra per baseline. From top-left and clockwise the spectra are plotted from the longest baseline to the shortest, while an offset has been applied for clarity. The MATISSE 2019 data are drawn in darker shades of color compared to the respective 2020 data, which are shown in lighter shades. The MIDI data are shown as black and gray lines. The uncertainties of the normalized correlated fluxes are shown for comparison as shaded regions. |
4.2.2 A lack of crystalline silicates
Crystalline silicates appear to be common in protoplanetary disks around Herbig and T Tauri stars (e.g., van Boekel et al. 2005; Olofsson et al. 2009) but are apparently absent from disks around FUors (e.g., Quanz et al. 2007; Kóspál et al. 2020a). However, crystalline silicates have been found in other types of eruptive stars (e.g., EX Lupi, Ábrahám et al. 2009).
For the case of V900 Mon, Varga et al. (2018) analyzed the uncorrelated MIDI spectra from 2013, which represent silicate emission inside and outside a radius of 18 au, but their results were inconclusive due to low S/N. Kóspál et al. (2020a) analyzed VISIR/VLT MIR spectra that represent silicate emission over the entire disk, but concluded that V900 Mon, like all FUors, contains large amorphous grains.
We examined the MATISSE normalized spectra of Fig. 10 for any signs of crystalline silicate emission by overplotting the spectrum of comet Hale Bopp (brown line) that contains high fraction of crystalline silicates (e.g., forsterite). For comparison, we also show the Galactic Center spectrum of small-sized amorphous silicate grains (red line, Kemper et al. 2004). There is no noticeable emission at the typical narrow emission band at 11.3 μm in any of the baselines at this S/N levels. Overall, we see no unequivocal signs of crystalline silicates in the MATISSE spectra.
4.2.3 Circumstellar extinction
Our accretion disk model suggested a circumstellar extinction of AV ~ 9 mag (Sect. 4.1). However, the silicate feature is clearly seen in emission at the largest spatial scales (Fig. 10) and within a FOV of 0.5″, which contradicts such high extinctions.
Quanz et al. (2007) noted that the silicate profiles of FUors that are in emission, once corrected for interstellar extinction, have a similar shape. Here, we built on this result and assumed that the spectral shapes are indeed identical. As shown earlier, the silicate feature disappears below 10.5 μm at the smallest spatial scales. We explored whether varying amounts of extinction can account for the variation of the silicate feature at different spatial scales compared to our baseline feature, which is the typical trapezoidal shape shown in blue in Fig. 10. We opted for the extinction law of Gordon et al. (2021) that covers the MIR regime.
Since the disk is seen pole-on, let us presume that the silicate feature should be in emission over its entire surface. Hence, we reddened the averaged spectrum (seen in blue in Fig. 10) by different AV with the extinction law described above. As it is shown in Fig. 11, we can match11 the averaged and normalized correlated spectra for the two other baselines (those shown in orange and green colors in Fig. 10) by applying AV = 0.5 and 3.0 mag, respectively. If we presume that the interstellar extinction is 3.4 mag (Sects. 3.3.3 and 4.1), then we find that the total extinction in the line of sight is approximately AV = 6.4 mag toward the central 10 au radius area of the star. This demonstrates that the extinction varies depending on the line of sight. We explore this in the following sections.
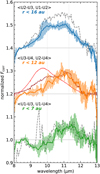 |
Fig. 10 MATISSE normalized and averaged spectra (both epochs) of Fig. 9 per different baselines as indicated in the legend. From top to bottom, the three spectra (blue, orange, and green) correspond to different regions of the protoplanetary disk within radii of 16, 12, and 7 au, respectively. An offset has been applied for clarity. Overplotted for comparison are the MIDI normalized spectra (gray; dashed), the profile of ISM silicates (red line, Kemper et al. 2004), and the normalized spectrum of comet Hale-Bopp (brown line). The two dotted vertical lines act as simple guides for the eye at 10 and 11.3 μm. |
4.3 A hidden companion, a stratified disk, or a dust clump?
4.3.1 Companion
An alternative scenario besides the localized extinction to explain the spectral shapes at the longest baselines would be the presence of a companion. A companion with a sufficient separation and flux ratio might be responsible for the modulation-like signal in the long-baseline MATISSE normalized correlated spectra (bottom panel in Fig. 10). Theoretical works suggest that FUor outbursts can be triggered by flyby events, where a companion transverses through the protostellar disk, triggering increased accretion onto the protostar (Bonnell & Bastien 1992). Signatures of such flyby stars are streams of material seen in scattered light, such as in the case of Z CMa (Canovas et al. 2015), for which Dong et al. (2022) identified a strong candidate source as a flyby star. At present, we are not aware of any polari-metric imaging observations of V900 Mon that could potentially reveal such features.
If we presume a flyby star traveling at 10 km s−1 might have interacted with V900 Mon in the last century, then this star could be found within a maximum distance of 175 mas (210 au) from the star. Such a distance is potentially within the FOV of the UTs with MATISSE (0.5″ at 10 μam). However, that is also within the capabilities of ALMA, although neither Takami et al. (2019) nor Kóspál et al. (2021) found any wide-orbit companion, that is, one outside V900 Mon’s disk (i.e., beyond ≥50 mas, based on its deconvolved size). If a flyby companion exists within 50 mas from the protostar, then this ought to be bright in both the L and N bands to be detectable in the MIR, normalized correlated spectra, as well as at a distance larger than at least one resolution element in the N band (i.e., ≈ 10 mas).
Previous studies have shown that MATISSE is able to detect companions at a flux ratio as low as 2% within an orbital separation of 100 mas in the L band (Lopez et al. 2022), however those estimates resulted from higher S/N data. The lack of a distinct sinusoidal modulation in the L- and N-band closure phase signals (Figs. B.1 and B.2) suggests that no companion was detected with these MATISSE observations. Attempts to estimate the detectability of a companion with the current data set using the methods of Gallenne et al. (2015) and Mérand (2022) have been inconclusive due to (a) the limited uυ-coverage and therefore the expected degeneracy of any solution regarding the location of a companion, and (b) the low brightness of the science target and the known instrumental biases for MATISSE. Taking into account these degeneracies, a potential companion ought to be much brighter than ⪢5% to be detectable in this data but no such signature is seen here. Perhaps future observations at higher S/N may help to confirm or disprove the presence of a flyby star within 10–50 mas from V900 Mon. For such a faint target, MATISSE/GRA4MAT observations would be recommended.
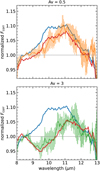 |
Fig. 11 Averaged and normalized correlated spectra (blue) of the shortest baselines (cf. top panel in Fig. 10) reddened with the extinction law of Gordon et al. (2021) and AV = 0.5 and 3 mag in the top and bottom panels, respectively. The reddened spectra (red) are a good fit to the averaged-normalized spectra from the intermediate (orange; top panel) and longest baselines (green; bottom panel). |
4.3.2 Previous temperature gradient models
Varga et al. (2018) modeled the 2013 MIDI short-baseline data with a thin, flat, passive disk of fixed outer radius (300 au), a dust sublimation temperature of 1500 K, and a power law temperature distribution (T ∝ R−0.69). They calculated a dust sublimation radius ≈1.4 au, which translates to about 1.3 mas for their adopted distance. This radius is of a similar size to the radius of the disk region emitting in the L band, as was derived by a centro-symmetric brightness distribution fitting of the MATISSE data, and is thus comparable to the size of the simulated accretion disk (Sect. 4.1).
Their disk model indicates that half of the MIR flux is emitted within a radius of  . However, this would be roughly the radius at which the silicate feature is in absorption (Fig. 10). Consequently, either the majority of the emission arises from its edge, or the simple temperature-gradient model (although it can fit the MIDI data) is not sufficient.
4.3.3 Dust clump
In Sect. 4.2.1, we showed that there may be material shielding the innermost regions of the protoplanetary disk. Since the disk is oriented nearly pole-on, this material could be interpreted as a “clump” of small dust grains on top of the protoplanetary disk, or else as the origin of the molecular outflow emanating from the disk (Takami et al. 2019). We therefore presume that this material is in our line of sight. A sketch of this assumed geometry is shown in Fig. 12. A similar geometry has been postulated for the Herbig Ae star HD 163296, which has Herbig-Haro objects and where the star presumably suffered a dimming event due to a dust cloud (Ellerbroek et al. 2014; Pikhartova et al. 2021).
Although the exact structure and composition of these silicate grains cannot be constrained from the MATISSE spectra, based on our analysis in Sect. 4.2.1, we assume that this material is primarily composed of small and spherical amorphous silicate dust grains with a grain size α ≤ 0.1 μm. If the circumstellar extinction is about AV = 3 mag (Sect. 4.2.3), then following the Gordon et al. (2021) law, we calculate an extinction of Asil ≈ 0.25 mag for the 10 μam silicate feature. The optical depth of the silicate feature is τsil ≈ 0.23.
We estimate the dust mass using τsil = ρdust κabsℓ, where ρdust is the dust mass density and is equal to Mdust V−1 for a dust mass, Mdust, in a volume, V, ℓ is the length along the line of sight, and for small-sized (a ≤ 0.1 μm) amorphous silicate dust, the mass absorption coefficient12, κabs, is ≈4000 cm2 g−1. It is easy to show that, for a cylinder of radius r and its volume calculated along the line of sight, the above equation becomes  . Since the material is constrained within a radius, r ≤ 5 au, the amount of dust enclosed becomes Mdust ≈ 9.9 × 10²³ g. This is approximately the mass of the dwarf planet Ceres. For a higher circumstellar extinction (Sect. 4.1), the dust mass is slightly larger at ≈2.9 × 1024 g. This is a tentative estimate since: (a) we assumed a mass absorption coefficient for amorphous silicate grains of a certain size, (b) we did not take into account the disk’s inclination13 and the fact that only part of the disk might be obscured, (c) the dust volume could be much smaller than what is assumed above, and (d) the disk morphology and origin of the CO outflow may be more complex than what is assumed in this simplistic analysis. We expect that follow-up imaging in the NIR and sub-millimeter wavelengths may shed more light on the complexity of the disk and its surrounding region, followed by future explorations of radiative transfer simulations of the protoplanetary disk's properties.
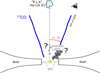 |
Fig. 12 Cartoon indicating the presumed geometry of the system. The drawing is not to scale. |
4.4 Collimated outflow: traces of a jet?
We analyzed archival images of V900 Mon from VPHAS+ in ugri and Hα filters, from the Panoramic Survey Telescope and Rapid Response System (Pan-STARRS1; Chambers et al. 2016) in grizy filters, and UKIDSS in JHK filters. Although the surveys differed in terms of sensitivity, filters, and the telescope apertures used, we identified common features overall, the most prominent being a “helicoidal” tail that fans out beyond 20″ west-southwest from the star and that is seen at all wavelength ranges, although it is brighter in the visual. Part of this tail is also seen by MUSE, although the chosen FOV is smaller than the full extent of the nebula to the west14.
In Sect. 3.3, we showed the ELK discovered in the MUSE data. Reipurth et al. (2012) obtained [Fe II] and H2 wide-field images with the Gemini NIRI camera and a wider FOV (120″ × 120″) than that of MUSE; however, they did not see any typical jet-like features near V900 Mon. We offer two scenarios for this non-detection. Either (a) the knot does not emit at those wavelengths, or (b) its surface brightness was too low to be detected. For the first case, the knot’s density might not be high enough, since [Fe II] traces denser gas (ne ~ 104 cm−3). For the latter case, a higher-sensitivity and higher-spectral resolution near-IR spectrum (e.g., ERIS/VLT) of the knot is required to answer these questions. Conversely, none of the SpeX/IRTF spectra covered that region.
Coincidentally the knot is aligned with one of the globules seen in the white light and Hα MUSE images (Figs. 5 and C.1) at a PA of 250° (±5°) east of north from the stellar position. This is nearly perpendicular to the PA of the disk’s major axis (see also Table 1 and Fig. 12). However, the globule might be a localized enhancement of scattered light emission in the nebula unrelated to the ELK. Takami et al. (2019) shows that the CO (2-1) gas emission indicates two wide cavities, where the blueshifted one has an opening angle of 70°. The angular resolution of those maps is superior to that of MUSE, while the FOV is also smaller (12″ against 1′). Figure 7 shows that the knot detected by MUSE is aligned to the CO (2-1) emission from Takami et al. (2019).
We searched for any additional knots that may have been produced by the last eruption 30 yr ago. Assuming that such a knot has an average velocity of 25 km s−1 – similar to the knot discovered by MUSE – it would have moved by about 0.13″. That distance is smaller than a single MUSE WFM spaxel and as such very close to the eruptive star. Therefore, these MUSE data are inconclusive, but future observations in the Narrow Field Mode of MUSE could potentially shed more light on the matter.
There are other examples of FUors with jet-like emission associated with distant knots. Andreasyan (2021) suggest that V565 Mon is another eruptive star associated with Herbig-Haro globules that were first identified near its reflection nebula, Parsamian 17 (Magakian et al. 2008), and these are also identifiable in the Pan-STARRS1 gri images. Its stellar spectrum is similar to V900 Mon. However, V900 Mon does not appear to have globules that far from the star based on the VPHAS+ and Pan-STARRS1 pseudo-color maps, but that could be due to low S/N in those surveys. Perhaps the most prominent example is Z CMa, a binary system composed of two young eruptive stars, the southeast of which is an FUor. This FUor launched a microjet with an average velocity of ~200 km s−1 seen in the NIR [Fe II] 1.64 μm (Whelan et al. 2010), that itself is aligned with [S II] emitting knots located about 60″ from the star (Poetzel et al. 1989), alluding to earlier eruptions from that system.
Based on the kinematic age of the knot (Sect. 3.3), we can deduce at least one earlier eruption just over 1000 yr ago. The mechanism that created such a knot, which obviously cannot be easily attributed to a previous outburst, is unclear.
The [S II] emission implies shock excitation, and the co-alignment of the fast-moving gas (~100 km s−1) with a much slower (<20 km s−1, Takami et al. 2019) and wider molecular outflow suggests the presence of a jet inside said outflow. If indeed these components constitute jet-like emission, then this would imply that the jet was collimated by a magnetic field at the central engine, which is near the star and above the disk (cf. the review of Frank et al. 2014, and references therein). Although jets are more common at other stages of protostellar evolution, there are at least four examples of jets in FUors (Z CMa, V346 Nor, SVS 13A, and L1551 IRS5). Nevertheless, it is thought that FUors are not magnetically active during eruptions, since the magnetic field lines are suppressed by excess ram pressure from the material accreted from the disk onto the protostar (cf., Hartmann et al. 2016, and references therein). Our current observations cannot provide a concrete solution to this contradiction.
5 Conclusions
We reported on our recent observations of the eruptive star V900 Mon with MATISSE/VLTI and MUSE/VLT. The MATISSE L-band observations suggest a marginally resolved source with an angular size <3 mas at 3.5 μm, providing an upper limit of 2 au for the radius of the disk region emitting at this wavelength. The region of the passive dusty disk that emits in the N band is confined within a radius <20 au from the star. Geometric model fits to the MATISSE N-band data corroborate the disk’s pole-on geometry previously found by ALMA.
The interferometric observations with MATISSE, which are supported by archival MIDI data, revealed the radial variation of the 10 μm silicate feature. Similar to earlier works, we could not find signatures of crystalline silicates in the disk. The silicate feature is clearly seen in emission at large spatial scales (disk radius ≥10 au) with a trapezoidal profile indicative of amorphous, large-sized dust grains (a ≥ 1 μm). The shape of the silicate feature’s spectral profile changes toward the inner regions of the disk, and diminishes below 10.5 μm at spatial scales ≤5 au. Our analysis of this spectral signature suggests that the innermost region of the disk is shielded by higher extinction, possibly by an accumulation of small dust grains (size ≤0.1 μm) that may be located near or covering a portion of the inner disk. Taking this into account, the small grains may be located at or near the origin of the collimated CO outflow found by ALMA.
Furthermore, we report the discovery of an ELK from our MUSE observations. Its size is approximately 1.30″ × 0.98″. This knot is co-aligned with the collimated CO outflow previously found by ALMA (PA = 250 ± 5 deg, east of north), and its projected separation from the star is approximately 27 000 au or 0.13 pc. The most prominent lines are Hα, [N II] at 6584 Å, and the [S II] 6716/30 Å doublet. There is a tentative detection of [O I] at 6300 Å , but it appears heavily blended with terrestrial emission. All the emission lines are blueshifted with respect to the rest wavelengths, with an average velocity of 100 km s−1. The knot’s kinematic age is approximately 5150 yr. Although this is an upper limit, it alludes to an earlier eruption of V900 Mon than its one 30 yr ago. The presence of [O I] and [S II] emission suggests that the knot is shock-excited, indicating that the FUor drives a jet. However, no jet-tracing emission lines were detected in the vicinity of the star, suggesting that no such activity occurred during or immediately before the eruption 30 yr ago. If the knot were shock-excited from a mechanism originating in V900 Mon’s disk, and since the disk itself is seen nearly pole-on, then the dusty “shield” found by MATISSE ought to be off-centered from the star.
V900 Mon is still in eruption and is therefore an active laboratory for the exploration of FUor evolution. All of the above suggest that further investigation of this eruptive star is necessary to assess the mechanism that shields the inner parts of its accretion disk and what mechanism launched the knot more than a millennium ago. For the former, we suggest future observations of scattered light imaging with SPHERE/VLT, and interfero-metric imaging of the CO and hydrogen gases in the accretion disk with GRAVITY/VLTI. At the moment the MUSE WFM observations cannot disentangle minute kinematics and proper motion within the knot; however, a study of the knot at higher spatial and spectral resolutions is possible with the MUSE NFM mode and/or X-Shooter/VLT in the visual, as well as the IFU of ERIS/VLT in the NIR.
Acknowledgements
This project received funding from the Hungarian NKFIH OTKA project no. K-132406, and from the European Research Council (ERC) under the European Union’s Horizon 2020 research and innovation programme under grant agreement No 716155 (SACCRED). FCSM received financial support from the European Research Council (ERC) under the European Union’s Horizon 2020 research and innovation programme (ERC Starting Grant “Chemtrip”, grant agreement No 949278). This work is supported at The Aerospace Corporation by the Independent Research and Development Program. M.S and M.P. were supported by NASA grant NNX16AJ75G. J.V. is supported by NOVA, the Netherlands Research School for Astronomy. S.K. acknowledges support from ERC Consolidator Grant “GAIA-BIFROST” (Grant Agreement ID 101003096) and STFC Consolidated Grant (ST/V000721/1). MATISSE was designed, funded and built in close collaboration with ESO, by a consortium composed of institutes in France (J.-L. Lagrange Laboratory – INSU-CNRS – Côte d’Azur Observatory – University of Côte d’Azur), Germany (MPIA, MPIfR and University of Kiel), the Netherlands (NOVA and University of Leiden), and Austria (University of Vienna). The Konkoly Observatory and Cologne University have also provided some support in the manufacture of the instrument. This research has made use of the services of the ESO Science Archive Facility.
Appendix A Tables
VLTI observing log.
In this appendix we present the VLTI observing logs for the MATISSE and the archival MIDI data (Table A.1) and for our optical and infrared observations (Table A.2). The evolution of V900 Mon over the last 30 years was shown in Sect. 3.1. Our NIR photometry is presented in Table A.3.
Observing log for the optical and infrared photometry and spectroscopy from Section 2.
Near-infrared photometry
Appendix B Figures
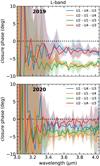 |
Fig. B.1 MATISSE closure phases in the L band for both epochs. The 2019 data were affected by atmospheric variations during the observing run. |
Supplementary MATISSE closure phases are shown in Figures B.1 and B.2 for both epochs. The 2019 data were affected by atmospheric variations during the observing run, while the uncertainties are predominantly in excess of 1 degree. It is also worth mentioning that in the current MATISSE pipeline the N-band closure phases are flipped by π compared to the L-band ones due to a sign convention error (see also Gámez Rosas et al. 2022). Although this does not affect the current work, since the N-band closure phases are not utilized, we have corrected for this flip here.
Figure B.3 shows the color-magnitude diagrams (cf. Sect. 3.1) in V versus V – R,V versus V – I, and R versus R – I (from top to bottom panels, respectively) based on the original data of Semkov et al. (2021).
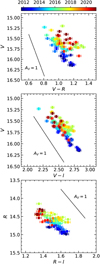 |
Fig. B.3 Color-magnitude diagrams based on the photometry of Semkov et al. (2021). The extinction vectors indicate AV = 1 mag based on Cardelli et al. (1989, RV = 3.1). |
Appendix C The reflection nebula
The reflection nebula of V900 Mon was first pointed out in 2009 by an amateur astronomer Thommes et al. (2011). Reipurth et al. (2012) indicated that emission from the nebula was barely visible in the R band in the first known photographic plate from the Palomar Sky Survey in 1953. Neither the nebula nor any nearby sources within 30″ were detected in the digitized15 plates from the Heidelberg galactic survey (1899-1990) and from the Bamberg Southern Sky Patrol (1955-1974). Semkov et al. (2021) re-analyzed the digitized archival plates of the POSS and UKST surveys and found that the nebula was fainter in the R band on January 8, 1989, however the photographic emulsions and filters differed between the two epochs.
A careful examination of the later SuperCosmos Hα Survey (SHS; Parker et al. 2005) indicates that the reflection nebula was already visible a decade earlier, in 1999 (short red, sr, filter) and 2002 (Hα filter). This would suggest that the eruption occurred sometime after 1990, since earlier data (as above) show a rather compact source at the location of the current nebula. We therefore presume that V900 Mon has been slowly erupting over the last 30 years.
In Figure C.1 we attempt to show individual features within the nebula. The bulk of the reflection nebula extends to the west of V900 Mon and to the southwest. Some individual features can be discerned within the nebula, depending on the intensity stretch applied to the image. Here, we have opted for an  stretch in both images and have adapted the color palette for clarity: the left panel is a reproduction of Fig. 5, while the right panel is the same image in black and white.
We indicatively show the extent of the CO biconical outflow (dotted blue lines) detected by ALMA (Takami et al. 2019). The location of the star is clearly marked, as is the ellipsoidal extension northwest of the star (cyan), and the ELK (green). There appears to be a gap in the lower left corner of the nebula (gray, dotted). This has also been noted in Pan-STARRS1 and VPHAS+ broadband images. Within the main bulk of the nebula we can identify six segments (red). Segments 1 and 6 delineate the southern and part of the northern extension of the nebula, while segments 2 to 5 mark features extending outward from the circumstellar region. Segments 4 and 5 appear to terminate at two globules to the west of the star. A loop-like feature is seen in the upper right section of the nebula. The nebula extends further westward like a palmate (i.e., a duck’s foot) within the MUSE FOV.
It is unclear from the current MUSE data if individual features expand outward from the circumstellar region. The features could simply be a projection effect within or near the biconical outflow. There are no discerning features in individual spectral channels, with the exception of the ELK, while a comparison to broadband imaging from the last decade by Pan-STARRS1 and VPHAS+ surveys does not indicate any changes within the nebula. Therefore, we assume that said features have been carved by some earlier mechanism acting in the nebula.
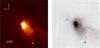 |
Fig. C.1 Individual features within V900 Mon’s reflection nebula seen with MUSE/VLT. The left panel is a reproduction of Fig. 5 to allow direct comparison with the drawing of the individual nebular features in the right panel. For a description of the features refer to Sect. C. |
References
- Ábrahám, P., Juhász, A., Dullemond, C. P., et al. 2009, Nature, 459, 224 [Google Scholar]
- Andreasyan, H. 2021, Res. Astron. Astrophys., 21, 064 [CrossRef] [Google Scholar]
- Antoniucci, S., Podio, L., Nisini, B., et al. 2016, A&A, 593, L13 [NASA ADS] [CrossRef] [EDP Sciences] [Google Scholar]
- Audard, M., Ábraham, P., Dunham, M. M., et al. 2014, in Protostars and Planets VI, 387 [Google Scholar]
- Bacon, R., Accardo, M., Adjali, L., et al. 2010, SPIE Conf. Ser., 7735, 773508 [Google Scholar]
- Bailer-Jones, C. A. L., Rybizki, J., Fouesneau, M., Demleitner, M., & Andrae, R. 2021, AJ, 161, 147 [Google Scholar]
- Bonnell, I., & Bastien, P. 1992, ApJ, 401, L31 [Google Scholar]
- Bourgés, L., Lafrasse, S., Mella, G., et al. 2014, ASP Conf. Ser., 485, 223 [NASA ADS] [Google Scholar]
- Bouwman, J., de Koter, A., Dominik, C., & Waters, L. B. F. M. 2003, A&A, 401, 577 [NASA ADS] [CrossRef] [EDP Sciences] [Google Scholar]
- Canovas, H., Perez, S., Dougados, C., et al. 2015, A&A, 578, L1 [NASA ADS] [CrossRef] [EDP Sciences] [Google Scholar]
- Cardelli, J. A., Clayton, G. C., & Mathis, J. S. 1989, ApJ, 345, 245 [Google Scholar]
- Carvalho, A. S., & Hillenbrand, L. A. 2022, ApJ, 940, 156 [NASA ADS] [CrossRef] [Google Scholar]
- Chambers, K. C., Magnier, E. A., Metcalfe, N., et al. 2016, ArXiv e-prints [arXiv:1612.05560] [Google Scholar]
- Chesneau, O. 2007, New Astron. Rev., 51, 666 [CrossRef] [Google Scholar]
- Connelley, M. S., & Reipurth, B. 2018, ApJ, 861, 145 [NASA ADS] [CrossRef] [Google Scholar]
- Cushing, M. C., Vacca, W. D., & Rayner, J. T. 2004, PASP, 116, 362 [NASA ADS] [CrossRef] [Google Scholar]
- Cutri, R. M., Skrutskie, M. F., van Dyk, S., et al. 2003, VizieR Online Data Catalog: II/246 [Google Scholar]
- Dong, R., Liu, H. B., Cuello, N., et al. 2022, Nat. Astron., 6, 331 [NASA ADS] [CrossRef] [Google Scholar]
- Drew, J. E., Gonzalez-Solares, E., Greimel, R., et al. 2014, MNRAS, 440, 2036 [Google Scholar]
- Dullemond, C. P., & Monnier, J. D. 2010, ARA&A, 48, 205 [NASA ADS] [CrossRef] [Google Scholar]
- Ellerbroek, L. E., Podio, L., Dougados, C., et al. 2014, A&A, 563, A87 [NASA ADS] [CrossRef] [EDP Sciences] [Google Scholar]
- Fischer, W. J., Hillenbrand, L. A., Herczeg, G. J., et al. 2023, ASP Conf. Ser., 534, 355 [NASA ADS] [Google Scholar]
- Frank, A., Ray, T. P., Cabrit, S., et al. 2014, in Protostars and Planets VI, 451 [Google Scholar]
- Gallenne, A., Mérand, A., Kervella, P., et al. 2015, A&A, 579, A68 [NASA ADS] [CrossRef] [EDP Sciences] [Google Scholar]
- Gámez Rosas, V., Isbell, J. W., Jaffe, W., et al. 2022, Nature, 602, 403 [CrossRef] [Google Scholar]
- Gordon, K. D., Misselt, K. A., Bouwman, J., et al. 2021, ApJ, 916, 33 [NASA ADS] [CrossRef] [Google Scholar]
- Hackwell, J. A., Warren, D. W., Chatelain, M. A., et al. 1990, SPIE Conf. Ser., 1235, 171 [NASA ADS] [Google Scholar]
- Hales, A. S., Pérez, S., Gonzalez-Ruilova, C., et al. 2020, ApJ, 900, 7 [NASA ADS] [CrossRef] [Google Scholar]
- Hartmann, L. 1998, Accretion Processes in Star Formation (Cambridge: Cambridge University Press) [Google Scholar]
- Hartmann, L., & Kenyon, S. J. 1985, ApJ, 299, 462 [CrossRef] [Google Scholar]
- Hartmann, L., & Kenyon, S. J. 1996, ARA&A, 34, 207 [NASA ADS] [CrossRef] [Google Scholar]
- Hartmann, L., Herczeg, G., & Calvet, N. 2016, ARA&A, 54, 135 [Google Scholar]
- Herbig, G. H. 1966, Vistas Astron., 8, 109 [Google Scholar]
- Herbig, G. H. 1977, ApJ, 217, 693 [NASA ADS] [CrossRef] [Google Scholar]
- Kemper, F., Vriend, W. J., & Tielens, A. G. G. M. 2004, ApJ, 609, 826 [Google Scholar]
- Kóspál, Á., Ábrahám, P., Carmona, A., et al. 2020a, ApJ, 895, L48 [CrossRef] [Google Scholar]
- Kóspál, Á., Szabó, Z. M., Ábrahám, P., et al. 2020b, ApJ, 889, 148 [CrossRef] [Google Scholar]
- Kóspál, Á., Cruz-Sáenz de Miera, F., White, J. A., et al. 2021, ApJS, 256, 30 [CrossRef] [Google Scholar]
- Lawrence, A., Warren, S. J., Almaini, O., et al. 2007, MNRAS, 379, 1599 [Google Scholar]
- Leinert, C., Graser, U., Przygodda, F., et al. 2003, Ap&SS, 286, 73 [NASA ADS] [CrossRef] [Google Scholar]
- Liu, H. B., Tsai, A.-L., Chen, W. P., et al. 2021, ApJ, 923, 270 [NASA ADS] [CrossRef] [Google Scholar]
- Lopez, B., Lagarde, S., Jaffe, W., et al. 2014, The Messenger, 157, 5 [NASA ADS] [Google Scholar]
- Lopez, B., Lagarde, S., Petrov, R. G., et al. 2022, A&A, 659, A192 [NASA ADS] [CrossRef] [EDP Sciences] [Google Scholar]
- Luridiana, V., Morisset, C., & Shaw, R. A. 2015, A&A, 573, A42 [NASA ADS] [CrossRef] [EDP Sciences] [Google Scholar]
- Lykou, F., Ábrahám, P., Chen, L., et al. 2022, A&A, 663, A86 [NASA ADS] [CrossRef] [EDP Sciences] [Google Scholar]
- Magakian, T. Y., Movsessian, T. A., & Nikogossian, E. G. 2008, Astrophysics, 51, 7 [NASA ADS] [CrossRef] [Google Scholar]
- Mainzer, A., Bauer, J., Cutri, R. M., et al. 2014, ApJ, 792, 30 [Google Scholar]
- Mérand, A. 2022, SPIE Conf. Ser., 12183, 121831N [Google Scholar]
- Müller, A., Pott, J. U., Mérand, A., et al. 2014, A&A, 567, A98 [NASA ADS] [CrossRef] [EDP Sciences] [Google Scholar]
- Olofsson, J., Augereau, J. C., van Dishoeck, E. F., et al. 2009, A&A, 507, 327 [NASA ADS] [CrossRef] [EDP Sciences] [Google Scholar]
- Osterbrock, D. E., & Ferland, G. J. 2006, Astrophysics of Gaseous Nebulae and Active Galactic Nuclei (USA: University Science Book) [Google Scholar]
- Parker, Q. A., Phillipps, S., Pierce, M. J., et al. 2005, MNRAS, 362, 689 [NASA ADS] [CrossRef] [Google Scholar]
- Pérez, S., Hales, A., Liu, H. B., et al. 2020, ApJ, 889, 59 [CrossRef] [Google Scholar]
- Pikhartova, M., Long, Z. C., Assani, K. D., et al. 2021, ApJ, 919, 64 [NASA ADS] [CrossRef] [Google Scholar]
- Poetzel, R., Mundt, R., & Ray, T. P. 1989, A&A, 224, L13 [NASA ADS] [Google Scholar]
- Quanz, S. P., Henning, T., Bouwman, J., Ratzka, T., & Leinert, C. 2006, ApJ, 648, 472 [NASA ADS] [CrossRef] [Google Scholar]
- Quanz, S. P., Henning, T., Bouwman, J., et al. 2007, ApJ, 668, 359 [NASA ADS] [CrossRef] [Google Scholar]
- Rayner, J. T., Toomey, D. W., Onaka, P. M., et al. 2003, PASP, 115, 362 [NASA ADS] [CrossRef] [Google Scholar]
- Reipurth, B., Aspin, C., & Herbig, G. H. 2012, ApJ, 748, L5 [CrossRef] [Google Scholar]
- Samus, N., & Kazarovets, E. 2011, Central Bureau Electronic Telegrams, 2795, 2 [NASA ADS] [Google Scholar]
- Schlafly, E. F., & Finkbeiner, D. P. 2011, ApJ, 737, 103 [Google Scholar]
- Semkov, E. H., Peneva, S. P., & Ibryamov, S. I. 2021, Serb. Astron. J., 202, 31 [NASA ADS] [CrossRef] [Google Scholar]
- Takami, M., Chen, T.-S., Liu, H. B., et al. 2019, ApJ, 884, 146 [NASA ADS] [CrossRef] [Google Scholar]
- Thommes, J., Reipurth, B., Aspin, C., & Herbig, G. H. 2011, Central Bureau Electronic Telegrams, 2795, 1 [NASA ADS] [Google Scholar]
- Vacca, W. D., Cushing, M. C., & Rayner, J. T. 2003, PASP, 115, 389 [NASA ADS] [CrossRef] [Google Scholar]
- van Boekel, R., Waters, L. B. F. M., Dominik, C., et al. 2003, A&A, 400, L21 [NASA ADS] [CrossRef] [EDP Sciences] [Google Scholar]
- van Boekel, R., Min, M., Waters, L. B. F. M., et al. 2005, A&A, 437, 189 [NASA ADS] [CrossRef] [EDP Sciences] [Google Scholar]
- Varga, J., Ábraham, P., Chen, L., et al. 2018, A&A, 617, A83 [NASA ADS] [CrossRef] [EDP Sciences] [Google Scholar]
- Varga, J., Hogerheijde, M., van Boekel, R., et al. 2021, A&A, 647, A56 [NASA ADS] [CrossRef] [EDP Sciences] [Google Scholar]
- Varricatt, W. P., Kerr, T. H., Carroll, T., & Moore, E. 2015, ATel, 8174, 1 [NASA ADS] [Google Scholar]
- Weilbacher, P. M., Palsa, R., Streicher, O., et al. 2020, A&A, 641, A28 [NASA ADS] [CrossRef] [EDP Sciences] [Google Scholar]
- Whelan, E. T., Dougados, C., Perrin, M. D., et al. 2010, ApJ, 720, L119 [Google Scholar]
- Woitke, P., Min, M., Pinte, C., et al. 2016, A&A, 586, A103 [NASA ADS] [CrossRef] [EDP Sciences] [Google Scholar]
- Wright, E. L., Eisenhardt, P. R. M., Mainzer, A. K., et al. 2010, AJ, 140, 1868 [Google Scholar]
- Zerbi, F. M., Chincarini, G., Ghisellini, G., et al. 2004, SPIE Conf. Ser., 5492, 1590 [NASA ADS] [Google Scholar]
Based on Gaussian fit estimates. The authors also mention visibility-fit estimates at slightly higher values,  and
and  degrees, which are in agreement.
The N-band visibilities were not calibrated due to the low quality of the obtained photometry. In this paper we only show the N-band correlated fluxes.
This may be alleviated from future measurements of the hot inner disk’s size at shorter wavelengths (i.e., ≤ 2 μm).
Although the fitting was performed ‘by eye’ and no optimization was made, it was found to be sufficient in matching the average levels.
Value derived with the <mono>OpacityTool</mono> (cf. Woitke et al. 2016, and references therein).
A slightly higher inclination at 30° would reduce this mass estimate by about 14%.
See for example the deep-exposure images by amateur astronomer Adam Block, https://skycenter.arizona.edu/astrophotography/lbn1022
Data for this regions are not yet available from the DASCH project.
All Tables
Disk sizes (FWHM) at 1.3 mm continuum from the literature compared with MATISSE N-band results.
Observing log for the optical and infrared photometry and spectroscopy from Section 2.
All Figures
|
Fig. 1 Evolution of V900 Mon. For a description of the data, see the main text in Sects. 2.4 and 3.1. |
| In the text | |
|
Fig. 2 Spectral energy distribution of V900 Mon from the optical to the far-infrared. The two absorption lines seen in the MUSE spectrum are the Hβ and Hα lines. The SED has not been corrected for extinction. |
| In the text | |
|
Fig. 3 Centro-symmetric model fits (ID Gaussian distributions) to the monochromatic squared visibilities at 3.5 μm (top panel), and to the monochromatic correlated fluxes at 10.7 μm (bottom panel). |
| In the text | |
|
Fig. 4 MATISSE and MIDI correlated fluxes. Top panel: each MATISSE correlated spectrum is color-coded by the individual baseline; in the legend, we specify the length and PA of each one. The apparent decrease in flux levels with increasing baseline length from top to bottom is indicative of a radial variation in the emitting region. Also shown here are the MIDI spectra (dashed black and gray lines) that follow a similar pattern. Bottom panel: the MATISSE correlated fluxes are plotted vs. spatial frequency and they are color-coded with respect to wavelength (as indicated in the color bar). The MIDI data are shown for reference (black and gray lines). |
| In the text | |
|
Fig. 5 White image of V900 Mon and Thommes’ nebula from MUSE (4700–9300 Å). The cross sign marks the location of the star and the drawn green line marks the bulk of the emitting region that includes the ellipsoidal component (Sect. 3.3.2). The FOV is 1′ × 1′. The image has been stretched at arbitrary levels of the square root of intensity to enhance the nebula's features. |
| In the text | |
|
Fig. 6 MUSE spectra of V900 Mon (star+disk; blue) and the ELK (orange). Prominent lines in the V900 Mon spectrum, like hydrogen Balmer lines and the Ca II triplet, are seen in absorption. In the knot spectrum, the Hα, [N II], and [S II] lines are clearly seen in emission, while the [O I] line suffers from terrestrial contamination (e.g., airglow O I). Both spectra are affected by skyline contamination at the blue and red ends. The spectra have not been corrected for extinction. Normalized line profiles vs. radial velocities (corrected for systemic velocity) are shown in the bottom panels. |
| In the text | |
|
Fig. 7 Continuum-subtracted Hα linemap of V900 Mon and Thommes’ nebula. The map has been linearly scaled to enhance the emission features (in white) and designate the scattered light continuum from the nebula and background sources (shaded black regions). The green contours (arbitrary levels) mark the CO (2–1) moment-zero map similar to Takami et al. (2019), showing the blueshifted emission component to the west and part of the redshifted wide-angle lobe to the east. The ELK is clearly visible and co-aligned with the blueshifted CO outflow, as indicated by the guiding arrow (PA ~ 250° east of north). The FOV is 50″ × 50″. |
| In the text | |
|
Fig. 8 Accretion disk model against the 2019–2021 photometry of V900 Mon from MUSE, SMARTS, and NEOWISE. |
| In the text | |
|
Fig. 9 MATISSE and MIDI normalized continuum-subtracted correlated spectra per baseline. From top-left and clockwise the spectra are plotted from the longest baseline to the shortest, while an offset has been applied for clarity. The MATISSE 2019 data are drawn in darker shades of color compared to the respective 2020 data, which are shown in lighter shades. The MIDI data are shown as black and gray lines. The uncertainties of the normalized correlated fluxes are shown for comparison as shaded regions. |
| In the text | |
|
Fig. 10 MATISSE normalized and averaged spectra (both epochs) of Fig. 9 per different baselines as indicated in the legend. From top to bottom, the three spectra (blue, orange, and green) correspond to different regions of the protoplanetary disk within radii of 16, 12, and 7 au, respectively. An offset has been applied for clarity. Overplotted for comparison are the MIDI normalized spectra (gray; dashed), the profile of ISM silicates (red line, Kemper et al. 2004), and the normalized spectrum of comet Hale-Bopp (brown line). The two dotted vertical lines act as simple guides for the eye at 10 and 11.3 μm. |
| In the text | |
|
Fig. 11 Averaged and normalized correlated spectra (blue) of the shortest baselines (cf. top panel in Fig. 10) reddened with the extinction law of Gordon et al. (2021) and AV = 0.5 and 3 mag in the top and bottom panels, respectively. The reddened spectra (red) are a good fit to the averaged-normalized spectra from the intermediate (orange; top panel) and longest baselines (green; bottom panel). |
| In the text | |
|
Fig. 12 Cartoon indicating the presumed geometry of the system. The drawing is not to scale. |
| In the text | |
|
Fig. B.1 MATISSE closure phases in the L band for both epochs. The 2019 data were affected by atmospheric variations during the observing run. |
| In the text | |
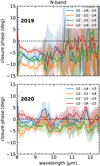 |
Fig. B.2 As in Fig. B.1 but for the N-band data. |
| In the text | |
|
Fig. B.3 Color-magnitude diagrams based on the photometry of Semkov et al. (2021). The extinction vectors indicate AV = 1 mag based on Cardelli et al. (1989, RV = 3.1). |
| In the text | |
|
Fig. C.1 Individual features within V900 Mon’s reflection nebula seen with MUSE/VLT. The left panel is a reproduction of Fig. 5 to allow direct comparison with the drawing of the individual nebular features in the right panel. For a description of the features refer to Sect. C. |
| In the text | |
Current usage metrics show cumulative count of Article Views (full-text article views including HTML views, PDF and ePub downloads, according to the available data) and Abstracts Views on Vision4Press platform.
Data correspond to usage on the plateform after 2015. The current usage metrics is available 48-96 hours after online publication and is updated daily on week days.
Initial download of the metrics may take a while.