Fig. 6
Download original image
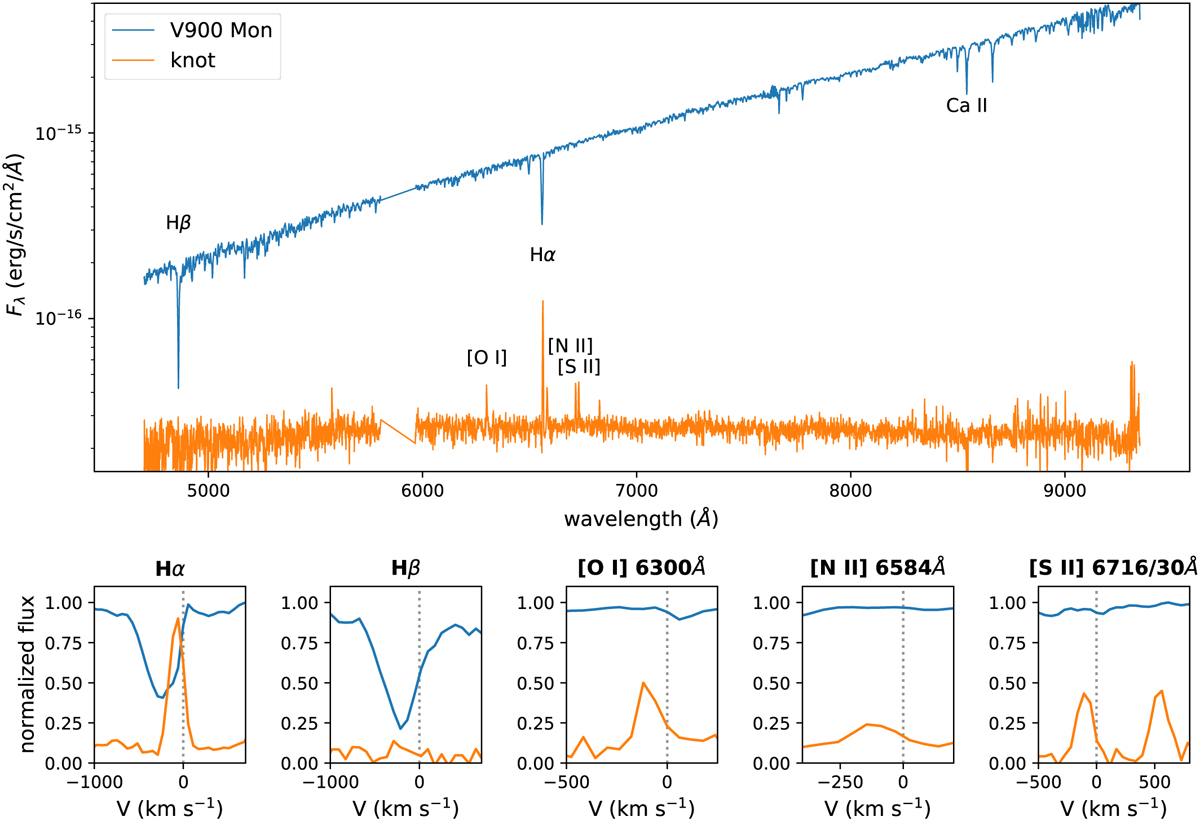
MUSE spectra of V900 Mon (star+disk; blue) and the ELK (orange). Prominent lines in the V900 Mon spectrum, like hydrogen Balmer lines and the Ca II triplet, are seen in absorption. In the knot spectrum, the Hα, [N II], and [S II] lines are clearly seen in emission, while the [O I] line suffers from terrestrial contamination (e.g., airglow O I). Both spectra are affected by skyline contamination at the blue and red ends. The spectra have not been corrected for extinction. Normalized line profiles vs. radial velocities (corrected for systemic velocity) are shown in the bottom panels.
Current usage metrics show cumulative count of Article Views (full-text article views including HTML views, PDF and ePub downloads, according to the available data) and Abstracts Views on Vision4Press platform.
Data correspond to usage on the plateform after 2015. The current usage metrics is available 48-96 hours after online publication and is updated daily on week days.
Initial download of the metrics may take a while.