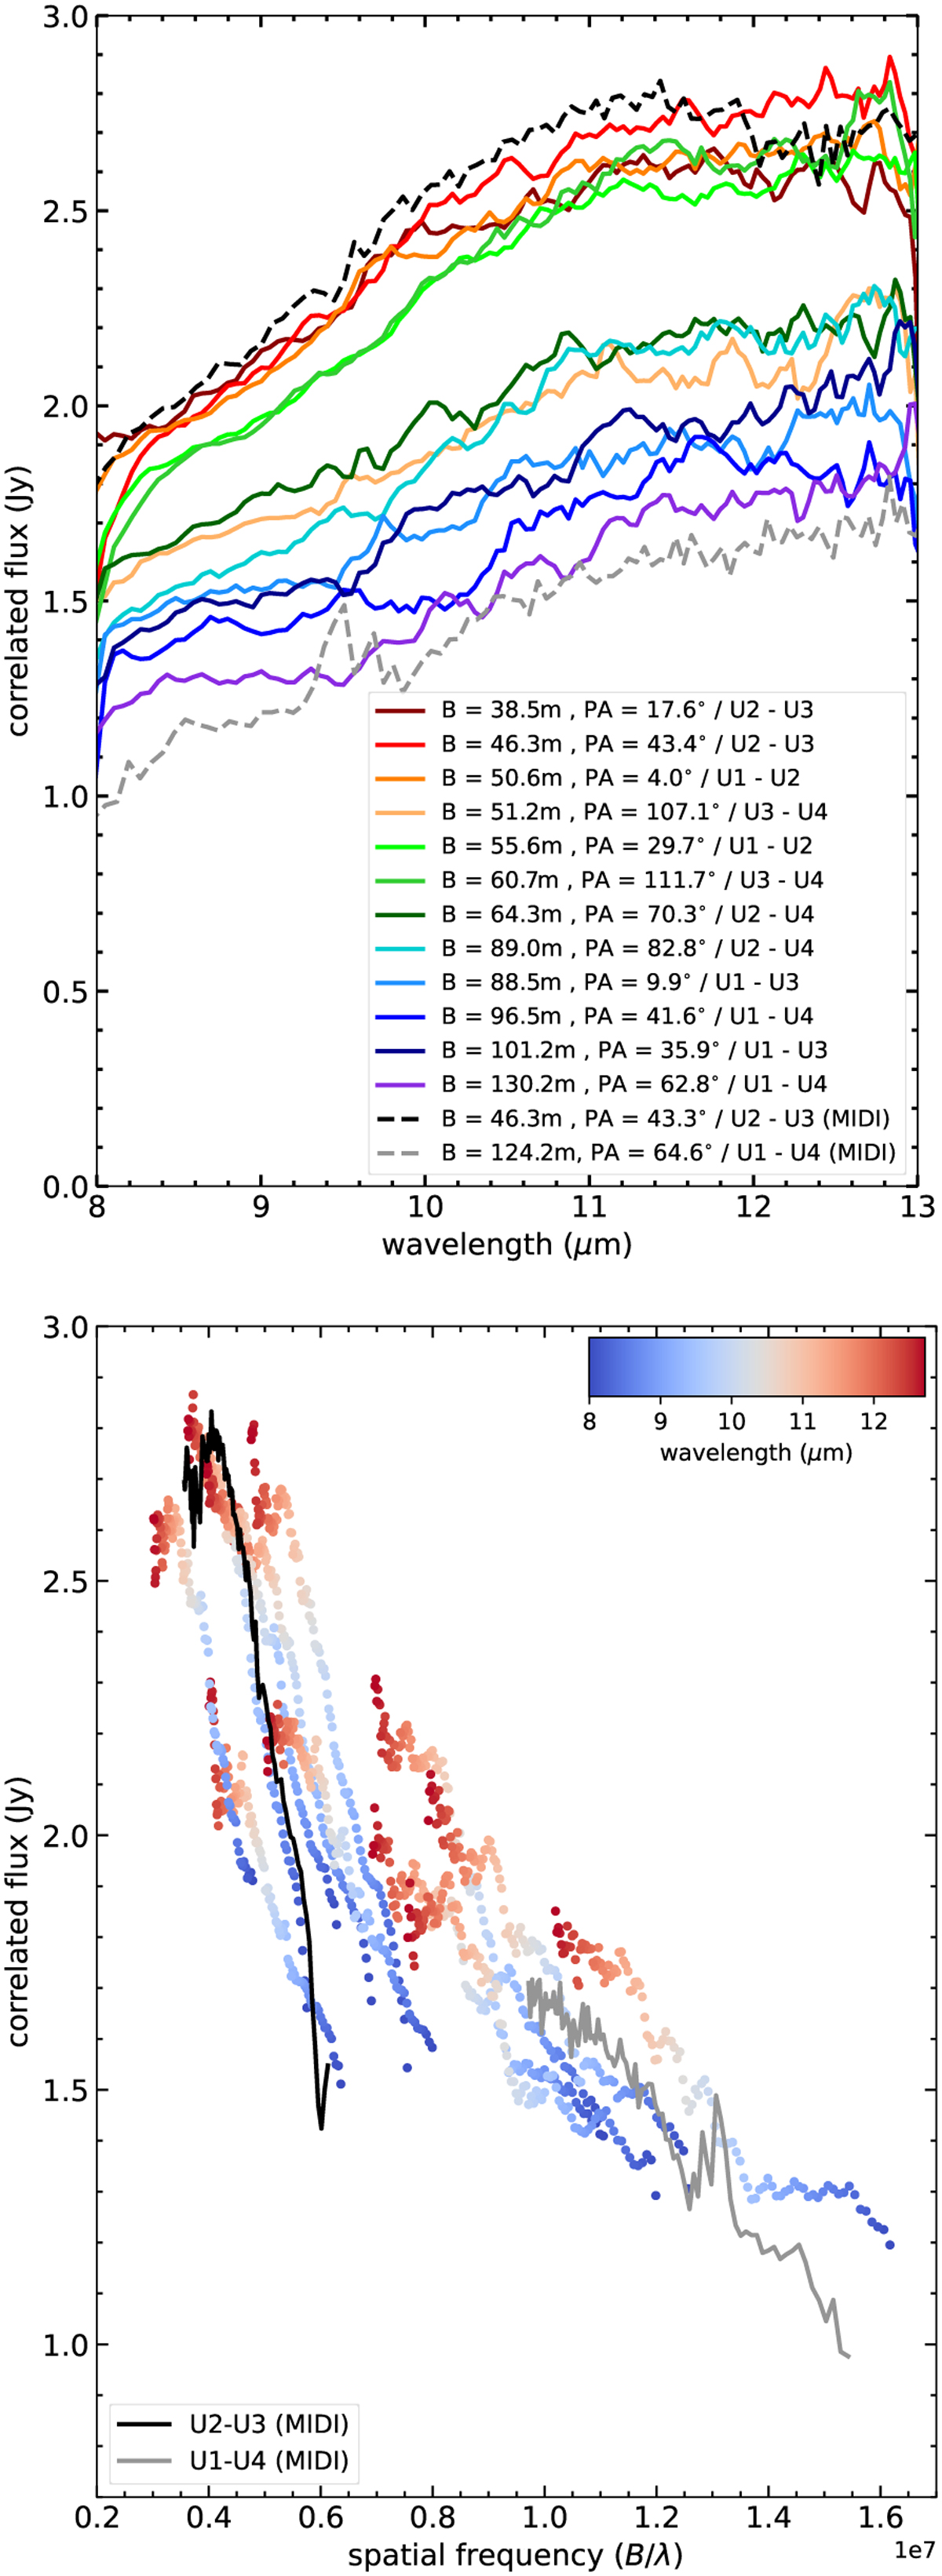
Fig. 4
Download original image
MATISSE and MIDI correlated fluxes. Top panel: each MATISSE correlated spectrum is color-coded by the individual baseline; in the legend, we specify the length and PA of each one. The apparent decrease in flux levels with increasing baseline length from top to bottom is indicative of a radial variation in the emitting region. Also shown here are the MIDI spectra (dashed black and gray lines) that follow a similar pattern. Bottom panel: the MATISSE correlated fluxes are plotted vs. spatial frequency and they are color-coded with respect to wavelength (as indicated in the color bar). The MIDI data are shown for reference (black and gray lines).
Current usage metrics show cumulative count of Article Views (full-text article views including HTML views, PDF and ePub downloads, according to the available data) and Abstracts Views on Vision4Press platform.
Data correspond to usage on the plateform after 2015. The current usage metrics is available 48-96 hours after online publication and is updated daily on week days.
Initial download of the metrics may take a while.