Fig. 7
Download original image
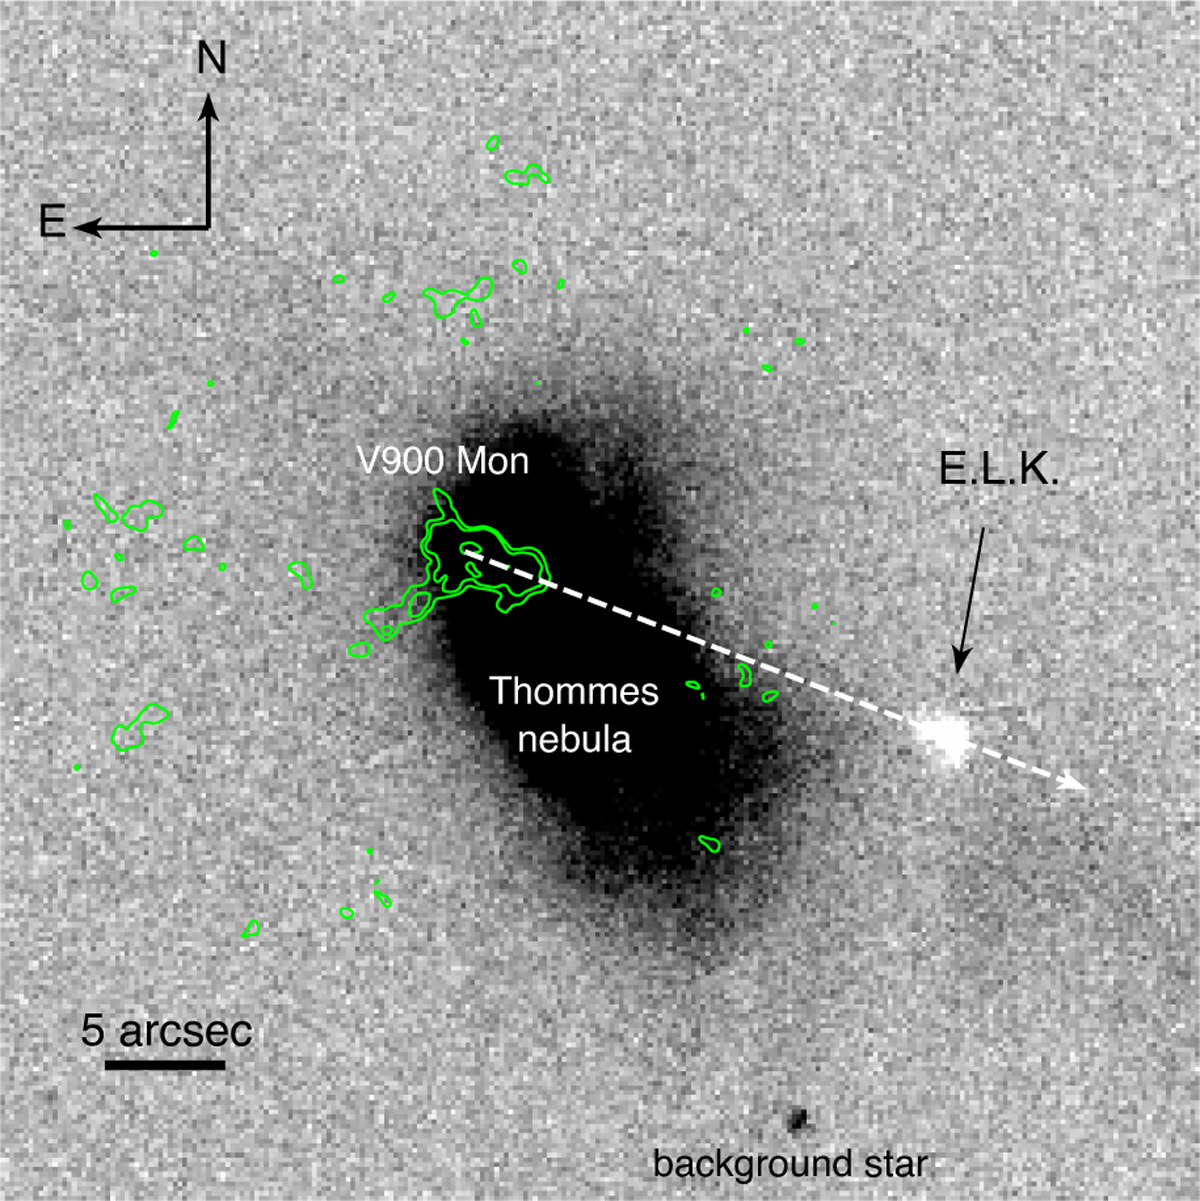
Continuum-subtracted Hα linemap of V900 Mon and Thommes’ nebula. The map has been linearly scaled to enhance the emission features (in white) and designate the scattered light continuum from the nebula and background sources (shaded black regions). The green contours (arbitrary levels) mark the CO (2–1) moment-zero map similar to Takami et al. (2019), showing the blueshifted emission component to the west and part of the redshifted wide-angle lobe to the east. The ELK is clearly visible and co-aligned with the blueshifted CO outflow, as indicated by the guiding arrow (PA ~ 250° east of north). The FOV is 50″ × 50″.
Current usage metrics show cumulative count of Article Views (full-text article views including HTML views, PDF and ePub downloads, according to the available data) and Abstracts Views on Vision4Press platform.
Data correspond to usage on the plateform after 2015. The current usage metrics is available 48-96 hours after online publication and is updated daily on week days.
Initial download of the metrics may take a while.