Fig. 10
Download original image
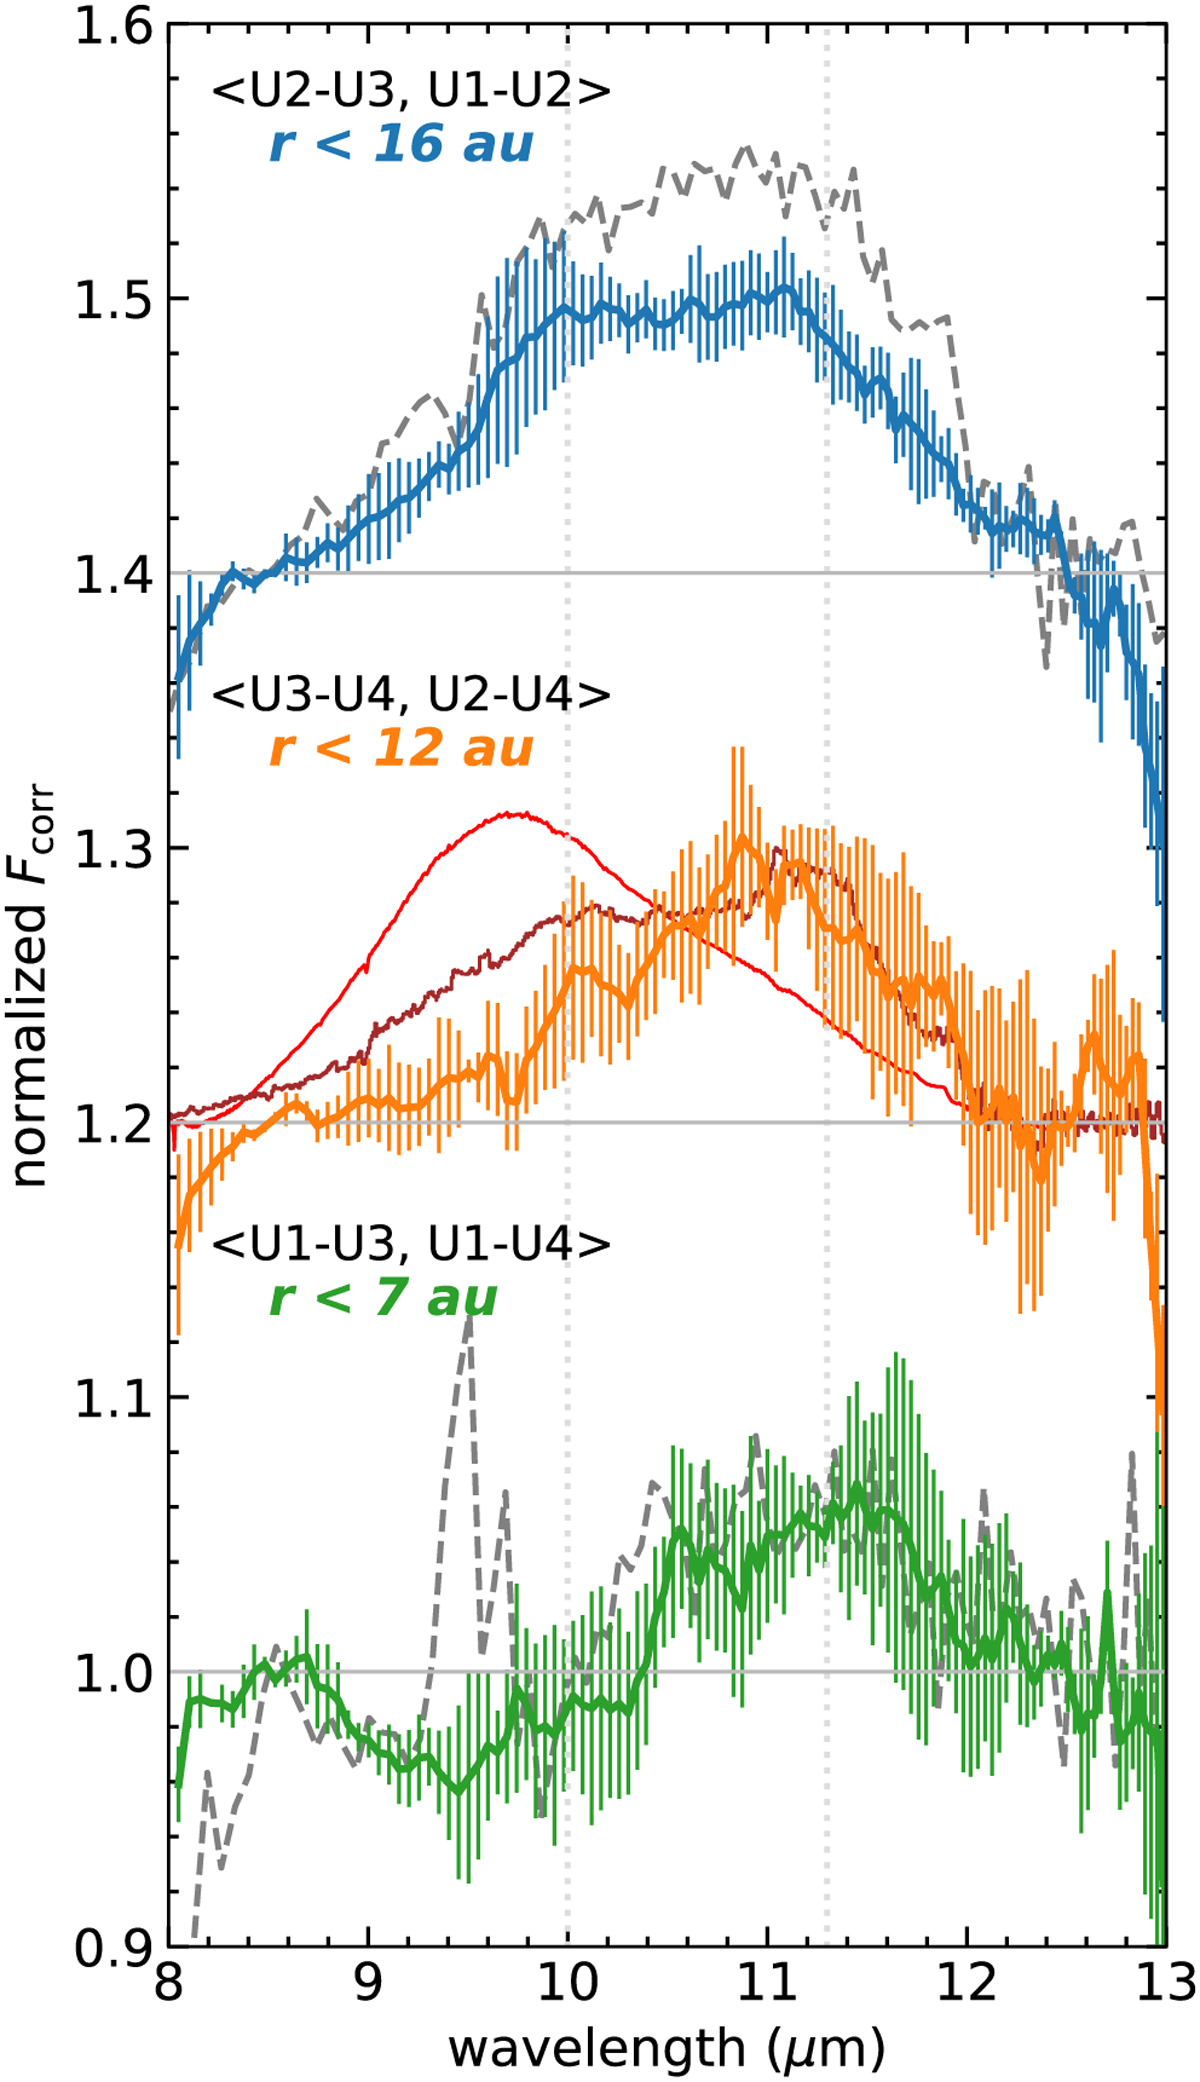
MATISSE normalized and averaged spectra (both epochs) of Fig. 9 per different baselines as indicated in the legend. From top to bottom, the three spectra (blue, orange, and green) correspond to different regions of the protoplanetary disk within radii of 16, 12, and 7 au, respectively. An offset has been applied for clarity. Overplotted for comparison are the MIDI normalized spectra (gray; dashed), the profile of ISM silicates (red line, Kemper et al. 2004), and the normalized spectrum of comet Hale-Bopp (brown line). The two dotted vertical lines act as simple guides for the eye at 10 and 11.3 μm.
Current usage metrics show cumulative count of Article Views (full-text article views including HTML views, PDF and ePub downloads, according to the available data) and Abstracts Views on Vision4Press platform.
Data correspond to usage on the plateform after 2015. The current usage metrics is available 48-96 hours after online publication and is updated daily on week days.
Initial download of the metrics may take a while.