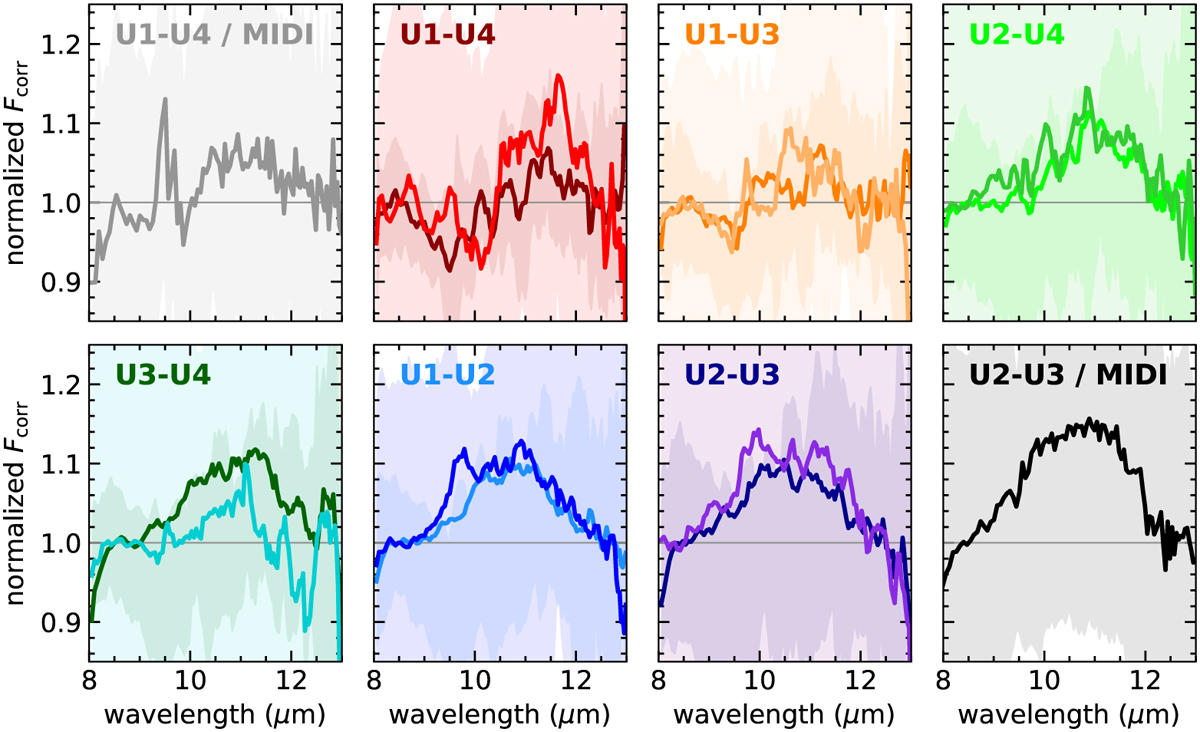
Fig. 9
Download original image
MATISSE and MIDI normalized continuum-subtracted correlated spectra per baseline. From top-left and clockwise the spectra are plotted from the longest baseline to the shortest, while an offset has been applied for clarity. The MATISSE 2019 data are drawn in darker shades of color compared to the respective 2020 data, which are shown in lighter shades. The MIDI data are shown as black and gray lines. The uncertainties of the normalized correlated fluxes are shown for comparison as shaded regions.
Current usage metrics show cumulative count of Article Views (full-text article views including HTML views, PDF and ePub downloads, according to the available data) and Abstracts Views on Vision4Press platform.
Data correspond to usage on the plateform after 2015. The current usage metrics is available 48-96 hours after online publication and is updated daily on week days.
Initial download of the metrics may take a while.