Fig. 11
Download original image
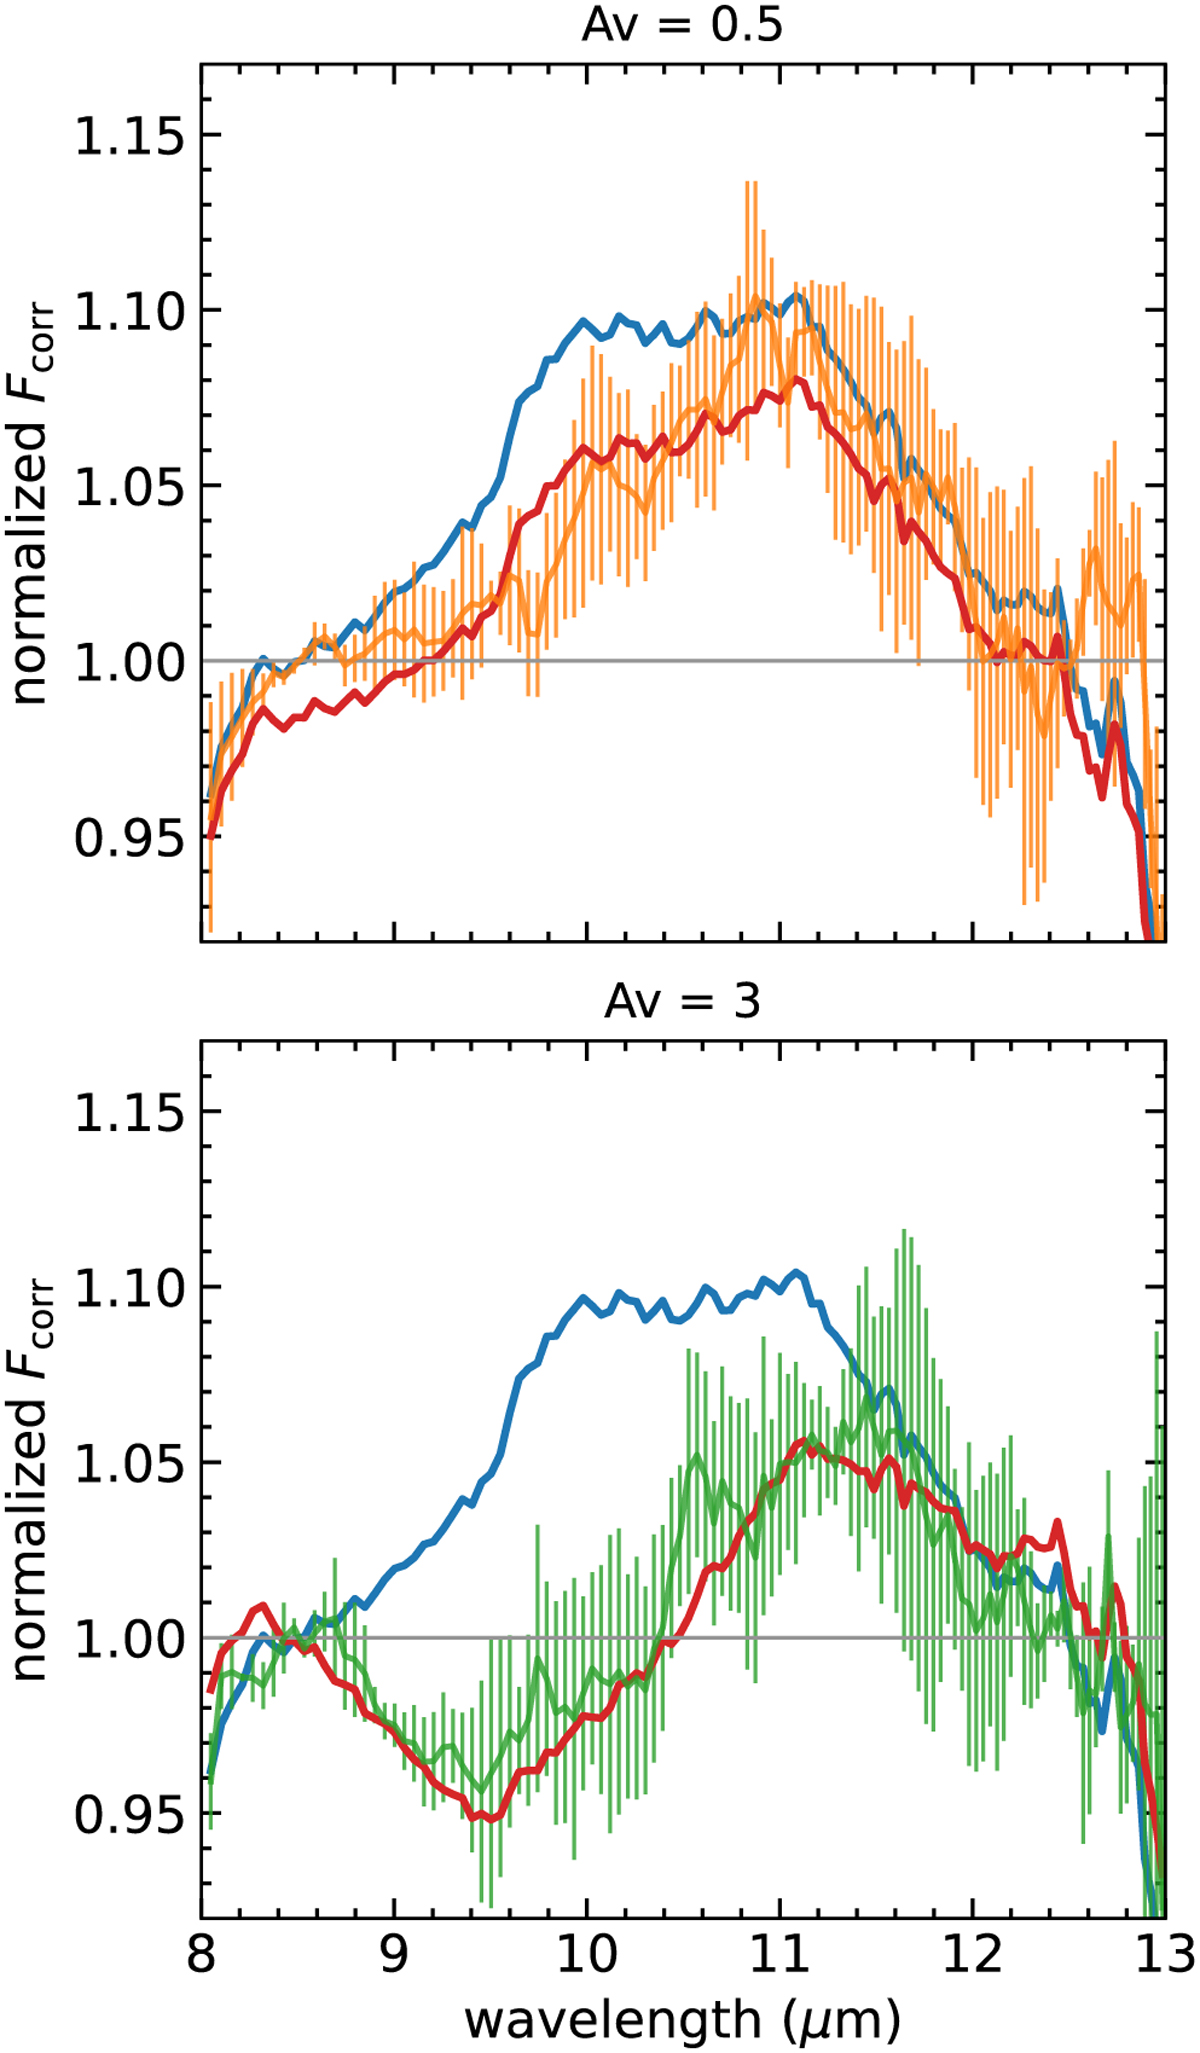
Averaged and normalized correlated spectra (blue) of the shortest baselines (cf. top panel in Fig. 10) reddened with the extinction law of Gordon et al. (2021) and AV = 0.5 and 3 mag in the top and bottom panels, respectively. The reddened spectra (red) are a good fit to the averaged-normalized spectra from the intermediate (orange; top panel) and longest baselines (green; bottom panel).
Current usage metrics show cumulative count of Article Views (full-text article views including HTML views, PDF and ePub downloads, according to the available data) and Abstracts Views on Vision4Press platform.
Data correspond to usage on the plateform after 2015. The current usage metrics is available 48-96 hours after online publication and is updated daily on week days.
Initial download of the metrics may take a while.