| Issue |
A&A
Volume 681, January 2024
|
|
|---|---|---|
| Article Number | A91 | |
| Number of page(s) | 19 | |
| Section | Cosmology (including clusters of galaxies) | |
| DOI | https://doi.org/10.1051/0004-6361/202347504 | |
| Published online | 22 January 2024 | |
Galaxy groups and clusters and their brightest galaxies within the cosmic web
1
Tartu Observatory, University of Tartu, Observatooriumi 1, 61602 Tõravere, Estonia
e-mail: This email address is being protected from spambots. You need JavaScript enabled to view it.
2
Estonian Academy of Sciences, Kohtu 6, 10130 Tallinn, Estonia
3
ICRANet, Piazza della Repubblica 10, 65122 Pescara, Italy
4
Tuorla Observatory, Department of Physics and Astronomy, University of Turku, Vesilinnantie 5, 20014 Turku, Finland
Received:
19
July
2023
Accepted:
9
October
2023
Abstract
Context. The evolution of galaxy groups and the brightest group galaxies (BGGs) is influenced by their location in the cosmic web.
Aims. Our aim is to combine data on galaxy groups, their BGGs, and their location in the cosmic web, to determine classes of groups and clusters, and to obtain a better understanding of their properties and evolution.
Methods. Data on groups and their BGGs are based on the Sloan Digital Sky Survey DR10 MAIN spectroscopic galaxy sample in the redshift range 0.009 ≤ z ≤ 0.200. We characterize the group environments by the luminosity–density field and their filament membership. We divide BGGs according to their star formation properties as quenched (Q), red star-forming galaxies (RSF), and blue star-forming galaxies (BSF). We apply multidimensional Gaussian mixture modelling to divide groups based on the properties of the groups, their BGGs, and their environments. We analyse the offset of BGGs with respect to the group centre, and the relation between the stellar velocity dispersion of BGGs σ⋆ and the group velocity dispersions σv. For comparison we also analyse the properties of single galaxies of different star formation properties in various environments.
Results. The galaxy groups in our sample can be divided into two main classes: high-luminosity rich groups and clusters, and low-luminosity poor groups with threshold luminosity Lgrthr = 15 × 1010 h−2 L⊙ and total mass Mgrthr ≈ 23 × 1012 h−1 M⊙. The brightest galaxies in clusters and groups have different star formation properties. In rich groups and clusters ≈90% of the BGGs are red quenched galaxies, while in poor groups only ≈40 − 60% of BGGs are red and quenched, and the rest of the BGGs are star-forming, either blue (20 − 40% of BGGs) or red (∼17% of BCGs). Rich groups and clusters are located in global high-density regions (superclusters) in filaments or filament outskirts, while poor groups reside everywhere in the cosmic web regardless of the global density (superclusters or voids). Clusters with quenched BGGs have higher luminosities and their BGGs are closer to the cluster centre than in clusters with star-forming BGGs. Groups of the same richness with red (quenched and star-forming) BGGs are more luminous, and they lie in higher global density environment than groups with blue star-forming BGGs.
Conclusions. Our results suggest that the evolution of groups and clusters and their BGGs is related to their location in the cosmic web. We emphasize the role of global high-density regions–superclusters as a special environment for group growth. The processes that shape the properties of groups and their BGG are different and/or have different timescales in groups and clusters.
Key words: large-scale structure of Universe / galaxies: groups: general / galaxies: clusters: general
© The Authors 2024
 Open Access article, published by EDP Sciences, under the terms of the Creative Commons Attribution License (https://creativecommons.org/licenses/by/4.0), which permits unrestricted use, distribution, and reproduction in any medium, provided the original work is properly cited.
This article is published in open access under the Subscribe to Open model. This email address is being protected from spambots. You need JavaScript enabled to view it. to support open access publication.
1. Introduction
Most galaxies in the cosmic web lie in groups of various richness from galaxy pairs to the richest clusters. Simulations show that galaxies and their systems (groups and clusters) can form in the cosmic density field where large-scale density perturbations in combination with small-scale overdensity are sufficiently high (Einasto et al. 2011a; Suhhonenko et al. 2011; Peebles 2021). Structure formation is modulated by the combination of density waves: voids form where negative phases of density waves combine, and rich clusters and superclusters form where positive phases combine. As a result, the richest, often X-ray, merging clusters typically lie in the highest density regions of the cosmic web, which are the deepest potential wells, in superclusters and their high-density cores (Hanami et al. 1999; de Filippis et al. 2005; Belsole et al. 2005; Einasto et al. 2016, 2021b; Bagchi et al. 2017). Low-density regions of the cosmic web are populated by poor groups and galaxies, which may not belong to any detectable groups (Einasto et al. 2011a, 2022; Lietzen et al. 2012; Jaber et al. 2023, and references therein). Richer galaxy groups tend to have higher connectivity than poor groups; groups in superclusters also have higher connectivity than groups of the same richness in voids (Darragh Ford et al. 2019; Einasto et al. 2020, 2021b, and references therein).
The brightest galaxies in clusters are the most luminous and massive galaxies in the Universe, often located near the centres of cluster potential wells. Early studies of the cosmic web have already shown that the brightest galaxies of clusters in superclusters are elongated along the supercluster axis, suggesting that the evolution of clusters and their brightest galaxies is related to the environment where they reside (Jõeveer et al. 1978). Observations and simulations show that the BGGs of rich galaxy clusters are more luminous and have higher stellar masses and larger stellar velocity dispersions than BGGs of poor groups (Jõeveer et al. 1978; Sohn et al. 2020; Chu et al. 2021; Marini et al. 2021; Einasto et al. 2022, and references therein). The stellar velocity dispersion of BGGs, σ⋆, is proportional to the group velocity dispersion, σv (Einasto & Einasto 2000; Sohn et al. 2020; Marini et al. 2021, and references therein).
There is no clear distinction between groups and clusters. Tully (2015) emphasized that there does not seem to be a meaningful (or useful) threshold between them. However, recently Einasto et al. (2022) found a clear limit of group luminosity between groups in the lowest global density regions and at higher density: high-luminosity groups with luminosity Lgr ≥ 15 × 1010 h−2 L⊙ are absent from the global lowest density regions. Einasto et al. (2022) divided groups into high- and low-luminosity classes at this luminosity limit. They also found that while the brightest group galaxies (BGGs) of high-luminosity groups are almost all quenched galaxies with old stellar populations, a large percentage of BGGs of low-luminosity groups are still forming stars.
In this study our aim is to search for the division of groups and clusters using information on the properties of groups, on the star formation properties of their BGGs, and on group environment. We divide the BGGs of groups into quenched galaxies with no active star formation, red star-forming galaxies, and blue star-forming galaxies, and study whether groups of different luminosity have similar BGGs. The environment of groups is defined in two different ways. First, we use data on the global environment of groups, quantified using the luminosity–density field. Using certain threshold density limits, we divide the cosmic web according to these limits as global high-density regions or superclusters, and global low-density regions or voids. We compare the groups in superclusters with those in voids to learn about whether group properties differ in various environments. We would like to understand whether superclusters and their high-density cores form a special environment for group formation and growth, and whether poor groups in superclusters are different from those in low-density environments between superclusters.
Second, we analyse information on the filament membership of groups. Our analysis brings us to the questions of whether groups of different luminosities and BGG properties are connected to filaments in a similar or a different way, and whether groups and/or their BGGs in or near filaments differ from groups far from filaments. We may speculate that luminous high-connectivity groups in global high-density regions also have more mature BGGs. Therefore, one focus of our study is a comparison of groups with quenched galaxies, and red and blue star-forming BGGs and their environments.
Among the dynamical properties of groups and clusters we analyse the location of BGGs with respect to the group centre, and compare the relation between the stellar velocity dispersion of BGGs (σ⋆) and the group velocity dispersions (σv) for groups with different BGGs. In this way we aim to obtain a better understanding of the properties and coevolution of groups and their BGGs in the cosmic web.
Our study is based on the Sloan Digital Sky Survey (SDSS) DR10 MAIN spectroscopic galaxy sample in the redshift range 0.009 ≤ z ≤ 0.200. We used this sample to calculate the luminosity–density field of galaxies, to determine groups and filaments in the galaxy distribution, and to obtain data on galaxy properties (Aihara et al. 2011; Ahn et al. 2014). The luminosity–density field with smoothing length 8 Mpc, D8, characterizes the global environment of galaxies. To include data on faint groups, we chose the sample of groups from the redshift range 0.03 ≤ z ≤ 0.08. We note that Einasto et al. (2022) used a higher redshift range, 0.07 ≤ z ≤ 0.10, in order to include rich superclusters at redshifts z ≈ 0.08 − 0.1 (the Sloan Great Wall and other superclusters). Our present sample covers the region of the Hercules supercluster at the redshift range z ≈ 0.03 − 0.04 and an underdense region between the Hercules supercluster and the Corona Borealis and Bootes superclusers at redshift z ≈ 0.07. In order to understand better the properties of BGGs of the poorest groups, we also included in our study single galaxies. Single galaxies are galaxies that do not belong to any detectable groups within the SDSS spectroscopic sample luminosity limits.
As in Einasto et al. (2022), we applied the following cosmological parameters: the Hubble parameter H0 = 100 h km s−1 Mpc−1, matter density Ωm = 0.27, parameter h = 0.7, and dark energy density ΩΛ = 0.73 (Komatsu et al. 2011).
2. Observational data
Our study is based on data from the SDSS DR10 MAIN spectroscopic galaxy sample, which is used to compile catalogues of galaxy groups and filaments and to calculate the luminosity–density field. Galaxies in this sample have apparent Galactic extinction-corrected r magnitudes r ≤ 17.77 and redshifts 0.009 ≤ z ≤ 0.200 (Aihara et al. 2011); 2014ApJS..211...17A. The absolute magnitudes of galaxies are calculated as
 (1)
(1)
where dL is the luminosity distance in units of h−1 Mpc. Here K is the k+e-correction calculated as in Blanton & Roweis (2007) and Blanton et al. (2003). For a detailed description we refer to Tempel et al. (2014b).
Galaxy groups, their brightest galaxies, and single galaxies. Based on the SDSS MAIN galaxy sample, Tempel et al. (2014b) generated a catalogue of galaxy groups, applying the friends-of-friends (FoF) clustering analysis method (Zeldovich et al. 1982; Huchra & Geller 1982). This method works as follows: in the neighbourhood of every galaxy up to a certain linking length, neighbouring galaxies are searched for. Every galaxy closer than a linking length to any member of a group is considered a member of a group.
In a flux-limited sample, such as the SDSS MAIN galaxy sample, the density of galaxies slowly decreases with distance. To take this selection effect into account, the linking length is re-scaled with distance, so that the scaling relation was calibrated using observed groups. As a result, the maximum sizes in the sky projection and the velocity dispersions of the groups are similar at all distances. The redshift-space distortions (also known as the Fingers of God) for groups were suppressed, as described in detail in Tempel et al. (2014b). The luminosities of groups Lgr in this catalogue are calculated using the r-band luminosity of group member galaxies.
Groups may also contain galaxies that lie outside the observational window. To take this effect into account, we corrected luminosities of groups for the missing (unobserved) galaxies at a distance of a given group, so that the estimated total luminosity of groups, which also takes into account the expected luminosities of the unobserved galaxies, is
 (2)
(2)
where Lobs is the observed luminosity of the galaxy. The luminosity weights versus distance of a group are plotted in Fig. 1. The value of weights increases with distance as more galaxies remain outside of the observational window. Figure 2 presents luminosity of groups versus their distance. To have a complete sample of groups, which also includes faint groups, we applied distance limits 90 − 240 Mpc (redshift range 0.03 ≤ z ≤ 0.08). As the SDSS sample cone that is close to us is very narrow, we did not use data on very close galaxies and groups. In Fig. 1 we see that within our chosen distance limits the weights are slightly higher than unity at the farthest end of our sample. This was one reason to choose the farthest distance limit for our study. This redshift range gives the lower limit of group luminosity Lgr = 1.2 × 10¹⁰ h−2 L⊙ (red line in Fig. 2), in total 20 855 groups. To characterize galaxy groups, in our analysis we used data on galaxy groups (luminosity Lgr, richness Ngal, and velocity dispersions σv) from the Tempel et al. (2014b) catalogue. We also analysed the properties of the BGGs. In groups the brightest galaxies (BGGs) in r-band are defined as the brightest galaxies in a group.
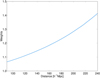 |
Fig. 1. Weights used to correct for unobserved group members outside the observational luminosity window vs. distance of groups. |
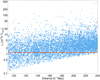 |
Fig. 2. Luminosity of groups vs distance for redshift range 0.03 ≤ z ≤ 0.08. The red line shows the adopted luminosity limit, Lgr = 1.2 × 10¹⁰ h−2 L⊙, for a complete sample of groups. To make the figure file smaller, only one-quarter of all the groups, randomly chosen, are plotted. |
Galaxies without any close neighbours are classified as single galaxies. Single galaxies may be the brightest galaxies of faint groups where other group members are too faint to be included in the SDSS spectroscopic sample. Single galaxies may also be systems in which one luminous galaxy is surrounded by dwarf satellites (called hypergalaxies in Einasto et al. 1974). We included single galaxies in our study to better understand the properties of the BGGs of the faintest groups in our sample. For our study it is important that these galaxies do not have close neighbours of approximately the same luminosity. In Sect. 4.2 we show that the absolute magnitude limit of BGGs is Mr = −19.50. Therefore, we used the absolute magnitude limited sample of single galaxies with the same magnitude limit. In total, our sample includes data on 43 315 single galaxies.
We note that SDSS spectroscopic data are known to be affected by fibre collision effect, which means that approximately 6% of the galaxies within a spectroscopic sample luminosity limit remain without measured redshifts. Duplancic et al. (2018) performed a detailed analysis on the influence of this effect to very poor groups with two or three members. They concluded that up to 10% of galaxy pairs may be missing, but otherwise the properties of groups remain unchanged. For details we refer to Duplancic et al. (2018). For our study this means that some single galaxies may actually be pair members. Therefore, in order to see whether this affects our results for the poorest groups, we formed a test sample where, to mimic missing pairs, we added a subset (10%) of randomly chosen single galaxies to the sample of the BGGs of the poorest groups, and used these samples to estimate possible biases in our analysis of the poorest groups, related to the fibre collision effect.
Global environment of galaxies: Luminosity–density field. To characterize the global environment of groups we used the luminosity–density field (Liivamägi et al. 2012), calculated via a smoothing kernel based on the B3 spline function:
 (3)
(3)
The details of the calculation of the density field using a B3 spline kernel can be found in Einasto et al. (2007b) and Tempel et al. (2014b). We use a smoothing length of 8 Mpc to define the global luminosity–density field, and denote the global luminosity–density as D8. Luminosity–density values are expressed in units of mean luminosity–density,  . In the luminosity–density field, connected regions with the highest luminosity–density above a threshold density of D8 = 5.0 are typically defined as superclusters (as in e.g., Liivamägi et al. 2012; Einasto et al. 2014, 2020). Regions of the highest luminosity–density having D8 ≥ 7 correspond to the high-density cores of superclusters. Superclusters only fill ≈1% of the SDSS volume. Most underdense regions between superclusters, where D8 < 1, occupy approximately 65% of the SDSS volume (Einasto et al. 2019). To have a quick look at the sky distribution of groups of various luminosity, we show in Fig. 3 the sky distribution of groups in our sample in a sky area that partly covers the Hercules and the Leo superclusters.
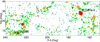 |
Fig. 3. Sky distribution of groups of different richness. The symbol sizes are proportional to the richness of the groups. Red denotes groups with Lgr ≥ 43 × 1010 h−2 L⊙, orange groups with Lgr = 15 − 43 × 1010 h−2 L⊙; green groups with Lgr = 2.5 − 15 × 1010 h−2 L⊙, and blue groups with Lgr ≤ 2.5 × 10¹⁰ h−2 L⊙. Shown are the Abell numbers for A2055 in the Hercules supercluster and for A1185 in the Leo supercluster. |
Filaments in galaxy distribution. As one proxy of an environment of groups in the cosmic web, we used their location with respect to filaments. The data on galaxy filaments are from the filament catalogues by Tempel et al. (2014a, 2016). In these catalogues the galaxy filaments were detected by applying a marked point process to the SDSS galaxy distribution (Bisous model). For each galaxy, a distance from the nearest filament axis was calculated. A galaxy is considered to be filament member if its distance from the nearest filament axis is within 0.5 Mpc, as described in detail in Tempel et al. (2014a) and Einasto et al. (2020). Filaments cover a wide range of global densities, and represent an additional way to characterize the cosmic web.
Galaxy data. In our study we obtained galaxy data from the SDSS DR10 web page1. We used the following data to characterize BGGs of different star formation properties: absolute r and g magnitude Mr and Mg, stellar mass M⋆, stellar velocity dispersion σ⋆, Dn(4000) index, and star formation rate logSFR. The rest-frame galaxy colour index (g − r)0 is defined as (g − r)0 = Mg − Mr.
The stellar masses M⋆, star formation rates (SFRs), and stellar velocity dispersions σ* are from the MPA-JHU spectroscopic catalogue (Tremonti et al. 2004); 2004MNRAS.351.1151B. The parameters of galaxies were found using the stellar population synthesis models and fitting SDSS photometry and spectra with Bruzual & Charlot (2003) models. Kauffmann et al. (2003) gives the description how the stellar masses of galaxies were calculated. The SFRs were computed using the photometry and emission lines (see Brinchmann et al. 2004, for details) and Salim et al. (2007). The stellar velocity dispersions of galaxies σ* were found by fitting galaxy spectra and employing publicly available codes: the Penalized PiXel Fitting code (pPXF; Cappellari & Emsellem 2004) and the Gas and Absorption Line Fitting code (GANDALF; Sarzi et al. 2006).
Additionally, we used the data on the Dn(4000) index of galaxies from the MPA-JHU spectroscopic catalogue (Tremonti et al. 2004); 2004MNRAS.351.1151B. The Dn(4000) index is the ratio of the average flux density in the band 4000 − 4100 Å to those in the band 3850 − 3950 Å. This index is correlated with the time passed since the most recent star formation event in a galaxy (Kauffmann et al. 2003). We used the Dn(4000) index of galaxies as calculated in Balogh et al. (1999).
The BGGs of groups also have the highest stellar masses among group galaxies. For groups with luminosity Lgr ≥ 2.5 × 10¹⁰ h−2 L⊙ this was shown in Einasto et al. (2022), who compared the stellar masses and other properties of BGGs and satellite galaxies in groups. As the Einasto et al. (2022) sample did not include groups with luminosities 1.2 × 10¹⁰ h−2 L⊙ ≤ Lgr < 2.5 × 10¹⁰ h−2 L⊙, we show this for the faint groups in Fig. 4, which presents the distribution of the stellar masses of BGGs and satellite galaxies in faint groups with luminosities from this interval.
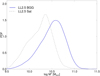 |
Fig. 4. Distribution of stellar masses, log M⋆, for the BGGs and satellite galaxies in faint groups with Lgr ≤ 2.5 × 10¹⁰ h−2 L⊙. The solid line correspond to BGGs and the dashed line to satellite galaxies in faint groups. |
Using these data, we divided the BGGs into three classes according to their star formation properties (see also Einasto et al. 2020). The data of the galaxy populations are summarized in Table 1. We use the following notation: Q for quenched galaxies with no active star formation (logSFR < −0.5); RSF for red star-forming galaxies with (g − r)0 ≥ 0.7 and logSFR ≥ −0.5; BSF for blue star-forming galaxies with (g − r)0 < 0.7 and logSFR ≥ −0.5.
BGG populations used in this paper.
Here, a word of caution is needed. SDSS data are known to be affected by aperture bias, which may lead to underestimation of the SFR for highly star-forming galaxies. We used the SFRs from Brinchmann et al. (2004), which take this into account. However, Green et al. (2017) showed that Brinchmann et al. (2004) still underestimated this effect. We did not analyse star formation properties of the BGGs in detail, and thus in the context of our study it is sufficient to understand whether our results on the star formation properties of the BGGs are sensitive to the chosen limit to separate star-forming and quenched galaxies, logSFR = −0.5. Therefore, we performed calculations also using the limits logSFR = −0.6 and logSFR = −0.4.
3. Classes of groups and dynamical properties of groups
To obtain the possible classes of groups, based on the properties of the groups, their BGGs, and their environments, we applied unsupervised classification based on multidimensional normal mixture modelling. In this analysis we used the package mclust for classification and clustering (Fraley & Raftery 2006) from the R statistical environment (Ihaka & Gentleman 1996)2. This package searches for an optimal model for the clustering of the data among the models with varying shape, orientation, and volume, and determined the optimal number of components in the data and the membership of components (classification of the data). It studies a finite mixture of distributions, in which each component is taken to correspond to a different class among groups. The mclust package also calculates the uncertainty of the classification, which is defined as one minus the highest probability of a datapoint to belong to a component. It finds for each datapoint the probability to belong to a component. The mean uncertainty for the full sample is a statistical estimate of the reliability of the results. The best solution for the components was chosen using the Bayesian information criterion (BIC).
In our calculations we varied input for mclust, and used different combinations of parameters, including group luminosity, luminosities, stellar masses and star formation properties of BGGs, global luminosity–density at a group’s location (D8), distance from filament axis (Dfil), and other properties. It is clear that the results of classification depend on input data, but a certain pattern emerged, in which groups were divided according to their luminosities, richness, star formation properties of BGGs, and global luminosity–density in a persistent way. In Sect. 4 we present the results of classification step by step, and show how the combination of parameters lead us to division of groups.
Then we study the properties of groups from different luminosity classes having different BGGs. First we continue to analyse environments of groups, considering simultaneously global luminosity–density and filament membership of groups from different luminosity classes and with different BGGs. Then we compare the properties of groups of the same richness in different environments, and the properties and environment of the poorest groups with those of single galaxies.
Finally, we investigate dynamical properties of groups. We analyse whether the BGGs of groups lie at group centres or farther away. In virialized clusters, galaxies follow the cluster potential well. Thus, we would expect that the main galaxies of rich groups and clusters lie at the centres of groups (group haloes) and have small peculiar velocities (Ostriker & Tremaine 1975; Merritt 1984; Malumuth 1992). Therefore, the peculiar velocity of the main galaxies in clusters is also an indication of the dynamical state of the cluster (Coziol et al. 2009, and references therein). However, the actual location of the BGGs depends on the orbit of the BGG, the merging history of the clusters, and on other factors. Several studies have shown, especially in the case of non-relaxed, multicomponent groups and clusters, that the BGG often lie far from the centre. In the case of multicomponent groups the BGG may lie in the centre of one component, which may not be the main component (Einasto et al. 2012). To analyse the location of BGGs with regard to the group centres, we calculate the normalized line-of-sight peculiar velocities of BGGs, Vpec, n = |Vpec|/σv, where |Vpec| is the line-of-sight velocity difference between the BGG and group centre, and σv is the velocity dispersion of a group. We also calculate the normalized offset of a BGG and group centre on the sky plane, Dcen, n = Dcen/rmax. Here Dcen is the distance of the BGG from the group centre on the sky plane, and rmax is the maximum size of a group in the sky plane. We find these characteristics for high-luminosity groups only, as they are poorly defined for poor groups (Ribeiro et al. 2013). We also compare the stellar velocity dispersions of BGGs (σ*) and group velocity dispersions (σv) in the case of high-luminosity groups.
4. Results: Division of groups
In this section we disentangle the results of group classification and analyse the properties of groups, their BGGs, and their environments step by step. Everywhere where we compare different populations we test the statistical significance of the results using the Kolmogorov–Smirnov (KS) test. If the estimated probability of rejecting the hypothesis that the distributions are statistically similar (the p-value) p ≤ 0.01 then the differences between distributions are highly significant. If not stated otherwise, the differences between the samples are found to be highly significant, and we do not present the results of the KS test in detail. We did not apply the KS test when samples were too small, for example with fewer than 20 groups (see e.g., Ribeiro et al. 2013, for the reliability of tests for samples of various size).
4.1. Global luminosity–density, group luminosity, and richness
We start with the analysis of division of groups according to the global luminosity–density, group luminosity, and richness. Figures 5 and 6 present the luminosity of groups versus global luminosity–density and versus their richness. In Fig. 6 the points are colour-coded according to the global luminosity–density region where the groups reside. We note that in this figure the richness values of very poor groups are shifted in order to avoid overlapping in the figure. We also note that even galaxy pairs and triplets have luminosity values in a rather wide range, 1.2 ≤ Lgr < 12 − 13 × 1010 h−2 L⊙, in all global environments.
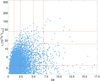 |
Fig. 5. Luminosity of groups vs global luminosity–density D8. The horizontal lines indicate the group luminosities |
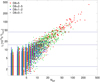 |
Fig. 6. Luminosity of groups vs. group richness. The colours denote groups in various global density D8 regions, as shown in the figure. The horizontal lines are as in Fig. 5. |
The global luminosity–density field can be divided into regions of superclusters, supercluster outskirts, and voids using characteristic threshold density as follows (see Liivamägi et al. 2012; Einasto et al. 2021b, 2022, and references therein). We use the threshold density of D8 = 5 to define the largest overdensity regions – superclusters of galaxies. The threshold density of D8 ≈ 7 delineates high-density cores of rich superclusters (Einasto et al. 2007a). Global luminosity–density D8 < 5 outlines the outskirts of superclusters and the voids between superclusters. The global lowest density regions were called the watershed regions in Einasto et al. (2022). The threshold density for the watershed regions is D8 ≤ 1.
It is clear that the global luminosity–density, group luminosities, and group richness are correlated. First of all, as already found in Einasto et al. (2022), groups with luminosity Lgr > 15 × 1010 h−2 L⊙ are absent in the global lowest density regions (watersheds). The threshold density for watershed regions is D8 = 1.15 in the case of our present sample. Therefore, groups can be divided into two main luminosity classes based on this threshold luminosity and density. Figure 6 shows that at this limit groups have richness values in a rather wide interval from 5 to 20 member galaxies.
In addition, mclust found subclasses of low- and high-luminosity groups, with luminosity limits for high-luminosity groups 15 ≤ Lgr < 43 × 1010 h−2 L⊙ and Lgr ≥ 43 × 1010 h−2 L⊙. Groups with Lgr ≥ 43 × 1010 h−2 L⊙ are only present at global luminosity–density D8 ≥ 2.38. For low-luminosity groups the luminosity limits are 2.5 ≤ Lgr < 15 × 1010 h−2 L⊙ and Lgr < 2.5 × 10¹⁰ h−2 L⊙. These groups are located everywhere in the luminosity–density field. We present in Table 2 a short summary of group properties in these luminosity classes. In Table 2 the subclasses are labelled in order as HL43, HL1543 (HL15, when taken together), LL2.515, and LL2.5 (LL15, when together). We do not analyse group masses in this paper, as the masses of poor groups are not well defined, but as many studies use masses instead of luminosity, we also provide in Table 2 the median masses of groups in each class from Tempel et al. (2014b). The median mass of groups at luminosity threshold (Lgr = 15 × 1010 h−2 L⊙) is  . We note that the masses of the groups differ by a factor of 104 (Table 2).
Data on groups.
Groups of the highest luminosity also are the richest, which is expected as their luminosity is based on luminosities of galaxies in groups. These systems are also the most massive. We also note that groups with Lgr ≥ 100 × 1010 h−2 L⊙ are present only in superclusters or in their high-density cores (Fig. 5, 19 clusters in our sample). Their luminosity and masses are comparable to those of rich clusters (see e.g., Einasto et al. 2021b, for luminosity and masses of rich clusters in the Corona Borealis supercluster). The sample of groups HL1543 represent low-mass clusters and the richest groups. For clarity, in what follows we denote all high-luminosity groups (HL15) as clusters. In doing so, we must keep in mind that the sample HL1543 also includes rich and luminous groups. The sample HL43 represents clusters, including very rich clusters.
Low-luminosity groups with Lgr < 15 × 1010 h−2 L⊙ (LL15) are also less massive and poor, with median mass  and less. We note that the mass of the Local Group is MMW + M31 ≈ 4.2 × 10¹² M⊙, which for h = 0.7 is similar to the median mass of very poor groups (see Table 2 and Lemos et al. 2021, for details and references).
The lowest luminosity groups are also the poorest, up to five member galaxies (only ∼0.5% of them have 5–10 member galaxies); approximately ∼3% of the LL2.515 groups have 10 − 20 member galaxies. In the group sample by Einasto et al. (2022) the LL15 groups were all with fewer than ten members. The difference comes from using other sample limits in the present study. We call these systems poor and very poor groups. For clarity, we use luminosity limits to denote the samples in the figures and tables. In the next section we analyse the properties of the BGGs of groups from the different luminosity classes determined above. This analysis is a second step in the division of groups into the various classes.
4.2. Star formation properties of BGGs
As a first look at the BGG properties for groups of different luminosity, we show in Fig. 7 the luminosities of groups versus the star formation properties of their brightest galaxies, logSFR. Table 3 shows the percentage of groups with quenched and star-forming BGGs among groups of different luminosity classes. The percentages of BGGs of different star formation properties in groups of different class, and for single galaxies are also shown in Fig. 8. In Table 3 and in Fig. 8 we also show the changes in percentages of BGGs with different star formation properties if we used SFR limits logSFR = −0.6 and logSFR ≤ −0.4. In Fig. 9 we present the stellar mass log M⋆–Dn(4000) index plane, colour-magnitude diagram, and star formation rate–colour diagram for BGGs of groups from different luminosity classes.
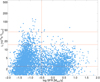 |
Fig. 7. Luminosity of groups vs. star formation rate, logSFR. The horizontal lines are as in Fig. 5. The vertical line shows the star formation rate limit for star-forming and quenched galaxies, logSFR = −0.5. Only one-quarter of all the groups, randomly chosen, are shown. |
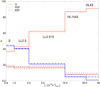 |
Fig. 8. Percentages of groups with BGGs of different star formation properties vs. group luminosity for groups from different luminosity classes and for single galaxies (S), as shown in the figure. The red line shows the percentages of quenched BGGs and the dark red dashed line shows the percentages of RSF BGGs. The blue line shows the percentages of BSF BGGs. The dotted, dashed, and dot-dashed lines show the changes in percentages if SFR limits logSFR = −0.6 and logSFR = −0.4 were used. The LL2.5 group sample in this figure is a test sample, to which is added 10% of randomly chosen single galaxies. |
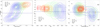 |
Fig. 9. Properties of BGGs and single galaxies. Left panel: stellar mass log M⋆ vs. Dn(4000) index. Middle panel: (g − r)0 colour index vs. absolute magnitude in r colour (colour–magnitude relation). Right panel: star formation rate logSFR vs. (g − r)0 colour index. The line colours correspond to groups of different luminosity and to single galaxies, as shown in the panels. The horizontal line in the left panel separates quenched and star-forming galaxies at Dn(4000) = 1.55. In the middle and right panels the horizontal line shows the division between red and blue galaxies at (g − r)0 = 0.7. The vertical line in the right panel shows the separation of quenched and star-forming galaxies at logSFR = −0.5. |
Percentages of different BGGs in group classes.
In these figures and table we see a clear difference in the properties of BGGs of groups and clusters, and a difference between each subclass. Clusters have mostly red BGGs with no active star formation (approximately 90% of clusters). Among the 19 richest clusters only two have star-forming BGGs. In Fig. 9 the BGGs of the HL43 groups (red contours) form a compact cloud in parameter space with high stellar masses, high values of the Dn(4000) index, red colours, and low star formation rates.
In contrast, Figs. 7 and 9 show that the star formation properties of BGGs of poor groups and single galaxies are bimodal. These trends are seen best in Tables 3 and 4, and Fig. 8. At the lowest luminosity there is a nearly equal amount of quenched (Q) galaxies and BSF galaxies, both about 40 − 45%. These proportions change systematically with group luminosity, reaching 91% and 1%, respectively, for HL43 groups. Table 3 and Fig. 8 show that if we change the classification threshold of the star formation rate, then the changes in percentages of groups with BGGs of various type are very small, typically 2% or less. The corresponding percentages for single galaxies and BGGs of LL2.5 groups have close values. Therefore, it is possible that some single galaxies are misclassified because of fibre collisions, and they belong to LL2.5 population.
Median values of luminosity of groups and clusters with different BGGs.
The proportion of intermediate, RSF galaxies varies less, being about 1/6 for poor groups and 1/12 for clusters. RSF galaxies are considered to be galaxies in transition from the blue to the red cloud. Below we study groups with RSF BGGs separately. Single galaxies follow the same trends as BGGs of LL2.5 groups, but with a larger scatter. There are also blue galaxies with low star formation rates. They form ≈2% of all BGGs in our sample, and we do not analyse groups with such BGGs separately.
In summary, there is a clear difference of BGG properties between the BGGs of clusters and groups. Therefore, the properties of BGGs, together with luminosity and the location in the cosmic web, support the division of groups and clusters into two main classes, HL15 and LL15. The BGGs of each subclass (HL1543 and HL43, and LL2.515 and LL2.5) differ in the percentage of star-forming BGGs; lower luminosity groups have a higher percentage of blue star-forming groups than higher luminosity groups and clusters. We also note that the threshold luminosity, Lgr ≈ 15 × 1010 h−2 L⊙, is approximate, and our results hold around this luminosity value.
5. Correlations with the global luminosity–density and filament membership for groups and clusters with different BGGs
To characterize the environment of groups in the cosmic web, we now use the distance of a group or cluster from the nearest filament axis (Dfil) together with the global luminosity–density field. We only use data on filaments with lengths greater than 3 Mpc, because they are more reliable (Kuutma et al. 2020; Einasto et al. 2021b). We plot in Fig. 10 the location of groups of different luminosity on the D8–Dfil plane. In this figure we indicate the threshold density for superclusters and their high-density cores, D8 = 5 and D8 = 7, as well as the threshold densities as density limits for HL15 and HL1543 clusters, D8 = 1.15 and D8 = 2.38. As mentioned above, groups and single galaxies can be considered as members of filaments if their distance from the nearest filament axis is Dfil ≤ 0.5 Mpc. We show this value in Fig. 10. We also show the value Dfil = 2.5 Mpc; this is the maximum value of Dfil for the sample of rich clusters. In what follows we denote regions with 0.5 < Dfil ≤ 2.5 Mpc as filament outskirts.
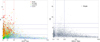 |
Fig. 10. Global density D8 vs. distance from the nearest filament axis Dfil for groups (left panel) and for single galaxies (right panel). The colours denote groups in four luminosity classes. The horizontal lines indicate global luminosity–density limits D8 = 1.15, D8 = 2.38, D8 = 5.0, and D8 = 7.0. The vertical lines show the characteristic distances from the nearest filament axis, Dfil = 0.5 Mpc and Dfil = 2.5 Mpc. |
We show in Fig. 11 the cumulative distribution of the global luminosity–density D8 at group location. For comparison with the lowest luminosity groups, we also show this distribution for single galaxies. Figure 12 shows the distributions of distances from the nearest filament axis for groups and clusters of different luminosity classes. In our further analysis we analyse the properties of groups and their BGGs in filaments, in filament outskirts, and far from filaments, which is defined as regions with Dfil > 2.5 Mpc.
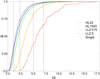 |
Fig. 11. Cumulative distribution of global luminosity–density at the location of groups. The line colours correspond to the luminosity classes, as shown in the figure. The vertical lines indicate the global luminosity–density limits D8 = 1.15, D8 = 2.38, D8 = 5.0, and D8 = 7.0. |
Figures 10 and 12 show that approximately 45 − 50% of all groups and clusters are filament members with Dfil ≤ 0.5 Mpc. Moreover, almost all HL1543 clusters (96%) have Dfil ≤ 2.5 Mpc. Therefore, they lie in filaments or in filament outskirts. Clusters, especially rich clusters, are extended objects surrounded by regions of influence and may have radii up to several megaparsecs (Tempel et al. 2014b; Einasto et al. 2020, 2021b). To be connected to a filament, it is enough for a cluster that this filament reaches the outer parts of a cluster or its region of influence. Therefore, all clusters in HL43 can be considered to be connected to a filament.
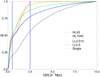 |
Fig. 12. Cumulative distributions of distances of groups from the nearest filament axis for groups of different luminosity. The line colours correspond to the luminosity classes, as shown in the figure. The vertical lines show the characteristic distances from the nearest filament axis, Dfil = 0.5 Mpc and Dfil = 2.5 Mpc. |
In the lowest global luminosity–density regions with 1.15 < D8 < 2.38 (the density limits at which there are no very rich clusters) even 78% of poor clusters lie at distances from the nearest filament axis Dfil ≤ 1 Mpc, which is approximately the size of poor groups (Tempel et al. 2014b). This is in agreement with understanding that groups form at the intersections of filaments. At low global luminosity–density regions even in filaments clusters cannot become very rich; the very rich clusters can only be seen in filaments at D8 > 2.38. This may be related to higher connectivity of clusters in superclusters, as was shown in Einasto et al. (2020) for clusters in the A2142 supercluster and in low-density region around it. To verify this assumption for a large sample of groups and clusters a separate study is needed.
Now we compare environments of groups and clusters with BGGs of different star formation properties. Table 5 presents median values of D8 at the location of groups and clusters with different BGGs, and Tables 6–8 show how groups with different BGGs from each luminosity range are spread between regions of different global luminosity–density and at various distances from the filament axis.
Median values of the global luminosity–density at group location, D8.
Groups and their BGGs in various global luminosity–density D8 regions.
Median values of the distances from the nearest filament axis, Dfil, for filaments with length L ≥ 3 Mpc.
Groups and their BGGs in filaments, in filament outskirts, and far from filaments.
From these tables we see that high- and low-luminosity groups do not populate the luminosity–density field in the same way. The richest clusters (HL43) have minimal threshold density at their location, D8 = 2.38. A total of 40% of rich clusters lie at supercluster outskirts, at global luminosity–density D8 = 2.38 − 5, and 60% lie in superclusters (34% in supercluster high-density cores with D8 ≥ 7). The L1543 groups populate mostly supercluster outskirts or even voids (80% of such groups), but they are absent in extreme void environments (D8 < 1.15). Only 6% of these groups lie in supercluster high-density cores. In contrast, poor (LL15) groups lie mostly in low global luminosity–density environments. Less than 10% of these lie in superclusters, and this percentage decreases for the poorest groups and single galaxies.
At all group luminosities, groups with red quiescent BGGs lie in higher density environments than groups with blue star-forming BGGs. In addition, Table 7 tells that, on average, groups and clusters with quenched BGGs have lower values of the distances from the filament axis than groups with RSF BGGs, and, in turn, groups with RSF BGGs have lower values of the distances from the filament axis than groups with BSF BGGs.
At the same time, Table 6 shows that the percentages of groups from a given luminosity range having quiescent, RSF or BSF BGGs do not change with global luminosity–density. The same can be seen from Table 8: the percentages of groups with different BGGs do not change with the group’s distance from the filament axis. Even among the poorest lowest luminosity groups in extreme void regions these percentages are the same as among groups in filaments and in filament outskirts. This suggests that group and cluster properties are modulated by their location in the cosmic web, but the properties of the BGGs in them are mostly determined by processes within group or cluster dark matter halo.
In contrast to groups, 20% of single galaxies are members of filaments with Dfil ≤ 0.5 Mpc, and altogether 47% of single galaxies lie far from the nearest filament axis with Dfil > 2.5 Mpc (Tables 7 and 8). In addition, far from filaments the percentage of both red and blue star-forming BGGs of the lowest luminosity groups and single galaxies increases and the percentage of quenched BGGs and single galaxies decreases. In agreement with this, the median distance from the nearest filament axis increases. These trends are weak or absent in the case of clusters.
Luminosities of poor groups of the same richness in various environments. Above we showed that the richest and most luminous clusters reside in superclusters. Clusters with quenched BGGs have higher global luminosity–density values at their location than clusters with star-forming BGGs. Next we compare luminosities of poor groups of the same richness in high-density (supercluster) and low-density (void) environments. In this test we varied the richness of the groups; in Fig. 13 we show the results for Ngal = 5 and Ngal = 10. For groups with Ngal = 5 we show distributions of luminosities for groups with different BGGs. In the case of groups with Ngal = 10, owing to the small number of groups, we do not divide them according to the BGG properties. We also compare the luminosities of single galaxies with different star formation properties in superclusters and in voids (Fig. 14).
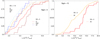 |
Fig. 13. Cumulative distributions of group luminosities in high and low global luminosity–density regions for groups with Ngal = 5 with different BGGs (left panel) and for groups with Ngal = 10 (right panel). The line colours correspond to groups with different BGGs in high- and low-density environments, as shown in the figure. |
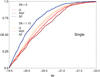 |
Fig. 14. Cumulative distributions of luminosities of single galaxies Mr in high and low global luminosity–density regions. Luminosity–density limits are shows in each panel. |
Our calculations show that groups of the same richness in superclusters have higher luminosities than in voids. Groups with Ngal = 5 with red (quenched and star-forming) BGGs are more luminous in superclusters than in voids (Fig. 13). In voids, groups with quenched and RSF BGGs have statistically similar luminosities, while in superclusters groups with Ngal = 5 with RSF BGGs are more luminous than groups with quenched BGGs. Luminosities of poor groups with BSF BGGs and Ngal = 5 are statistically the same in all environments.
Figure 14 shows that a similar result also holds for single galaxies: single galaxies with the same star formation properties have higher luminosities in higher global luminosity–density environments. This is statistically highly significant for all galaxy types. We note that the spread of luminosities among groups with Ngal = 5 with BSF BGGs, both in superclusters and in voids is smaller than the spread of luminosities among groups with red BGGs, and also smaller than among single galaxies. This is also seen in Fig. 14.
Interestingly, the differences in group luminosities in superclusters and voids are the largest at a richness value of approximately Ngal = 10, although the overall spread of group luminosities is larger at lower richness values (Fig. 6). Groups with Ngal = 10 in superclusters have median luminosity Lgr ≈ 13.6 × 10¹⁰ h−2 L⊙, while in voids the median luminosity of such groups is Lgr ≈ 10.3 × 10¹⁰ h−2 L⊙. This may be related to the low percentage of groups with BSF BGGs among group with Ngal = 10. These groups showed no difference in luminosities in superclusters and in voids. This finding gives additional support to the division of the group sample at approximately this richness.
Finally, we compared luminosities of groups with Ngal = 5 and Ngal = 10 in and near filaments, and in filaments, in filament outskirts, and far from filaments. Our analysis shows trends that groups of the same richness in filaments are more luminous than groups far from filaments, but these results were statistically not significant. Therefore, we do not present the corresponding figures.
For poor groups these trends have also been found in earlier studies. Einasto et al. (2003, 2005) showed, using data from observations and simulations, that poor groups near rich clusters are more luminous and have higher values of velocity dispersions than groups far from rich clusters. Lietzen et al. (2012) and Poudel et al. (2017) demonstrated that groups of the same richness are more luminous in superclusters than in voids. Moreover, Poudel et al. (2017) found that BGGs of poor groups in filaments have a higher probability to be of early type than the BGGs of groups outside filaments. Our findings in this study confirm these results.
6. Dynamical properties of groups of different luminosity and BGGs
In this section we compare the dynamical properties of groups and clusters with different BGGs. For this purpose, we first analyse the location of the BGGs of clusters with respect to the cluster centre (Fig. 15). Then we compare the stellar velocity dispersions of BGGs σ* and cluster velocity dispersion σv (Fig. 16). We do not analyse poor groups in detail as in these groups the properties are not reliably defined. As above, we divide the BGGs according to their star formation properties.
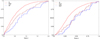 |
Fig. 15. BGG location with respect to the cluster centre (sample HL15). Left panel: normalized line-of-sight velocity, Vpec, n. Right panel: normalized distance from the cluster centre on the sky plane, Dcen, n. The line colours correspond to clusters with different BGGs, as shown in the panels. The red line denotes clusters with quenched (Q) BGGs, the dark red line denotes clusters with RSF BGGs, and the blue line denotes clusters with BSF BGGs. |
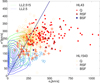 |
Fig. 16. BGG stellar velocity dispersion σ* vs. group velocity dispersion σv. The symbol colours correspond to groups of different luminosity, as shown in the panels. The line correspond to σ* = σv. |
We present for clusters the normalized line-of-sight velocities and projected to the sky distances from the cluster centre in Fig. 15. As the number of rich clusters with star-forming BGGs is small, and distributions are very similar for HLG43 and HLG1543 clusters, we do not show the distributions for the two subclasses of clusters separately. Figure 15 shows that quenched BGGs are located closer to the cluster centre than star-forming BGGs. In the sky plane, the median values of normalized distances Dcen, n for quenched BGGs are Dcen, n ≈ 0.30, while for clusters with RSF BGGs Dcen, n ≈ 0.45. For clusters with blue star-forming BGGs the values of Dsky, n are the largest, Dcen, n ≈ 0.47.
Along the line of sight the median value of normalized distances Vpec, n for clusters with quenched BGGs Vpec, n ≈ 0.44, and for clusters with star-forming BGGs are Vpec, n ≈ 0.55 and Vpec, n ≈ 0.70 for red and blue star-forming BGGs, correspondingly. Einasto et al. (2012) found that high values of the distances of BGGs may indicate that clusters are multimodal, and the brightest galaxy may be located near the centre of a component in a cluster, but not in the central component. The detailed analysis of substructure of rich groups and clusters with different BGGs could be a topic for another study. In this paper we conclude that clusters with star-forming BGGs are dynamically different from clusters with quenched BGGs, as their BGGs have not yet reached the cluster centre.
Next we analyse the velocity dispersions σv of groups from different luminosity classes, having different BGGs (Fig. 16). As mentioned, velocity dispersions of poor groups are not reliable, they are plotted for comparison. Figure 16 shows that σ* values are the highest for quenched BGGs, RSF BGGs have intermediate stellar velocity dispersions, and BSF BGGs have the lowest stellar velocity dispersions. The BGG stellar velocity dispersion σ* is proportional to the group and cluster velocity dispersion σv in a wide range of velocity dispersions, and flattens at high end values of σv. Among clusters with the highest values of σv (σv ≳ 600 and σ* ≳ 200) there are very rich, multicomponent clusters in superclusters. Their high values of σv and multimodality may be related; this is an interesting topic for a separate study.
At the lower end of group velocity dispersions simulations predict very few groups (see Fig. 4 in Marini et al. 2021). In Fig. 16 this area is populated by clusters with star-forming BGGs. We may assume that these BGGs will also eventually be quenched, and for this reason in simulations the number of such BGGs is very small. Clearly, more detailed analysis of the relations between the properties and formation of clusters and their BGGs is needed in order to understand better the formation of clusters and their BGGs (see also recent studies by Sohn et al. 2022, on the dynamical evolution of clusters and their BGGs in the Illustris simulation).
Figure 17 shows for high-luminosity clusters that clusters with the highest velocity dispersions σv mostly populate superclusters and their high-density cores with D8 ≥ 7. Out of 27 groups with σv ≥ 600 (flattened part in group velocity dispersion σv vs. the BGG stellar velocity dispersion figure, Fig. 16) only 8 groups lie outside of superclusters, while 13 of these clusters lie in high-density cores of superclusters. This again suggests that the growth of clusters and the evolution of their BGGs in superclusters and elsewhere are different, and that the properties of BGGs are more related to processes in the inner core of clusters and not to the large-scale environment. In Fig. 18 we see that there is no large difference in how clusters with the highest velocity dispersions σv populate filaments. Nine of these clusters lie at the filament axis, while 12 are located in filament outskirts.
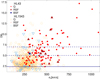 |
Fig. 17. Cluster velocity dispersion σv vs. global luminosity–density at the location of clusters, separately for clusters with BGGs of different star formation properties, as shown in the plot. Horizontal lines mark global luminosity–density limits D8 = 2.38, D8 = 5.0, and D8 = 7.0. |
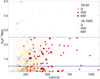 |
Fig. 18. Cluster velocity dispersion σv vs. the distance from filament axis, separately for clusters with BGGs of different star formation properties, as shown in the plot. The horizontal lines show characteristic distances from the nearest filament axis, Dfil = 0.5 Mpc and Dfil = 2.5 Mpc. |
7. Summary and discussion
We analysed the properties of galaxy groups and clusters with BGGs of different star formation properties in the cosmic web, characterized by the luminosity–density field and filament membership. Our study showed that groups and clusters can be divided into two main classes according to their luminosity, BGG properties, minimal global luminosity–density at their location, and filament membership. We call these classes groups and clusters. The threshold luminosity of groups and clusters between these main classes is approximately Lgr = 15 × 1010 h−2 L⊙ (mass Mgr ≈ 23 × 1012 h−1 M⊙, and richness Ngal ≈ 10; Figs. 5–8).
The BGGs of groups and clusters have different star formation properties. In approximately 90% of clusters the brightest galaxies are red, with no active star formation. In contrast, in poor groups and among single galaxies only ≈40 − 60% of BGGs are red and quenched, and ≈60% of the BGGs of poor groups and single galaxies are either red or blue star-forming galaxies. Clusters lie in filaments or the filament outskirts in superclusters or the supercluster outskirts, and are absent in void regions between superclusters where D8 ≤ 1. The richest clusters with luminosity Lgr ≥ 100 × 1010 h−2 L⊙ can only be found in superclusters with D8 ≥ 5. In contrast, poor low-luminosity groups and single galaxies lie everywhere in the global luminosity–density field, including in void environments, in filaments, and also far from filaments. Clusters with different BGGs have different dynamical properties. Groups of the same richness are more luminous in superclusters than in voids. This difference is the largest approximately at the richness limit between groups and clusters, Ngal ≈ 10. Next we briefly discuss our results in the context of group evolution in the cosmic web. We start with a short comparison with previous work.
7.1. Comparison with previous work
Our study covered the properties and the location in the cosmic web of a wide range of galaxies and galaxy systems, from single galaxies to rich clusters. We start the comparison from single galaxies. Single galaxies may be isolated galaxies, that is, galaxies that do not have close bright galaxies according to certain criteria (Sulentic et al. 2006; Tempel et al. 2014b; Lacerna et al. 2016).
We found that approximately one-third of single galaxies are already quenched, with no active star formation. This is the same percentage as found in Einasto et al. (2020) in underdense regions around the supercluster SCl A2142. This percentage is higher than found among isolated galaxies in, for example, the AMIGA sample of isolated galaxies, where up to 14% are elliptical and lenticular galaxies (Sulentic et al. 2006). However, we analyse a sample in a wide range of environments, and our sample does not include very faint galaxies, and this explains the difference. Among single galaxies the percentage of star-forming galaxies is higher in the lowest global density environments, where galaxy population is mostly formed by faint star-forming galaxies (Beygu et al. 2016).
Small groups of galaxies (galaxy pairs and triplets), similar to our LL2.5 groups, were analysed in Duplancic et al. (2018, 2020). The authors showed that galaxies in very small groups tend to have higher star formation rates, and they lie in lower density environments than galaxies in groups with four or more member galaxies, in qualitative agreement of our study.
Galaxy groups have been studied in many papers, but a different choice of groups complicates the detailed comparison of the various results. Next we briefly describe some studies of groups. Recently, a statistically complete optically selected sample of 53 nearby groups within 80 Mpc (the Complete Local-Volume Groups Sample, CLoGS), was analysed in a series of papers (O’Sullivan et al. 2017; O’Sullivan et al. 2018; Kolokythas et al. 2018, 2022; Loubser et al. 2022; Lagos et al. 2022). The authors estimate that the X-ray bright groups have masses in the range M500 ≈ 0.5 − 5 × 10¹³ M⊙. Therefore, the CLoGS sample includes groups in a mass range approximately similar to the high-mass end of our LL2.515 groups and the low-mass end of HL1543 groups. In 18 groups from this sample the brightest galaxies are of early-type (Loubser et al. 2022). This is lower percentage than the percentage of quenched galaxies in our LL2.515 and HL1543 groups, but the difference can be explained with a different selection criteria of the groups. The poorest groups in this sample contain four bright galaxies (O’Sullivan et al. 2017). Therefore, some CLoGS groups may be comparable to low-luminosity LL2.515 groups in our study. Among these groups the percentage of star formation is higher, and this may explain the lower percentage of early-type galaxies among CLoGS groups.
Recent papers by Gozaliasl et al. (2016, 2018) are dedicated to the study of the brightest galaxies in X-ray groups over a wide range of masses, M200 ≈ 1012.8 − 1014 M⊙, and redshifts, 0.04 ≤ z ≤ 1.3. These groups correspond approximately to our LL2.515 and HL15 groups, but from a much wider redshift range. Gozaliasl et al. (2016, 2018) found that the percentage of star-forming BGGs in groups increases towards lower group masses and higher redhshifts. Our findings are in agreement with the first trend in star formation properties from these studies. Gozaliasl et al. (2020) showed that in low-mass groups BGGs have higher peculiar velocities. In our study we found that in HL15 groups star-forming BGGs have higher peculiar velocities than quenched BGGs. Star-forming BGGs have lower stellar masses than quenched BGGs, and in this respect our results are in qualitative agreement with those by Gozaliasl et al. (2020).
In very rich clusters the percentage of star-forming brightest galaxies (in clusters these are called as the brightest cluster galaxies, BCGs) is very low, as found also in studies of the brightest galaxies in groups and clusters by, for example, Cerulo et al. (2019), Orellana-González et al. (2022). They found that in low-mass groups the percentage of star-forming BGGs may be up to 30%, while in rich clusters less than 10% of BGGs are star forming. Cerulo et al. (2019) mention that some star-forming BGGs may have red colours. They suggest that the colours of these galaxies may be affected by the presence of dust in them.
Poudel et al. (2017) and Kuutma et al. (2020) compared the properties of the BGGs of groups from the SDSS sample near the filament axis and outside of filaments. For very poor groups comparable to our LL2.515 groups, Kuutma et al. (2020) found that the properties of the BGGs in and near filaments are statistically similar. They concluded that the properties of BGGs in very poor groups are mainly determined by the local group environment. Poudel et al. (2017) used galaxy groups based on the volume-limited group sample drawn from the SDSS data to show that groups in superclusters have higher masses, and their BGGs have higher stellar masses than groups in low-density regions. They also compared the properties of the BGGs in filaments and far from filaments in detail, and showed that BGGs in groups in filaments are more luminous and their central galaxies have higher stellar mass, redder colours, and lower star formation rates than those outside of filaments. The masses of groups based on SDSS data in superclusters and elsewhere have been recently compared by Sankhyayan et al. (2023). Sankhyayan et al. (2023) found that groups in superclusters have, on average, higher masses than groups in low-density regions, in agreement with our results.
Einasto et al. (2011b) found that in the richest superclusters of the Sloan Great Wall, groups with early-type BGGs have more uniform distribution than groups with late-type BGGs. For a small sample of groups and clusters in the Corona Borealis supercluster Einasto et al. (2021b) determined a concordance between the properties of clusters and groups in their spheres of influence: groups within the spheres of influence of clusters with a higher percentage of quenched galaxies also have higher percentage of quenched galaxies than groups farther away.
7.2. Growth of groups and clusters in the cosmic web
According to the current cosmological paradigm, the evolution of the structure started in the early inflationary stage of the evolution of the Universe. Superclusters that embed rich clusters are formed by medium- and large-scale perturbations, which combine in similar overdensity phases, and amplify the growth of small-scale perturbations (Einasto et al. 2011a). Voids are regions in space where medium- and large-scale density waves combine in similar underdensity phases, and suppress the growth of galaxy-scale perturbations. The luminosity limits of groups and clusters in the global luminosity–density field come from the way density waves of different wavelength combine to form the cosmic web. Numerical simulations suggest that seeds of present-day rich clusters of galaxies with first-generation stars were already present at redshift z ≥ 30 (Gao et al. 2005); 2005MNRAS.363..393R. These perturbations were the basis of the skeleton of the cosmic web.
The seeds of galaxies are small-scale density perturbations that grew via merging and the accretion of smaller structures (Einasto et al. 2011a). Medium- and large-scale perturbations modulate the evolution of small-scale perturbations. Galaxies can form everywhere in the cosmic web where large-scale density perturbations in combination with small-scale overdensities are high enough (Peebles 2021; Repp & Szapudi 2019).
Rich clusters lie in or near superclusters in filaments or in filament outskirts, and grow by infall of single galaxies and poor groups along filaments (McGee et al. 2009; Tully et al. 2014; Einasto et al. 2019, 2021a; Momose et al. 2022; Smith et al. 2023). Single galaxies and poor groups are richer and more luminous in superclusters; this phenomenon has been called the environmental enhancement of poor groups by Einasto et al. (2003, 2005). A similar property of groups has been found in Lietzen et al. (2012) and in Poudel et al. (2017). This is an additional factor that enhances the growth of rich clusters in superclusters. Momose et al. (2022) showed that at redshifts z ≈ 2 galaxies in high-density environments are more massive than galaxies in low-density environments. Einasto et al. (2020) found that in the supercluster A2142 even poor groups are probably merging. In contrast, in low global luminosity–density environments there are no rich groups and clusters, meaning that even close to the filament axis the local density enhancements are not high enough and groups are too far apart to merge and form richer groups and clusters.
Single galaxies and low-luminosity poor groups can be found everywhere in the cosmic web, from the lowest global density regions to the high-density cores of superclusters. Even almost one-half of single galaxies lie far from filaments, and three-quarters of them lie at low global luminosity–density (D8 ≤ 2.38). This agrees with the recent finding by Jaber et al. (2023) who showed using simulations that voids are mostly populated by haloes with mass below M ≈ 1012 h−1 M⊙, approximately the mass of the lowest luminosity groups (LL2.515). Duplancic et al. (2020) found that the poorest groups (pairs and triplets of galaxies) reside in the lower density environments than groups with four galaxies or more.
Einasto et al. (2022) mentioned that single galaxies in the Tempel et al. (2014b) catalogue may also be outer members of rich clusters in which their closest neighbour galaxies are faint, and therefore single galaxies are not connected with other group members by FoF algorithm. This assumption was supported by the finding that in their properties (e.g., the distributions of stellar masses and star formation properties) single galaxies and satellites of high-luminosity groups are similar (see Einasto et al. 2022, for details). In order to be outer members of clusters, single galaxies have to be located in their close neighbourhood. While a detailed analysis of this problem merits separate study, we can give some estimates here. Rich clusters lie in the global luminosity–density field with D8 ≥ 2.38 and Dfil ≤ 2.5 Mpc. Our calculations show that approximately 17% of single galaxies lie in such environments, and only 3% of single galaxies lie in superclusters near the filament axis. Therefore, the comparison of the environments of rich clusters and single galaxies shows that a large majority of single galaxies lie too far from clusters to be cluster members, and, most likely, they are the brightest galaxies of faint groups. The similarity of the properties of single galaxies and the BGGs of faintest groups supports this conclusion.
We made a similar test for the lowest luminosity groups (LL2.5). This test showed that 25% of such groups lie in regions with D8 ≥ 2.38 and Dfil ≤ 2.5 Mpc, but only 5% of these lie in superclusters with D8 ≥ 5 and Dfil ≤ 2.5 Mpc. Therefore, as in the case of single galaxies, a majority of the lowest luminosity groups lie too far from high-luminosity groups for infall.
In addition, our test showed that some single galaxies may be misclassified pair members (due to fibre collisions), and that galaxy pairs may actually belong to triplets. We analyse pairs and triplets of galaxies together as groups of the lowest luminosity, and thus, on average, the results do not change because of this. We also found that the trends with environment, and the properties of single galaxies and the lowest luminosity groups are similar. Thus, we can say that fibre collision effects do not change our results significantly.
Even if single galaxies and the lowest luminosity groups in our study lie far from filaments, this does not mean that they form a random population in voids. Although Galárraga-Espinosa et al. (2022) found some haloes not related to filaments, observations and simulations suggest that galaxies with luminosity Mr ≤ −19.5 (the luminosity limit in our study) form hierarchical filamentary network in voids, and fainter galaxies are located in the same filamentary structures as brighter ones (Lindner et al. 1995); 2023MNRAS.523.4693E.
7.3. Groups with different BGGs in the cosmic web
In addition to differences in luminosity, richness, and environment, we found that the BGGs of groups and clusters are different. Clusters have mostly quenched BGGs (only 8% of them have RSF BGGs, and 1–5% are with BSF BGGs) with the highest stellar masses and luminosity and the lowest star formation rates among BGGs. At the same time, more than one-half of poor groups have star-forming BGGs.
In clusters with a quenched BGG the BGG is located closer to the group centre than in clusters with a star-forming BGG. This is an indicator that clusters are also dynamically old, but galaxies in poor low-luminosity groups are still in the segregation stage. As a support to this, Einasto et al. (2022) found that in most groups with star-forming BGGs at least one member galaxy is quenched. They suggested that perhaps such groups are still forming, and it has not yet been established which galaxy will be central during future evolution. In addition, Einasto et al. (2012) found that in multimodal groups the BGG may lie far from the group centre. Einasto et al. (2012) noted that typically in such cases the BGG lies in one of the components of a group, but not in the main component. This suggests that these groups are still forming.
Flattening of σ* − σv at the high end in Fig. 16 is in a good agreement with predictions of the DIANOGA hydrodynamical zoom-in simulations (Marini et al. 2021). This flattening had already been observed in very early studies of galaxy groups and clusters (Einasto et al. 1976). This may be related to the growth of rich clusters. The stellar velocity dispersion σ* of BGGs of some clusters have values of the same order as has the high end of velocity dispersions σv of poor groups. This can be interpreted as a signature that the central part of a cluster hosting present-day BGG started to form first. The BGGs in such clusters were formed at early stages of group or cluster formation. Then the group grows by the merging and infall of surrounding galaxies and groups that increase overall velocity dispersion of a group, but do not affect the BGG strongly (see also discussion in Dubinski 1998; Einasto & Einasto 2000; Damsted et al. 2023).
One interesting result of our study is that the percentage of RSF BGGs among poor groups and single galaxies is very stable, approximately 17% in all environments. Only far from the filament axis (Dfil ≥ 2.5 Mpc) is the percentage of RSF BGGs higher, reaching almost 25% of all BGGs of the lowest luminosity groups and single galaxies in these environments. The percentage of RSF BGGs among rich groups and clusters is also stable in all environments, but, in contrast to poor groups, it is much lower, approximately 8%. RSF galaxies are mostly of late type; they belong to the high-mass end of late-type galaxies (Masters et al. 2010; Einasto et al. 2011b, 2014, 2018; Schawinski et al. 2014). Schawinski et al. (2014) noted that such galaxies are mostly central galaxies in haloes with mass higher than Mhalo ≈ 1012 h−1 M⊙. In our sample this mass approximately corresponds to the mass limit of LL2.515 groups. Einasto et al. (2018) found that in groups of the supercluster SCl A2142 RSF galaxies seem to avoid central parts of clusters. Their sample of groups was small, and did not exclude the possibility that these galaxies are the brightest galaxies in groups. Schawinski et al. (2014) and Sarkar et al. (2022) related the phenomenon of red spirals with gas content of galaxies: spiral galaxies with low cold gas fractions may be more easily quenched and become red.
Another interesting finding is that the spread of luminosities of poor groups with Ngal = 5 with BSF BGGs, both in superclusters and in voids is smaller than the spread of luminosities among groups with red BGGs, and also smaller than among single galaxies. This is also seen in Fig. 14, where the spread of parameters of single galaxies is larger than that of BGGs of low-luminosity groups. There are single galaxies with higher stellar masses and luminosities than BGGs of low-luminosity groups. We may speculate that this has following explanation. Galaxies, groups, and clusters form in dark matter haloes of different mass: the richer the system, the higher the halo mass needed for its formation. Single galaxies (the brightest galaxies of faint groups) form in haloes where the halo mass is not high enough for the formation of more than one luminous galaxy, but, in turn, the brightest galaxy in such a halo may be more massive and luminous than any individual galaxy in a higher mass dark matter halo where more than one luminous galaxy can form.
7.4. Processes at work to shape the properties of groups and their BGGs
We showed that the properties of BGGs are different in groups of different luminosity. In particular, the stellar masses of the BGGs increase from single galaxies to the BGGs of the richest clusters. To show this better we plot the distribution of stellar masses log M⋆ of BGGs and single galaxies in Fig. 19, and provide median values of stellar masses in Table 9. This suggests that processes that shape the properties of the BGGs are different (or have different timescales) in groups and clusters.
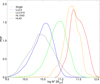 |
Fig. 19. Distribution of stellar masses, log M⋆, for the BGGs in groups of various luminosity, and for single galaxies. |
Median values of the stellar masses of BGGs.
Galaxy groups and clusters grow by infall of individual galaxies and groups, and by the merging of groups and clusters (Berrier et al. 2009; McGee et al. 2009; Haines et al. 2018; Benavides et al. 2020). The growth of galaxies and their stellar mass, stochastic fluctuations of star formation rate, and finally star formation quenching are governed by various processes, which are divided into ‘internal’ and ‘external’ (Boselli & Gavazzi 2006; Paulino-Afonso et al. 2020; Tacchella et al. 2020; Patel et al. 2023). Stellar masses of galaxies grow by mergers and gas infall. Internal processes, also called as mass quenching, depend first of all on the mass of the dark matter halo of a galaxy. Processes that blow out galactic gas include stellar winds, supernova explosions, and active galactic nucleus (AGN) feedback (Matteucci et al. 2006; Croton et al. 2006; Henriques et al. 2019; Vulcani et al. 2021). These processes are more effective in massive galaxies (Contini et al. 2020) and at higher redshifts, although outflows of gas are also important in low-mass galaxies.
External processes that eventually end the star formation in galaxies are caused by environmental quenching, which depends on the local environment of galaxies within groups or clusters (Pasquali et al. 2019; Vulcani et al. 2021; Werner et al. 2021). Such processes include the stripping of galactic gas by the ram pressure of the hot gas in a group or cluster (Gunn & Gott 1972; Yun et al. 2019; Kolcu et al. 2022; Herzog et al. 2022; Zhu et al. 2024), viscous stripping removing cold gas (Nulsen 1982), starvation due to detachment from gas-feeding primordial filaments and cosmic web stripping (Aragon Calvo et al. 2019; Maier et al. 2019; Winkel et al. 2021; Herzog et al. 2022), and harassment by high-speed mergers (Moore et al. 1996). These processes depend on the density of the environment, on the orbital properties of galaxies, and also on galaxy mass, and they are more effective in less massive galaxies.
Single galaxies are stellar systems like our own Milky Way galaxy, surrounded by dwarf satellites in their dark matter halo, and without close neighbours in the same luminosity range. The properties of single galaxies are determined by processes in their dark matter haloes and intergalactic medium around them. Single galaxies are fed by dwarf satellites, and by gas and dark matter from filaments in immediate surroundings of a galaxy (Haywood et al. 2016; Bell et al. 2017; Di Matteo et al. 2019; Quilley & de Lapparent 2022). Such events may disturb gas inflow from the surroundings and lead to a star formation quenching in single galaxies (Lacerna et al. 2016; Mazzei et al. 2022). Quenching of single galaxies may be a result of the cosmic web detachment (i.e., detachment of primordial gaseous filaments), which provided galaxies with a fresh gas supply and supported star formation in them (Aragon Calvo et al. 2019).
In contrast to single galaxies, galaxies in low-luminosity groups have close neighbouring galaxies in the same luminosity range. Thus, interactions with neighbouring galaxies are not restricted to faint dwarf satellites, as in the case of single galaxies. This changes the character and frequency of mutual interactions. Star-forming BGGs may be influenced by mergers or interactions from neighbouring galaxies (Jung et al. 2022). Most interactions with neighbouring galaxies are related with the infall of neighbouring galaxies to the more massive (luminous) galaxy. Impact angles of infalling galaxies depend on the richness of the systems (Gouin et al. 2021; Salerno et al. 2020). In rich systems infall occurs mainly along the filaments surrounding clusters, while in small systems the infall angles are more randomly distributed. Only rarely is the impact directed towards the central galaxy, which leads to the merger of the two galaxies and changes the properties of the central galaxy. This may be the reason why the trends with environment of the poorest groups and single galaxies are similar.
Star-forming BGGs obtain their gas from the surrounding medium or from stripped satellites (Aragon Calvo et al. 2019; Jung et al. 2022). If the gas supply stops, then the galaxy stops forming stars (called the cosmic web detachment in Aragon Calvo et al. 2019). The effectiveness of this process depends on several factors, including the activity of the central supermassive black hole (Jung et al. 2022). Very poor groups lie, on average, in a slightly higher density environment than single galaxies. Therefore, the gas supply to increase the stellar mass of galaxies, as well as the interactions with nearby galaxies may trigger star formation and then quenching in such groups (see also discussion about the properties of galaxies in small groups by Hickson 1982; Duplancic et al. 2018).
Sarkar et al. (2022) found differences in both local and global environments of red and blue spirals, red spirals being located in higher density environments than blue spirals. They assume that perhaps the spirals with high cold gas content may have a blue colour, whereas the spirals with low cold gas content may have decreased their star formation and become red. Therefore, we can assume that in the faintest groups the local environment is more important than the whole group in shaping their BGGs.
Our analysis shows that the properties of LL2.515 groups and their BGGs lie between the LL2.5 groups (and single galaxies) and the HL15 groups. LL2.515 groups can grow by infall of single galaxies, and by the mergers of galaxy pairs and triplets. Therefore, their BGGs also have more supply to grow their stellar masses and quench their star formation.
Galaxies with their dark matter haloes are located in dark matter filaments. The enhanced evolution of groups and single galaxies in superclusters may also be related to a larger amount of gas in filaments in global high-density regions near clusters, as found in the simulations (Tuominen et al. 2021). This again emphasizes the role of high-density environments in the evolution of galaxies and groups.
Jung et al. (2022) and Saeedzadeh et al. (2023) analysed the properties of central galaxies of group-sized haloes from Romulus simulations, and the circumgalactic medium around them. Saeedzadeh et al. (2023) say that the presence of cold gas and gaseous disks, rejuvenations, and the ongoing star formation in BGGs of groups indicate that BGGs must be receiving inflow of gas from their surroundings. Gas flows onto the central BGG via a filamentary cooling flows and by infalling cold gas. They describe two pathways by which the gas that surrounds the BGGs cools. The first is via filamentary cooling inflows; another is via condensations forming from rapidly cooling density perturbations, which are mainly seeded by orbiting substructures. In nearby groups, AGN feedback, stripping, and both gas-rich and gas-poor mergers in the history of BGGs are also important (O’Sullivan et al. 2017; O’Sullivan et al. 2018; Kolokythas & CLoGS Team 2021; Loubser et al. 2022). The importance of accretion in the evolution of BGGs in groups is noted in Gozaliasl et al. (2020). These studies suggest that BGGs of groups evolve under the influence of various mechanisms, both internal and external (Loubser et al. 2022, and references therein).
High-luminosity groups and clusters of galaxies are preferentially located in global high-density regions in filaments or filament outskirts. All the richest and most luminous clusters reside in high-density cores of superclusters. In addition, the spheres of dynamical attraction of rich clusters are much larger than those of groups (Einasto et al. 2021b). A considerable fraction of interactions are due to infall of neighbouring galaxies and groups along filaments, directed to clusters, especially in supercluster cores. This means that the growth of clusters and the character and/or timescale of interactions between galaxies changes in comparison with poor groups. Galaxies fall into rich clusters along filaments, which also enhances the quenching of galaxies in comparison with isotropic infall in poor groups (Salerno et al. 2020). Quenched BGGs with very old stellar populations formed their stars at least 10 Gyr ago (see Einasto et al. 2022, and references therein). The Horizon Run 5 simulation suggests that in the densest regions of the cosmic web, the birthplaces of the present-day rich galaxy clusters, galaxies may have started to form earlier than elsewhere (Park et al. 2022; Prada et al. 2023). This is also supported by observations of extremely high-redshift galaxies in forming protoclusters (Hashimoto et al. 2023; Labbé et al. 2023). Dekel et al. (2023) proposed that massive very early galaxies may form by feedback-free starbursts,
At cluster scales, our results follow the trend observed in the TNG and SIMBA simulations, where 78% and 91% of the BCGs, respectively, with low and high mass, are quenched (Oppenheimer et al. 2021). At group scales, the quenched fraction drops more in simulations (e.g., in Illustries, C-Eagle, Eagle-Ref, Romulus -C, TNG300) than in observations. The differences between the simulations can be attributed to varying models for the interplay between AGN feedback and cooling procedures. Using the ROMULUS simulations, Jung et al. (2022) state that efficient gas cooling from the CGM is an essential prerequisite for star formation in galaxy groups, while ram-pressure gas stripping from gas-rich satellites significantly supports suitable gas cooling flows. Galaxies in groups are often preprocessed (quenched) before they join the clusters, indicating a large-scale environmental dependence on galaxy properties (Oppenheimer et al. 2021; Einasto et al. 2022).
The differences between the processes in rich clusters and poor groups were also highlighted in Jung et al. (2022). In rich clusters the BGGs lie in the cluster centres and their evolution is affected by mergers, galactic cannibalism, dynamic friction, and other processes that lead to the formation of BGGs with the highest stellar mass and luminosity (see e.g., Marini et al. 2021, for a detailed discussion on the formation of BGGs of rich clusters). In poor groups the velocities of galaxies are low, and the mergers of galaxies and strong tidal interactions are effective (Jung et al. 2022).
7.5. Summary
The results of our study of groups can be summarized as follows.
-
1)
Groups can be divided into two main classes according to their luminosity, minimal global luminosity–density at their location, the star formation properties of their BBGs, and distance from the filament axis. The threshold luminosity of groups between the main classes is Lgr = 15 × 1010 h−2 L⊙; the median mass is
 , being approximately ten times the local MW+M31 group mass. We call these classes clusters and poor groups. Furthermore, clusters can be divided into two subclasses with luminosity limits Lgr ≥ 43 × 1010 h−2 L⊙ and 15 ≤ Lgr < 43 × 1010 h−2 L⊙, and poor groups with luminosity limits 2.5 ≤ Lgr < 15 × 1010 h−2 L⊙ and Lgr ≤ 2.5 × 10¹⁰ h−2 L⊙.
 -
2)
Groups and clusters have BGGs with different star formation properties. While ≈90% of BGGs in clusters are red and quenched with no active star formation, only approximately 40 − 60% of the BGGs in poor groups and of single galaxies are of this type. In poor groups and among single galaxies ≈17% of BGGs are red star-forming galaxies (RSF), and even ≈40% of BGGs are blue star-forming (SF) galaxies. These percentages are the same in a wide range of global luminosity–density.
-
3)
The location of high- and low-luminosity groups in the cosmic web is different. Clusters are absent in regions of low global luminosity–density with D8 ≤ 1.15 (D8 ≤ 2.38 for the richest clusters), and they lie in filaments or filament outskirts, with Dfil ≤ 2.5 Mpc. In contrast, poor groups and single galaxies reside everywhere in the cosmic web, from high-density cores of superclusters to voids.
-
4)
Groups of the same richness in superclusters are more luminous than in low-density regions between superclusers. This difference is the largest at richness Ngal = 10, which is approximately the limiting richness between groups and clusters. Within a given richness class, groups with quenched BGGs have higher luminosity than groups with RSF BGGs, which in turn are more luminous than groups with BSF BGGs.
-
5)
Quenched BGGs are located closer to the group centre than star-forming BGGs. Rich groups and clusters follow the relation between the stellar velocity dispersion of BGGs σ⋆ and the group velocity dispersion σv, similar to that found in simulations.
-
6)
Single galaxies are, on average, fainter and less massive than BGGs of low-luminosity groups, with a large spead in their parameter values. A total of 18% of single galaxies are RSF; this percentage is the same in various global luminosity–density D8 and distance from filaments Dfil intervals. Single galaxies are more luminous in superclusters than in low-density regions.
In summary, we obtained two main classes of galaxy systems: rich groups and clusters with mostly quenched BGGs, and poor groups that may also have star-forming BGGs. The limiting luminosity between these classes is Lgr = 15 × 1010 h−2 L⊙ and mass Mgr ≈ 23 × 1012 h−1 M⊙. Our results suggest that this is a threshold luminosity between rich and poor galaxy systems, which also differ in their BGG properties, dynamical properties, and location in the cosmic web. Rich groups and clusters can only form in high global luminosity–density regions near filaments, and they are dynamically older than poor groups. The poorer the group and the farther it is located from filaments and rich structures (superclusters), the higher the probability that group has a star-forming BGG, either red or blue. Single galaxies and BGGs of low-luminosity groups seem to form a continuous sequence according to their properties, which supports the idea that single galaxies are the brightest galaxies of faint groups. The birth and growth of BGGs in low-luminosity groups is different from the evolution of BGGs of high-luminosity groups. Our study also emphasized the importance of different global environments where the formation and growth of groups is different. Even groups of the same richness are more luminous in global higher density environments than in low-density environments. Thus our study also highlights the role of high-density environments (deep minima of the gravitation potential field) in the formation and evolution of groups and clusters and their BGGs.
To better understand the properties, environments, and possible evolution of groups, especially poor groups, further studies are needed, which also include fainter galaxies than in this study. Many aspects of the present study provide ideas for future works. Among these is to use the data on fainter galaxies, groups, and filaments than in the present study, for example, from the J-PAS survey (Benitez et al. 2014) and especially the forthcoming 4MOST survey (de Jong et al. 2019); 2019Msngr.175...46D; 2023Msngr.190...46T, and data from multiwavelength studies. It would be interesting to analyse how the relation between the stellar velocity dispersion of BGGs and the velocity dispersion of groups and clusters is related to their substructure and connectivity.
Acknowledgments
We thank the referee for valuable comments and suggestions which helped us to improve the paper. We thank Mirt Gramann for useful discussions. We are pleased to thank the SDSS Team for the publicly available data releases. Funding for the Sloan Digital Sky Survey (SDSS) and SDSS-II has been provided by the Alfred P. Sloan Foundation, the Participating Institutions, the National Science Foundation, the US Department of Energy, the National Aeronautics and Space Administration, the Japanese Monbukagakusho, and the Max Planck Society, and the Higher Education Funding Council for England. The SDSS website is http://www.sdss.org/. The SDSS is managed by the Astrophysical Research Consortium (ARC) for the Participating Institutions. The Participating Institutions are the American Museum of Natural History, Astrophysical Institute Potsdam, University of Basel, University of Cambridge, Case Western Reserve University, The University of Chicago, Drexel University, Fermilab, the Institute for Advanced Study, the Japan Participation Group, The Johns Hopkins University, the Joint Institute for Nuclear Astrophysics, the Kavli Institute for Particle Astrophysics and Cosmology, the Korean Scientist Group, the Chinese Academy of Sciences (LAMOST), Los Alamos National Laboratory, the Max-Planck-Institute for Astronomy (MPIA), the Max-Planck-Institute for Astrophysics (MPA), New Mexico State University, Ohio State University, University of Pittsburgh, University of Portsmouth, Princeton University, the United States Naval Observatory, and the University of Washington. The present study was supported by the ETAG projects PRG1006 and PSG700. This work has also been supported by ICRAnet through a professorship for Jaan Einasto. Suvi Korhonen acknowledges support by the Vilho, Yrjö and Kalle Väisälä Foundation. We applied in this study R statistical environment (Ihaka & Gentleman 1996).
References
- Ahn, C. P., Alexandroff, R., Allende Prieto, C., et al. 2014, ApJS, 211, 17 [NASA ADS] [CrossRef] [Google Scholar]
- Aihara, H., Allende Prieto, C., An, D., et al. 2011, ApJS, 193, 29 [NASA ADS] [CrossRef] [Google Scholar]
- Aragon Calvo, M. A., Neyrinck, M. C., & Silk, J. 2019, Open J. Astrophys., 2, 7 [CrossRef] [Google Scholar]
- Bagchi, J., Sankhyayan, S., Sarkar, P., et al. 2017, ApJ, 844, 25 [NASA ADS] [CrossRef] [Google Scholar]
- Balogh, M. L., Morris, S. L., Yee, H. K. C., Carlberg, R. G., & Ellingson, E. 1999, ApJ, 527, 54 [Google Scholar]
- Bell, E. F., Monachesi, A., Harmsen, B., et al. 2017, ApJ, 837, L8 [NASA ADS] [CrossRef] [Google Scholar]
- Belsole, E., Sauvageot, J. L., Pratt, G. W., & Bourdin, H. 2005, AdSpR, 36, 630 [NASA ADS] [Google Scholar]
- Benavides, J. A., Sales, L. V., & Abadi, M. G. 2020, MNRAS, 498, 3852 [Google Scholar]
- Benitez, N., Dupke, R., Moles, M., et al. 2014, arXiv e-prints [arXiv:1403.5237] [Google Scholar]
- Berrier, J. C., Stewart, K. R., Bullock, J. S., et al. 2009, ApJ, 690, 1292 [NASA ADS] [CrossRef] [Google Scholar]
- Beygu, B., Kreckel, K., van der Hulst, J. M., et al. 2016, MNRAS, 458, 394 [NASA ADS] [CrossRef] [Google Scholar]
- Blanton, M. R., Hogg, D. W., Bahcall, N. A., et al. 2003, ApJ, 592, 819 [Google Scholar]
- Blanton, M. R., & Roweis, S. 2007, AJ, 133, 734 [NASA ADS] [CrossRef] [Google Scholar]
- Boselli, A., & Gavazzi, G. 2006, PASP, 118, 517 [Google Scholar]
- Brinchmann, J., Charlot, S., White, S. D. M., et al. 2004, MNRAS, 351, 1151 [Google Scholar]
- Bruzual, G., & Charlot, S. 2003, MNRAS, 344, 1000 [NASA ADS] [CrossRef] [Google Scholar]
- Cappellari, M., & Emsellem, E. 2004, PASP, 116, 138 [Google Scholar]
- Cerulo, P., Orellana, G. A., & Covone, G. 2019, MNRAS, 487, 3759 [Google Scholar]
- Chu, A., Durret, F., & Márquez, I. 2021, A&A, 649, A42 [NASA ADS] [CrossRef] [EDP Sciences] [Google Scholar]
- Contini, E., Gu, Q., Ge, X., et al. 2020, ApJ, 889, 156 [NASA ADS] [CrossRef] [Google Scholar]
- Coziol, R., Andernach, H., Caretta, C. A., Alamo-Martínez, K. A., & Tago, E. 2009, AJ, 137, 4795 [NASA ADS] [CrossRef] [Google Scholar]
- Croton, D. J., Springel, V., White, S. D. M., et al. 2006, MNRAS, 365, 11 [Google Scholar]
- Damsted, S., Finoguenov, A., Clerc, N., et al. 2023, A&A, 676, A127 [NASA ADS] [CrossRef] [EDP Sciences] [Google Scholar]
- Darragh Ford, E., Laigle, C., Gozaliasl, G., et al. 2019, MNRAS, 489, 5695 [Google Scholar]
- de Filippis, E., Schindler, S., & Erben, T. 2005, A&A, 444, 387 [NASA ADS] [CrossRef] [EDP Sciences] [Google Scholar]
- de Jong, R. S., Agertz, O., Berbel, A. A., et al. 2019, The Messenger, 175, 3 [NASA ADS] [Google Scholar]
- Dekel, A., Sarkar, K. C., Birnboim, Y., Mandelker, N., & Li, Z. 2023, MNRAS, 523, 3201 [NASA ADS] [CrossRef] [Google Scholar]
- Di Matteo, P., Haywood, M., Lehnert, M. D., et al. 2019, A&A, 632, A4 [NASA ADS] [CrossRef] [EDP Sciences] [Google Scholar]
- Driver, S. P., Liske, J., Davies, L. J. M., et al. 2019, The Messenger, 175, 46 [NASA ADS] [Google Scholar]
- Dubinski, J. 1998, ApJ, 502, 141 [NASA ADS] [CrossRef] [Google Scholar]
- Duplancic, F., Coldwell, G. V., Alonso, S., & Lambas, D. G. 2018, MNRAS, 481, 2458 [NASA ADS] [CrossRef] [Google Scholar]
- Duplancic, F., Dávila-Kurbán, F., Coldwell, G. V., Alonso, S., & Galdeano, D. 2020, MNRAS, 493, 1818 [CrossRef] [Google Scholar]
- Einasto, J., & Einasto, M. 2000, ASP Conf. Ser., 209, 360 [NASA ADS] [Google Scholar]
- Einasto, J., Jaaniste, J., Jôeveer, M., et al. 1974, Tartu Astrofuusika Observatoorium Teated, 48, 3 [NASA ADS] [Google Scholar]
- Einasto, J., Jõeveer, M., Kaasik, A., & Vennik, J. 1976, A&A, 53, 35 [NASA ADS] [Google Scholar]
- Einasto, M., Einasto, J., Müller, V., Heinämäki, P., & Tucker, D. L. 2003, A&A, 401, 851 [NASA ADS] [CrossRef] [EDP Sciences] [Google Scholar]
- Einasto, M., Suhhonenko, I., Heinämäki, P., Einasto, J., & Saar, E. 2005, A&A, 436, 17 [NASA ADS] [CrossRef] [EDP Sciences] [Google Scholar]
- Einasto, M., Einasto, J., Tago, E., et al. 2007a, A&A, 464, 815 [NASA ADS] [CrossRef] [EDP Sciences] [Google Scholar]
- Einasto, M., Saar, E., Liivamägi, L. J., et al. 2007b, A&A, 476, 697 [NASA ADS] [CrossRef] [EDP Sciences] [Google Scholar]
- Einasto, J., Suhhonenko, I., Hütsi, G., et al. 2011a, A&A, 534, A128 [NASA ADS] [CrossRef] [EDP Sciences] [Google Scholar]
- Einasto, M., Liivamägi, L. J., Tempel, E., et al. 2011b, ApJ, 736, 51 [Google Scholar]
- Einasto, M., Vennik, J., Nurmi, P., et al. 2012, A&A, 540, A123 [NASA ADS] [CrossRef] [EDP Sciences] [Google Scholar]
- Einasto, M., Lietzen, H., Tempel, E., et al. 2014, A&A, 562, A87 [NASA ADS] [CrossRef] [EDP Sciences] [Google Scholar]
- Einasto, M., Lietzen, H., Gramann, M., et al. 2016, A&A, 595, A70 [NASA ADS] [CrossRef] [EDP Sciences] [Google Scholar]
- Einasto, M., Gramann, M., Park, C., et al. 2018, A&A, 620, A149 [NASA ADS] [CrossRef] [EDP Sciences] [Google Scholar]
- Einasto, J., Suhhonenko, I., Liivamägi, L. J., & Einasto, M. 2019, A&A, 623, A97 [NASA ADS] [CrossRef] [EDP Sciences] [Google Scholar]
- Einasto, M., Deshev, B., Tenjes, P., et al. 2020, A&A, 641, A172 [NASA ADS] [CrossRef] [EDP Sciences] [Google Scholar]
- Einasto, J., Klypin, A., Hütsi, G., Liivamägi, L.-J., & Einasto, M. 2021a, A&A, 652, A94 [NASA ADS] [CrossRef] [EDP Sciences] [Google Scholar]
- Einasto, M., Kipper, R., Tenjes, P., et al. 2021b, A&A, 649, A51 [NASA ADS] [CrossRef] [EDP Sciences] [Google Scholar]
- Einasto, M., Kipper, R., Tenjes, P., et al. 2022, A&A, 668, A69 [NASA ADS] [CrossRef] [EDP Sciences] [Google Scholar]
- Einasto, J., Hütsi, G., Liivamägi, L.-J., et al. 2023, MNRAS, 523, 4693 [NASA ADS] [CrossRef] [Google Scholar]
- Fraley, C., & Raftery, A. E. 2006, Technical Report, Dep. of Statistics, University of Washington, 504, 1 [Google Scholar]
- Galárraga-Espinosa, D., Langer, M., & Aghanim, N. 2022, A&A, 661, A115 [NASA ADS] [CrossRef] [EDP Sciences] [Google Scholar]
- Gao, L., White, S. D. M., Jenkins, A., Frenk, C. S., & Springel, V. 2005, MNRAS, 363, 379 [NASA ADS] [CrossRef] [Google Scholar]
- Gouin, C., Bonnaire, T., & Aghanim, N. 2021, A&A, 651, A56 [NASA ADS] [CrossRef] [EDP Sciences] [Google Scholar]
- Gozaliasl, G., Finoguenov, A., Khosroshahi, H. G., et al. 2016, MNRAS, 458, 2762 [NASA ADS] [CrossRef] [Google Scholar]
- Gozaliasl, G., Finoguenov, A., Khosroshahi, H. G., et al. 2018, MNRAS, 475, 2787 [CrossRef] [Google Scholar]
- Gozaliasl, G., Finoguenov, A., Khosroshahi, H. G., et al. 2020, A&A, 635, A36 [EDP Sciences] [Google Scholar]
- Green, A. W., Glazebrook, K., Gilbank, D. G., et al. 2017, MNRAS, 470, 639 [CrossRef] [Google Scholar]
- Gunn, J. E., Gott, J. R. I. 1972, ApJ, 176, 1 [NASA ADS] [CrossRef] [Google Scholar]
- Haines, C. P., Finoguenov, A., Smith, G. P., et al. 2018, MNRAS, 477, 4931 [Google Scholar]
- Hanami, H., Tsuru, T., Shimasaku, K., et al. 1999, ApJ, 521, 90 [Google Scholar]
- Hashimoto, T., Álvarez Márquez, J., Fudamoto, Y., et al. 2023, ApJ, 955, L2 [NASA ADS] [CrossRef] [Google Scholar]
- Haywood, M., Lehnert, M. D., Di Matteo, P., et al. 2016, A&A, 589, A66 [NASA ADS] [CrossRef] [EDP Sciences] [Google Scholar]
- Henriques, B. M. B., White, S. D. M., Lilly, S. J., et al. 2019, MNRAS, 485, 3446 [CrossRef] [Google Scholar]
- Herzog, G., Benítez-Llambay, A., & Fumagalli, M. 2022, MNRAS, 518, 6305 [NASA ADS] [CrossRef] [Google Scholar]
- Hickson, P. 1982, ApJ, 255, 382 [NASA ADS] [CrossRef] [Google Scholar]
- Huchra, J. P., & Geller, M. J. 1982, ApJ, 257, 423 [NASA ADS] [CrossRef] [Google Scholar]
- Ihaka, R., & Gentleman, R. 1996, J. Comput. Graph. Stat., 5, 299 [Google Scholar]
- Jõeveer, M., Einasto, J., & Tago, E. 1978, MNRAS, 185, 357 [Google Scholar]
- Jaber, M., Peper, M., Hellwing, W. A., Aragon-Calvo, M. A., & Valenzuela, O. 2023, MNRAS, 527, 4087 [NASA ADS] [CrossRef] [Google Scholar]
- Jung, S. L., Rennehan, D., Saeedzadeh, V., et al. 2022, MNRAS, 515, 22 [NASA ADS] [CrossRef] [Google Scholar]
- Kauffmann, G., Heckman, T. M., White, S. D. M., et al. 2003, MNRAS, 341, 33 [Google Scholar]
- Kolcu, T., Crossett, J. P., Bellhouse, C., & McGee, S. 2022, MNRAS, 515, 5877 [CrossRef] [Google Scholar]
- Kolokythas K., & CLoGS Team 2021, in Galaxy Evolution and Feedback across Different Environments, eds. T. Storchi Bergmann, W. Forman, R. Overzier, & R. Riffel, 359, 180 [NASA ADS] [Google Scholar]
- Kolokythas, K., O’Sullivan, E., Raychaudhury, S., et al. 2018, MNRAS, 481, 1550 [NASA ADS] [Google Scholar]
- Kolokythas, K., Vaddi, S., O’Sullivan, E., et al. 2022, MNRAS, 510, 4191 [CrossRef] [Google Scholar]
- Komatsu, E., Smith, K. M., Dunkley, J., et al. 2011, ApJS, 192, 18 [Google Scholar]
- Kuutma, T., Poudel, A., Einasto, M., et al. 2020, A&A, 639, A71 [NASA ADS] [CrossRef] [EDP Sciences] [Google Scholar]
- Labbé, I., van Dokkum, P., Nelson, E., et al. 2023, Nature, 616, 266 [CrossRef] [Google Scholar]
- Lacerna, I., Hernández-Toledo, H. M., Avila-Reese, V., Abonza-Sane, J., & del Olmo, A. 2016, A&A, 588, A79 [NASA ADS] [CrossRef] [EDP Sciences] [Google Scholar]
- Lagos, P., Loubser, S. I., Scott, T. C., et al. 2022, MNRAS, 516, 5487 [NASA ADS] [CrossRef] [Google Scholar]
- Lemos, P., Jeffrey, N., Whiteway, L., et al. 2021, Phys. Rev. D, 103, 023009 [NASA ADS] [CrossRef] [Google Scholar]
- Lietzen, H., Tempel, E., Heinämäki, P., et al. 2012, A&A, 545, A104 [NASA ADS] [CrossRef] [EDP Sciences] [Google Scholar]
- Liivamägi, L. J., Tempel, E., & Saar, E. 2012, A&A, 539, A80 [Google Scholar]
- Lindner, U., Einasto, J., Einasto, M., et al. 1995, A&A, 301, 329 [NASA ADS] [Google Scholar]
- Loubser, S. I., Lagos, P., Babul, A., et al. 2022, MNRAS, 515, 1104 [NASA ADS] [CrossRef] [Google Scholar]
- Maier, C., Ziegler, B. L., Haines, C. P., & Smith, G. P. 2019, A&A, 621, A131 [NASA ADS] [CrossRef] [EDP Sciences] [Google Scholar]
- Malumuth, E. M. 1992, ApJ, 386, 420 [NASA ADS] [CrossRef] [Google Scholar]
- Marini, I., Borgani, S., Saro, A., et al. 2021, MNRAS, 507, 5780 [NASA ADS] [CrossRef] [Google Scholar]
- Masters, K. L., Mosleh, M., Romer, A. K., et al. 2010, MNRAS, 405, 783 [NASA ADS] [Google Scholar]
- Matteucci, F., Panagia, N., Pipino, A., et al. 2006, MNRAS, 372, 265 [NASA ADS] [CrossRef] [Google Scholar]
- Mazzei, P., Rampazzo, R., Marino, A., et al. 2022, ApJ, 927, 124 [NASA ADS] [CrossRef] [Google Scholar]
- McGee, S. L., Balogh, M. L., Bower, R. G., Font, A. S., & McCarthy, I. G. 2009, MNRAS, 400, 937 [Google Scholar]
- Merritt, D. 1984, ApJ, 276, 26 [NASA ADS] [CrossRef] [Google Scholar]
- Momose, R., Lee, K. G., Horowitz, B., Ata, M., & Kartaltepe, J. S. 2022, ApJ, submitted [arXiv:2212.05984] [Google Scholar]
- Moore, B., Katz, N., Lake, G., Dressler, A., & Oemler, A. 1996, Nature, 379, 613 [Google Scholar]
- Nulsen, P. E. J. 1982, MNRAS, 198, 1007 [Google Scholar]
- Oppenheimer, B. D., Babul, A., Bahé, Y., Butsky, I. S., & McCarthy, I. G. 2021, Universe, 7, 209 [NASA ADS] [CrossRef] [Google Scholar]
- Orellana-González, G., Cerulo, P., Covone, G., et al. 2022, MNRAS, 512, 2758 [CrossRef] [Google Scholar]
- Ostriker, J. P., & Tremaine, S. D. 1975, ApJ, 202, L113 [NASA ADS] [CrossRef] [Google Scholar]
- O’Sullivan, E., Ponman, T. J., Kolokythas, K., et al. 2017, MNRAS, 472, 1482 [CrossRef] [Google Scholar]
- O’Sullivan, E., Combes, F., Salomé, P., et al. 2018, A&A, 618, A126 [NASA ADS] [CrossRef] [EDP Sciences] [Google Scholar]
- Park, C., Lee, J., Kim, J., et al. 2022, ApJ, 937, 15 [NASA ADS] [CrossRef] [Google Scholar]
- Pasquali, A., Smith, R., Gallazzi, A., et al. 2019, MNRAS, 484, 1702 [Google Scholar]
- Patel, S. G., Kelson, D. D., Abramson, L. E., Sattari, Z., & Lorenz, B. 2023, ApJ, 945, 93 [NASA ADS] [CrossRef] [Google Scholar]
- Paulino-Afonso, A., Sobral, D., Darvish, B., et al. 2020, A&A, 633, A70 [NASA ADS] [CrossRef] [EDP Sciences] [Google Scholar]
- Peebles, P. J. E. 2021, arXiv e-prints [arXiv:2106.02672] [Google Scholar]
- Poudel, A., Heinämäki, P., Tempel, E., et al. 2017, A&A, 597, A86 [NASA ADS] [CrossRef] [EDP Sciences] [Google Scholar]
- Prada, F., Behroozi, P., Ishiyama, T., Klypin, A., & Pérez, E. 2023, Nature, submitted [arXiv:2304.11911] [Google Scholar]
- Quilley, L., & de Lapparent, V. 2022, A&A, 666, A170 [NASA ADS] [CrossRef] [EDP Sciences] [Google Scholar]
- Reed, D. S., Bower, R., Frenk, C. S., et al. 2005, MNRAS, 363, 393 [NASA ADS] [CrossRef] [Google Scholar]
- Repp, A., & Szapudi, I. 2019, arXiv e-prints [arXiv:1904.05048] [Google Scholar]
- Ribeiro, A. L. B., de Carvalho, R. R., Trevisan, M., et al. 2013, MNRAS, 434, 784 [NASA ADS] [CrossRef] [Google Scholar]
- Saeedzadeh, V., Jung, S. L., Rennehan, D., et al. 2023, MNRAS, 525, 5677 [NASA ADS] [CrossRef] [Google Scholar]
- Salerno, J. M., Martínez, H. J., Muriel, H., et al. 2020, MNRAS, 493, 4950 [Google Scholar]
- Salim, S., Rich, R. M., Charlot, S., et al. 2007, ApJS, 173, 267 [NASA ADS] [CrossRef] [Google Scholar]
- Sankhyayan, S., Bagchi, J., Tempel, E., et al. 2023, ApJ, 958, 62 [NASA ADS] [CrossRef] [Google Scholar]
- Sarkar, S., Pandey, B., & Das, A. 2022, J. Cosmol. Astropart. Phys., 2022, 024 [CrossRef] [Google Scholar]
- Sarzi, M., Falcón-Barroso, J., Davies, R. L., et al. 2006, MNRAS, 366, 1151 [Google Scholar]
- Schawinski, K., Urry, C. M., Simmons, B. D., et al. 2014, MNRAS, 440, 889 [Google Scholar]
- Smith, R., Hwang, H. S., Kraljic, K., et al. 2023, MNRAS, 525, 4685 [NASA ADS] [CrossRef] [Google Scholar]
- Sohn, J., Geller, M. J., Diaferio, A., & Rines, K. J. 2020, ApJ, 891, 129 [NASA ADS] [CrossRef] [Google Scholar]
- Sohn, J., Geller, M. J., Vogelsberger, M., & Borrow, J. 2022, ApJ, 938, 3 [NASA ADS] [CrossRef] [Google Scholar]
- Suhhonenko, I., Einasto, J., Liivamägi, L. J., et al. 2011, A&A, 531, A149 [NASA ADS] [CrossRef] [EDP Sciences] [Google Scholar]
- Sulentic, J. W., Verdes-Montenegro, L., Bergond, G., et al. 2006, A&A, 449, 937 [NASA ADS] [CrossRef] [EDP Sciences] [Google Scholar]
- Tacchella, S., Forbes, J. C., & Caplar, N. 2020, MNRAS, 497, 698 [Google Scholar]
- Taylor, E. N., Cluver, M., Bell, E., et al. 2023, The Messenger, 190, 46 [NASA ADS] [Google Scholar]
- Tempel, E., Stoica, R. S., Martínez, V. J., et al. 2014a, MNRAS, 438, 3465 [CrossRef] [Google Scholar]
- Tempel, E., Tamm, A., Gramann, M., et al. 2014b, A&A, 566, A1 [NASA ADS] [CrossRef] [EDP Sciences] [Google Scholar]
- Tempel, E., Stoica, R. S., Kipper, R., & Saar, E. 2016, Astron. Comput., 16, 17 [NASA ADS] [CrossRef] [Google Scholar]
- Tremonti, C. A., Heckman, T. M., Kauffmann, G., et al. 2004, ApJ, 613, 898 [Google Scholar]
- Tully, R. B. 2015, AJ, 149, 54 [NASA ADS] [CrossRef] [Google Scholar]
- Tully, R. B., Courtois, H., Hoffman, Y., & Pomarède, D. 2014, Nature, 513, 71 [Google Scholar]
- Tuominen, T., Nevalainen, J., Tempel, E., et al. 2021, A&A, 646, A156 [EDP Sciences] [Google Scholar]
- Vulcani, B., Poggianti, B. M., Moretti, A., et al. 2021, ApJ, 914, 27 [NASA ADS] [CrossRef] [Google Scholar]
- Werner, S. V., Hatch, N., Muzzin, A., et al. 2021, Galaxy Cluster Formation II, 20 [Google Scholar]
- Winkel, N., Pasquali, A., Kraljic, K., et al. 2021, MNRAS, 505, 4920 [CrossRef] [Google Scholar]
- Yun, K., Pillepich, A., Zinger, E., et al. 2019, MNRAS, 483, 1042 [Google Scholar]
- Zeldovich, I. B., Einasto, J., & Shandarin, S. F. 1982, Nature, 300, 407 [Google Scholar]
- Zhu, J., Tonnesen, S., & Bryan, G. L. 2024, ApJ, 960, 54 [NASA ADS] [CrossRef] [Google Scholar]
All Tables
Median values of the distances from the nearest filament axis, Dfil, for filaments with length L ≥ 3 Mpc.
Groups and their BGGs in filaments, in filament outskirts, and far from filaments.
All Figures
|
Fig. 1. Weights used to correct for unobserved group members outside the observational luminosity window vs. distance of groups. |
| In the text | |
|
Fig. 2. Luminosity of groups vs distance for redshift range 0.03 ≤ z ≤ 0.08. The red line shows the adopted luminosity limit, Lgr = 1.2 × 10¹⁰ h−2 L⊙, for a complete sample of groups. To make the figure file smaller, only one-quarter of all the groups, randomly chosen, are plotted. |
| In the text | |
|
Fig. 3. Sky distribution of groups of different richness. The symbol sizes are proportional to the richness of the groups. Red denotes groups with Lgr ≥ 43 × 1010 h−2 L⊙, orange groups with Lgr = 15 − 43 × 1010 h−2 L⊙; green groups with Lgr = 2.5 − 15 × 1010 h−2 L⊙, and blue groups with Lgr ≤ 2.5 × 10¹⁰ h−2 L⊙. Shown are the Abell numbers for A2055 in the Hercules supercluster and for A1185 in the Leo supercluster. |
| In the text | |
|
Fig. 4. Distribution of stellar masses, log M⋆, for the BGGs and satellite galaxies in faint groups with Lgr ≤ 2.5 × 10¹⁰ h−2 L⊙. The solid line correspond to BGGs and the dashed line to satellite galaxies in faint groups. |
| In the text | |
|
Fig. 5. Luminosity of groups vs global luminosity–density D8. The horizontal lines indicate the group luminosities |
| In the text | |
|
Fig. 6. Luminosity of groups vs. group richness. The colours denote groups in various global density D8 regions, as shown in the figure. The horizontal lines are as in Fig. 5. |
| In the text | |
|
Fig. 7. Luminosity of groups vs. star formation rate, logSFR. The horizontal lines are as in Fig. 5. The vertical line shows the star formation rate limit for star-forming and quenched galaxies, logSFR = −0.5. Only one-quarter of all the groups, randomly chosen, are shown. |
| In the text | |
|
Fig. 8. Percentages of groups with BGGs of different star formation properties vs. group luminosity for groups from different luminosity classes and for single galaxies (S), as shown in the figure. The red line shows the percentages of quenched BGGs and the dark red dashed line shows the percentages of RSF BGGs. The blue line shows the percentages of BSF BGGs. The dotted, dashed, and dot-dashed lines show the changes in percentages if SFR limits logSFR = −0.6 and logSFR = −0.4 were used. The LL2.5 group sample in this figure is a test sample, to which is added 10% of randomly chosen single galaxies. |
| In the text | |
|
Fig. 9. Properties of BGGs and single galaxies. Left panel: stellar mass log M⋆ vs. Dn(4000) index. Middle panel: (g − r)0 colour index vs. absolute magnitude in r colour (colour–magnitude relation). Right panel: star formation rate logSFR vs. (g − r)0 colour index. The line colours correspond to groups of different luminosity and to single galaxies, as shown in the panels. The horizontal line in the left panel separates quenched and star-forming galaxies at Dn(4000) = 1.55. In the middle and right panels the horizontal line shows the division between red and blue galaxies at (g − r)0 = 0.7. The vertical line in the right panel shows the separation of quenched and star-forming galaxies at logSFR = −0.5. |
| In the text | |
|
Fig. 10. Global density D8 vs. distance from the nearest filament axis Dfil for groups (left panel) and for single galaxies (right panel). The colours denote groups in four luminosity classes. The horizontal lines indicate global luminosity–density limits D8 = 1.15, D8 = 2.38, D8 = 5.0, and D8 = 7.0. The vertical lines show the characteristic distances from the nearest filament axis, Dfil = 0.5 Mpc and Dfil = 2.5 Mpc. |
| In the text | |
|
Fig. 11. Cumulative distribution of global luminosity–density at the location of groups. The line colours correspond to the luminosity classes, as shown in the figure. The vertical lines indicate the global luminosity–density limits D8 = 1.15, D8 = 2.38, D8 = 5.0, and D8 = 7.0. |
| In the text | |
|
Fig. 12. Cumulative distributions of distances of groups from the nearest filament axis for groups of different luminosity. The line colours correspond to the luminosity classes, as shown in the figure. The vertical lines show the characteristic distances from the nearest filament axis, Dfil = 0.5 Mpc and Dfil = 2.5 Mpc. |
| In the text | |
|
Fig. 13. Cumulative distributions of group luminosities in high and low global luminosity–density regions for groups with Ngal = 5 with different BGGs (left panel) and for groups with Ngal = 10 (right panel). The line colours correspond to groups with different BGGs in high- and low-density environments, as shown in the figure. |
| In the text | |
|
Fig. 14. Cumulative distributions of luminosities of single galaxies Mr in high and low global luminosity–density regions. Luminosity–density limits are shows in each panel. |
| In the text | |
|
Fig. 15. BGG location with respect to the cluster centre (sample HL15). Left panel: normalized line-of-sight velocity, Vpec, n. Right panel: normalized distance from the cluster centre on the sky plane, Dcen, n. The line colours correspond to clusters with different BGGs, as shown in the panels. The red line denotes clusters with quenched (Q) BGGs, the dark red line denotes clusters with RSF BGGs, and the blue line denotes clusters with BSF BGGs. |
| In the text | |
|
Fig. 16. BGG stellar velocity dispersion σ* vs. group velocity dispersion σv. The symbol colours correspond to groups of different luminosity, as shown in the panels. The line correspond to σ* = σv. |
| In the text | |
|
Fig. 17. Cluster velocity dispersion σv vs. global luminosity–density at the location of clusters, separately for clusters with BGGs of different star formation properties, as shown in the plot. Horizontal lines mark global luminosity–density limits D8 = 2.38, D8 = 5.0, and D8 = 7.0. |
| In the text | |
|
Fig. 18. Cluster velocity dispersion σv vs. the distance from filament axis, separately for clusters with BGGs of different star formation properties, as shown in the plot. The horizontal lines show characteristic distances from the nearest filament axis, Dfil = 0.5 Mpc and Dfil = 2.5 Mpc. |
| In the text | |
|
Fig. 19. Distribution of stellar masses, log M⋆, for the BGGs in groups of various luminosity, and for single galaxies. |
| In the text | |
Current usage metrics show cumulative count of Article Views (full-text article views including HTML views, PDF and ePub downloads, according to the available data) and Abstracts Views on Vision4Press platform.
Data correspond to usage on the plateform after 2015. The current usage metrics is available 48-96 hours after online publication and is updated daily on week days.
Initial download of the metrics may take a while.