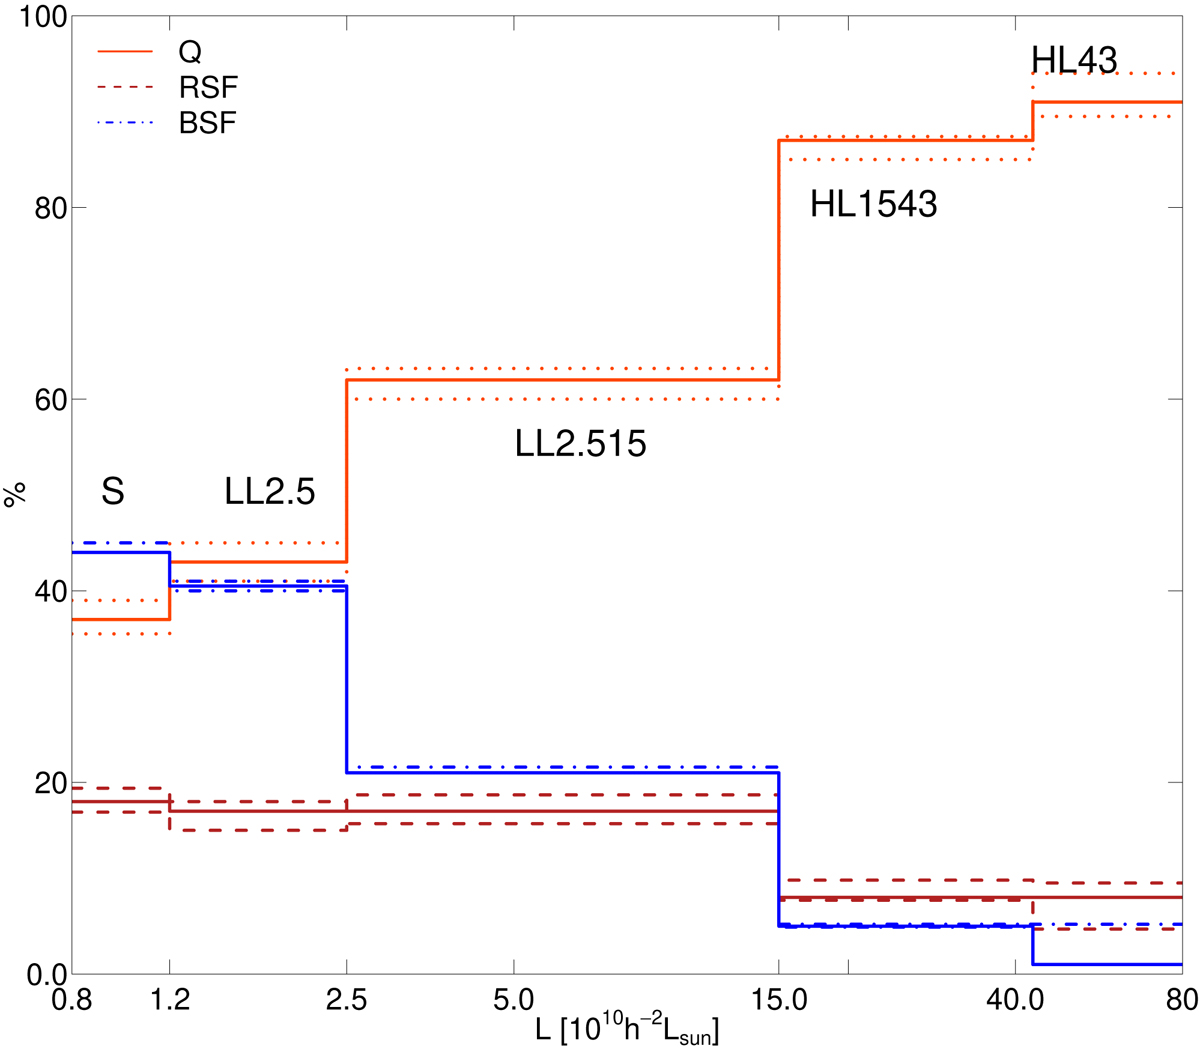
Fig. 8.
Download original image
Percentages of groups with BGGs of different star formation properties vs. group luminosity for groups from different luminosity classes and for single galaxies (S), as shown in the figure. The red line shows the percentages of quenched BGGs and the dark red dashed line shows the percentages of RSF BGGs. The blue line shows the percentages of BSF BGGs. The dotted, dashed, and dot-dashed lines show the changes in percentages if SFR limits logSFR = −0.6 and logSFR = −0.4 were used. The LL2.5 group sample in this figure is a test sample, to which is added 10% of randomly chosen single galaxies.
Current usage metrics show cumulative count of Article Views (full-text article views including HTML views, PDF and ePub downloads, according to the available data) and Abstracts Views on Vision4Press platform.
Data correspond to usage on the plateform after 2015. The current usage metrics is available 48-96 hours after online publication and is updated daily on week days.
Initial download of the metrics may take a while.