Fig. 9.
Download original image
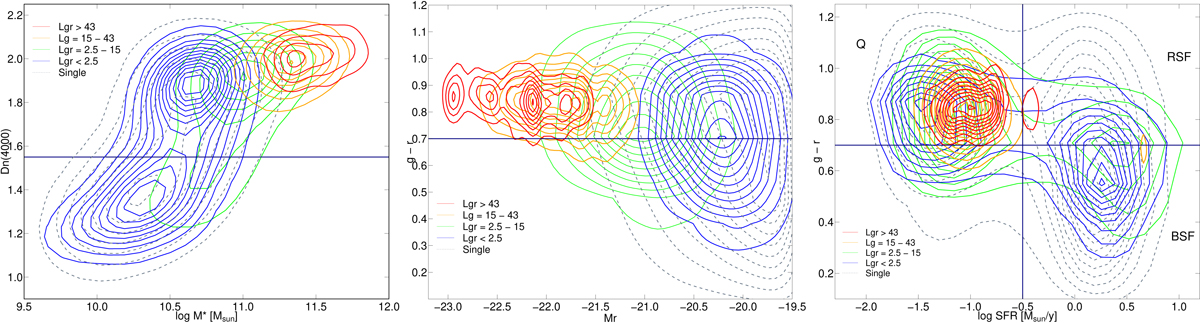
Properties of BGGs and single galaxies. Left panel: stellar mass log M⋆ vs. Dn(4000) index. Middle panel: (g − r)0 colour index vs. absolute magnitude in r colour (colour–magnitude relation). Right panel: star formation rate logSFR vs. (g − r)0 colour index. The line colours correspond to groups of different luminosity and to single galaxies, as shown in the panels. The horizontal line in the left panel separates quenched and star-forming galaxies at Dn(4000) = 1.55. In the middle and right panels the horizontal line shows the division between red and blue galaxies at (g − r)0 = 0.7. The vertical line in the right panel shows the separation of quenched and star-forming galaxies at logSFR = −0.5.
Current usage metrics show cumulative count of Article Views (full-text article views including HTML views, PDF and ePub downloads, according to the available data) and Abstracts Views on Vision4Press platform.
Data correspond to usage on the plateform after 2015. The current usage metrics is available 48-96 hours after online publication and is updated daily on week days.
Initial download of the metrics may take a while.