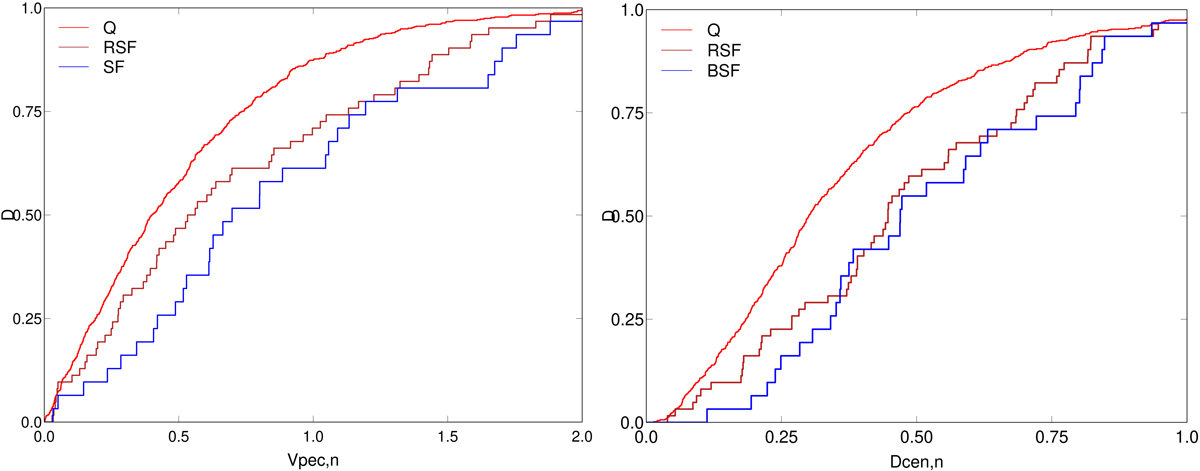
Fig. 15.
Download original image
BGG location with respect to the cluster centre (sample HL15). Left panel: normalized line-of-sight velocity, Vpec, n. Right panel: normalized distance from the cluster centre on the sky plane, Dcen, n. The line colours correspond to clusters with different BGGs, as shown in the panels. The red line denotes clusters with quenched (Q) BGGs, the dark red line denotes clusters with RSF BGGs, and the blue line denotes clusters with BSF BGGs.
Current usage metrics show cumulative count of Article Views (full-text article views including HTML views, PDF and ePub downloads, according to the available data) and Abstracts Views on Vision4Press platform.
Data correspond to usage on the plateform after 2015. The current usage metrics is available 48-96 hours after online publication and is updated daily on week days.
Initial download of the metrics may take a while.