Open Access
Fig. 12.
Download original image
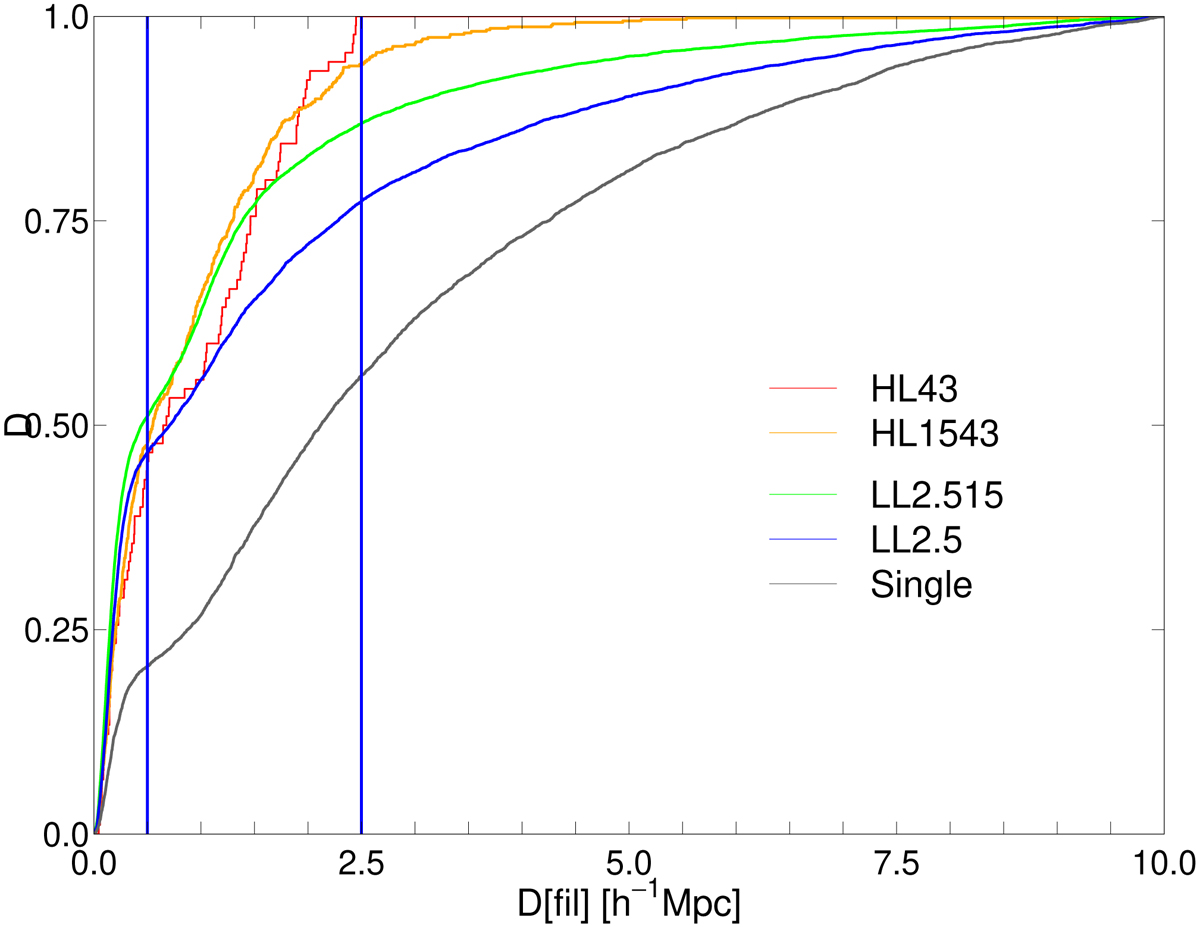
Cumulative distributions of distances of groups from the nearest filament axis for groups of different luminosity. The line colours correspond to the luminosity classes, as shown in the figure. The vertical lines show the characteristic distances from the nearest filament axis, Dfil = 0.5 Mpc and Dfil = 2.5 Mpc.
Current usage metrics show cumulative count of Article Views (full-text article views including HTML views, PDF and ePub downloads, according to the available data) and Abstracts Views on Vision4Press platform.
Data correspond to usage on the plateform after 2015. The current usage metrics is available 48-96 hours after online publication and is updated daily on week days.
Initial download of the metrics may take a while.