| Issue |
A&A
Volume 678, October 2023
|
|
|---|---|---|
| Article Number | A112 | |
| Number of page(s) | 10 | |
| Section | Interstellar and circumstellar matter | |
| DOI | https://doi.org/10.1051/0004-6361/202347348 | |
| Published online | 13 October 2023 | |
Interaction of H2S with H atoms on grain surfaces under molecular cloud conditions
Laboratory for Astrophysics, Leiden Observatory, Leiden University,
PO Box 9513,
2300
RA Leiden,
The Netherlands
e-mail: This email address is being protected from spambots. You need JavaScript enabled to view it.
Received:
3
July
2023
Accepted:
14
August
2023
Abstract
Context. Hydrogen sulfide (H2S) is thought to be efficiently formed on grain surfaces through the successive hydrogenation of sulfur atoms. Its non-detection so far in astronomical observations of icy dust mantles thus indicates that effective destruction pathways must play a significant role in its interstellar abundance. While chemical desorption has been shown to remove H2S very efficiently from the solid phase, in line with H2S gas-phase detections, possible ice chemistry triggered by the related HS radical have been largely disregarded so far, despite it being an essential intermediate in the H2S + H reaction scheme.
Aims. We aim to thoroughly investigate the fate of H2S upon H-atom impact under molecular cloud conditions, providing a comprehensive analysis combined with detailed quantification of both the chemical desorption and ice chemistry that ensues.
Methods. We performed experiments in an ultrahigh vacuum chamber at temperatures between 10 and 16 K in order to investigate the reactions between H2S molecules and H atoms on interstellar ice analogs. The changes in the solid phase during H-atom bombardment were monitored in situ by means of reflection absorption infrared spectroscopy (RAIRS), and desorbed species were complementarily measured with a quadrupole mass spectrometer (QMS).
Results. We confirmed the formation of H2S2 via reactions involving H2S + H and quantified its formation cross section under the employed experimental conditions. Additionally, we directly assessed the chemical desorption of H2S by measuring the gas-phase desorption signals with the QMS, providing unambiguous desorption cross sections. Chemical desorption of H2S2 was not observed. The relative decrease of H2S ices by chemical desorption changed from ~85% to ~74% between temperatures of 10 and 16 K, while the decrease as the result of H2S2 formation was enhanced from ~15% to ~26%, suggesting an increasingly relevant sulfur chemistry induced by HS radicals at warmer environments. The astronomical implications are further discussed.
Key words: astrochemistry / methods: laboratory: solid state / infrared: ISM / ISM: molecules
© The Authors 2023
 Open Access article, published by EDP Sciences, under the terms of the Creative Commons Attribution License (https://creativecommons.org/licenses/by/4.0), which permits unrestricted use, distribution, and reproduction in any medium, provided the original work is properly cited.
This article is published in open access under the Subscribe to Open model. This email address is being protected from spambots. You need JavaScript enabled to view it. to support open access publication.
1 Introduction
Interstellar dense clouds are known for harboring a lavish chemical inventory spanning from simple ions and radicals to a large variety of complex organic molecules (COMs). At the temperatures and densities typical of these environments (T = 10–20 K and ρ = 104–105 cm−3, respectively; van Dishoeck et al. 2013), thermal desorption cannot take place, and most species – except for H2 and He – should be fully depleted into interstellar icy dust grains (Collings et al. 2004). Yet, observations with radio-astronomical facilities have detected copious amounts of COMs such as methanol (CH3OH), acetaldehyde (CH3CHO), methyl formate (CH3OCHO), among others, in the gas phase toward dense and cold clouds (see, e.g., Öberg et al. 2010; Bacmann et al. 2012; Cernicharo et al. 2012; Jiménez-Serra et al. 2016; Scibelli & Shirley 2020). Especially given that these hydrogen-rich species are most likely formed in the ice mantles that shroud interstellar dust grains, such observations reveal that non-thermal desorption mechanisms must play a significant role in balancing gas- and solid-phase chemical abundances. For smaller species, such as CO, photodesorption induced by UV photons through the (in-)direct desorption induced by electronic transitions (DIET) mechanism is an efficient desorption process that could explain, in part, the observed abundances of gaseous species (Öberg et al. 2007; Muñoz Caro et al. 2010; Fayolle et al. 2011; Chen et al. 2014; Paardekooper et al. 2016; Sie et al. 2022). However, larger molecules are increasingly susceptible to fragmentation upon UV photon impact, which can then be followed by photochemical desorption (Bertin et al. 2016; Cruz-Diaz et al. 2016). Moreover, recent studies have shown that the photodes-orption of CO and CH3OH ices induced by IR photons might be astronomically relevant (Santos et al. 2023), shedding light on potential new processes to help explain gas-phase abundances of COMs.
Complementarily, another promising non-thermal desorption mechanism that proceeds without fragmentation is the so-called chemical desorption, or reactive desorption. This phenomenon involves the ejection of products upon formation in an exothermic reaction. It has been consistently shown to improve gas-phase abundances predicted by chemical models (Garrod et al. 2006, 2007; Cazaux et al. 2010; Vasyunin & Herbst 2013; Vidal et al. 2017; Cuppen et al. 2017; Fredon et al. 2021) and has been explored in the laboratory for a range of astronomically relevant species and substrates (Dulieu et al. 2013; Minissale & Dulieu 2014; Minissale et al. 2016; He et al. 2017; Chuang et al. 2018; Oba et al. 2018, 2019; Nguyen et al. 2020, 2021). Yet, efforts to experimentally quantify chemical desorption efficiencies are still limited, and modelers typically assume a universal input value between 0.01 and 0.1 (Garrod et al. 2007; Cuppen et al. 2017).
Among the species whose observed abundances cannot be explained by gas-phase processes alone, hydrogen sulfide (H2S) is perhaps one of the most broadly studied in the recent literature. It has been detected toward various interstellar sources and in the comae of comets (Thaddeus et al. 1972; Minh et al. 1989; van Dishoeck et al. 1995; Hatchell et al. 1998; Vastel et al. 2003; Wakelam et al. 2004; Neufeld et al. 2015; Le Roy et al. 2015; Biver et al. 2015; Calmonte et al. 2016; Phuong et al. 2018; Navarro-Almaida et al. 2020). It was also tentatively identified on the surface of the Galilean satellites Io, Ganymede, and Callisto (Nash & Howell 1989; McCord et al. 1998). However, solid-phase interstellar H2S has not been unequivocally detected yet, and only upper limits are available in ices so far (Smith 1991; van der Tak et al. 2003; Jiménez-Escobar & Muñoz Caro 2011).
The main proposed route to form H2S is through the successive hydrogenation of sulfur on icy grains ( ). Once formed, H2S can undergo an H-induced abstraction reaction to form the radical HS
 (1)
(1)
by quantum tunneling through an effective barrier of ~1500 K (Lamberts & Kästner 2017). The HS radical can subsequently be hydrogenated to reform H2S. Alternatively, H2S can also be energetically processed to form species such as H2S2 and a wide range of S allotropes (Moore et al. 2007; Garozzo et al. 2010; Jiménez-Escobar & Muñoz Caro 2011; Jiménez-Escobar et al. 2014; Chen et al. 2015; Shingledecker et al. 2020; Cazaux et al. 2022; Mifsud et al. 2022).
Laboratory studies have reported the hydrogenation of a thin layer (0.7 monolayers; ML) of H2S on top of both porous and non-porous amorphous solid water as well as on top of polycrystalline water ice (Oba et al. 2018, 2019). The experimental data has demonstrated that the excess energy generated by the cycle of H-induced abstraction and H2S reformation results in chemical desorption with high effectiveness. Kinetic Monte Carlo simulations of such experiments suggest the chemical desorption efficiency to be of ~3% per hydrogenation event (Furuya et al. 2022). Contrary to energetically processed ices, however, new species formed by the HS radicals were not reported – possibly due to the relatively low abundance of H2S species in their experiments. In this work, we aim to further constrain the chemical desorption efficiency of H2S by incorporating the chemistry involving HS radicals resulting from the (de-)hydrogenation of hydrogen sulfide, in particular to form disulfane (H2S2). Moreover, for the first time, we present a comprehensive experimental analysis of the H2S chemical desorption phenomenon supported by a strong gas-solid correlation using infrared spectroscopy and mass spectrometry techniques concomitantly.
The experimental setup and techniques employed are described in Sect. 2. The results are shown and discussed in Sect. 3, where we provide effective cross sections for the chemical desorption of H2S and H2S2 formation. In Sect. 4, the astrochemical implications of this work are considered, and our main findings are summarized in Sect. 5.
2 Experimental methods
We performed our experiments using the ultrahigh vacuum setup SURFRESIDE3, which has been described in detail elsewhere (Ioppolo et al. 2013; Qasim et al. 2020). Thus, we only provide the relevant information in this work. The main chamber operates at a base pressure of ~5 × 10⁻¹⁰ mbar. In its center is a gold-plated copper substrate mounted on the tip of a closed cycle He cryostat. The temperature of the substrate can vary between 8 and 450 K through resistive heating and is monitored by two silicon diode sensors with a relative accuracy of 0.5 K. Ices of H2S (Linde, purity 99.5%) are deposited either prior to or simultaneously with H atoms generated by a hydrogen atom beam source (HABS; Tschersich 2000) during what is referred to in this work as pre- and codeposition experiments, respectively. The hydrogen atoms are cooled to room temperature through collision with a nose-shaped quartz pipe before reaching the substrate. As described in detail by Ioppolo et al. (2013), the determination of the absolute H-atom flux is done by placing a quadrupole mass spectrometer (QMS) at the exact position of the substrate and monitoring its signal in a series of systematic experiments with varying filament temperatures and inlet gas flow. Such a measurement is not a trivial procedure, but it serves as a reference guide for regular calibrations of the relative H flux at different operation conditions through the HO2 peak intensity formed in the barrierless reaction H + O2 → HO2. To infer the temperature-dependent kinetics of the processes explored in this work, we performed predeposition experiments at a range of temperatures of relevance to interstellar molecular clouds (10, 12, 14, and 16 K). Due to its low sticking coefficient at the studied temperatures, the presence of H2 molecules on the ice (either incoming from the atom source or formed through H recombination) was not expected to significantly affect the outcome of our experiments (Watanabe & Kouchi 2002; Ioppolo et al. 2010).
Ice growth through vapor deposition is monitored by Fourier-transform reflection-absorption infrared spectroscopy (FT-RAIRS). The IR spectra are acquired in the range of 700–4000 cm−1, with a resolution of 1 cm−1. Concurrently, species in the gas phase are ionized upon electron impact with 70 eV and recorded by a QMS. Once the depositions are finished, temperature-programmed desorption (TPD) experiments are performed by heating the sample at a ramping rate of 5 K min−1 while concomitantly monitoring the solid and gas phases with the RAIRS and QMS techniques, respectively.
The column densities (NX) of the species in the ice are derived by converting the IR integrated absorbance (∫ Abs(v)dv) to absolute abundance using a modified Beer-Lambert law:
 (2)
(2)
where A′(X) is the apparent absorption band strength of a given species. For H2S, band strength values measured by infrared transmission spectroscopy are available in the literature. However, signals obtained in reflection mode are systematically higher than transmission counterparts due to substrate dipole couplings and a typically longer IR pathway in the ice. Thus, to ensure high accuracy in the derivation of the H2S ice column density, we performed calibration experiments using the laser interference technique that yield a band strength value of A′(H2S)~2553 cm−ı ~ (4.7 ± 0.1) × 10−17 cm molecule−1 for our specific experimental settings (see Appendix A).
Since direct determination of the H2S2 band strength is challenging, we estimate A′(H2S2) in a similar way to what has been described by Cazaux et al. (2022). The column density ratio  can be derived from the QMS data by the expression (Martín-Doménech et al. 2015)
![Mathematical equation: $ {{{N_{{{\rm{H}}_{\rm{2}}}{{\rm{S}}_{\rm{2}}}}}} \over {{N_{{{\rm{H}}_{\rm{2}}}{\rm{S}}}}}} = {{A\left( {66} \right)} \over {A\left( {34} \right)}} \cdot {{{\sigma ^ + }\left( {{{\rm{H}}_{\rm{2}}}{\rm{S}}} \right)} \over {{\sigma ^ + }\left( {{{\rm{H}}_{\rm{2}}}{{\rm{S}}_{\rm{2}}}} \right)}} \cdot {{{I_F}\left( {{{\left[ {{{\rm{H}}_{\rm{2}}}{\rm{S}}} \right]}^ + }} \right)} \over {{I_F}\left( {{{\left[ {{{\rm{H}}_{\rm{2}}}{{\rm{S}}_{\rm{2}}}} \right]}^ + }} \right)}} \cdot {{{F_F}\left( {34} \right)} \over {{F_F}\left( {66} \right)}} \cdot {{S\left( {34} \right)} \over {S\left( {66} \right)}}, $](/articles/aa/full_html/2023/10/aa47348-23/aa47348-23-eq5.png) (3)
(3)
where A(m/z) is the integrated area of a given mass fragment; σ+(X) is the molecule’s electronic ionization cross section; IF(z) is the ionization fraction of charge z (in this work, corresponding to unity); Ff(m/z) is the fragmentation fraction; and S (m/z) is the sensitivity of the QMS at a specific mass. As there are no values for σ+(H2S2) reported in the literature, we estimated its value based on the molecule’s polarizability volume (α(X)) by the empirical correlation (Hudson et al. 2006; Bull et al. 2012):
 (4)
(4)
where X denotes a given species and c is a correlation constant of 1.48 Å−1. The maximum ionization cross section ( ) of organic species typically occurs around 90 eV and varies only slightly (< 5%) in intensity from ionizations with 70 eV (Hudson et al. 2003; Bull & Harland 2008). Thus, we utilized this method to derive both σ+(H2S2) and σ+(H2S) from α(H2S2) and α(H2S) as calculated by group additivity1. The Ff(m/z) of the relevant mass fragments are inferred from the QMS data acquired during the TPD experiments after codeposition of H2S and H, and we obtained the sensitivity from previous calibrations performed with the same setup (Chuang 2018). The employed values are summarized in Table 1.
By combining  from Eq. (3) and
  from Eq. (2), one can obtain
  , which in turn can be used to estimate A′(H2S2) from the integrated absorbance area of the IR spectra:
 (5)
(5)
The average between two independent experiments yields an estimated A′(H2S2)~2490 cm−1 ~ (9.9 ± 0.2) × 10−17 cm molecule−1.
The details of the experiments performed in this work are summarized in Table 2. The relative errors of both H2S and H fluxes are estimated to be ~5%.
List of parameters used in the estimation of A′(H2S2).
3 Results and discussion
3.1 H2S + H ice chemistry
The left panel of Fig. 1 shows the spectra obtained after deposition of pure H2S and codeposition of H2S + H at 10 K in the frequency region characteristic of SH stretching modes. A strong IR feature is observed at ~2553 cm−1, corresponding to the v1 (symmetric) and v3 (anti-symmetric) SH stretching modes of H2S. In comparison, when H atoms are also present, a new feature peaking at ~2490 cm−1 appears on the red wing of the v1,3 mode of H2S – consistent with the SH stretching band (v1, sym.; and v5, anti-sym.) of H2S2 (Isoniemi et al. 1999). During the TPD experiment performed after codepositing H2S + H, the main bands at ~2553 cm−1 and ~2490 cm−1 fully disappear in the temperature ranges of 10–100 K and 100–140 K, respectively (Fig. 1, right panel), which coincides with previously measured desorption temperatures of H2S and H2S2 (Jiménez-Escobar & Muñoz Caro 2011; Chen et al. 2015; Cazaux et al. 2022).
The assignments of H2S and H2S2 are substantiated by their respective mass fragments induced by electron impact during the TPD experiments in Figs. 2 and 3, respectively. As shown in Fig. 2a, a desorption peak of fragments m/z = 32 and 34 can be observed at ~85 K in both H2S and H2S + H cases, amounting to relative intensities consistent with the standard for H2S as provided by the NIST database2. This desorption temperature matches the disappearance of the ~2553 cm−1 bands in the IR spectra. In Fig. 3, the desorption peak of the mass fragments associated with H2S2 is detected solely in the H2S + H experiment at 126 K – coinciding with the disappearance of the feature at ~2490 cm−1 in the IR spectra. Thus, the assignment of the new peak as H2S2 is confirmed by both RAIRS and QMS techniques combined with TPD experiments. Given the lack of laboratory data on its mass fragmentation pattern, we provide for the first time – to the best of our knowledge – the relative intensities of m/z = 32, 34, 64, 65, and 66 as generated by 70 eV electron ionization of H2S2 and corrected for the sensitivity of the QMS in the right panel of Fig. 3. The contribution from the 34S isotope (natural abundance of 4.29%) is included in the fragmentation pattern.
When H2S is deposited simultaneously with H atoms, HS radicals formed by the hydrogen abstraction of H2S (Reaction (1)) can thus further associate either with H atoms, reforming H2S, or with HS radicals, forming H2S2:
 (6a)
(6a)
 (6b)
(6b)
Reaction (6a) proceeds barrierlessly and can result in chemical desorption due to its high exothermicity (~45 000 K, based on the gas-phase enthalpies of formation of reactants and products). Reaction (6b) is also barrierless and has been proposed in previous studies on the energetic processing of H2S-containing ices (Jiménez-Escobar & Muñoz Caro 2011; Jiménez-Escobar et al. 2014; Chen et al. 2015; Cazaux et al. 2022; Mifsud et al. 2022).
Overview of the experiments performed in this work.
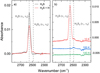 |
Fig. 1 Infrared spectra of the codeposition experiments. Panel a: comparison between the final infrared spectra after deposition of a pure H2S ice (black) superimposed by the final spectrum after codeposition of H2S and H atoms (red) with analogous experimental conditions. Panel b: infrared spectra acquired during the warming up of the H2S ice codeposited with H atoms, offset for clarity. In both panels, the assignments of the H2S and H2S2 vibrational bands are shown with dashed lines. |
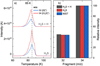 |
Fig. 2 TPD-QMS results for the detection of H2S. Panel a: TPD-QMS spectra of m/z = 32 (blue) and m/z = 34 (red) after deposition of a pure H2S ice and codeposition of H2S + H with analogous experimental conditions. Spectra are offset for clarity and shown in the temperature range relevant to H2S thermal desorption. Panel b: Comparison between the relative intensities of m/z = 32 and 34 desorbing at 85 K in both H2S and H2S + H experiments together with the standard fragmentation pattern of H2S from NIST. |
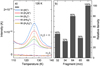 |
Fig. 3 TPD-QMS results for the detections of H2S2. Panel a: TPD-QMS spectra of m/z = 32 (blue), 34 (red), 64 (green), 65 (purple), and 66 (yellow) after deposition of apure H2S ice and codeposition of H2S + H with analogous experimental conditions. Spectra are offset for clarity and shown in the temperature range relevant to H2S2 thermal desorption. Panel b: mass fragmentation pattern of H2S2 generated by 70 eV electron ionization as measured in this work. |
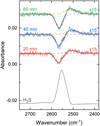 |
Fig. 4 Infrared spectrum after deposition of a pure H2S ice (black) and the difference spectra after exposure to H atoms for 20 min (red), 40 min (blue), and 60 min (green). Superimposed onto the difference spectra are the corresponding Gaussian fittings of the H2S band (purple), H2S2 band (yellow), and the resulting convoluted feature (brown). The spectra have been offset for clarity. |
3.2 H-atom bombardment on H2S ice
The left panels in Figs. 1 and 2 show that the amount of H2S ice after the codeposition experiment with H atoms is smaller than that of the pure ice deposition with the same experimental conditions, thus signaling that the interaction of H2S with hydrogen leads to a net loss of material as a result of both Reactions (6a) and (6b). While the efficiency of the former reaction has been explored in detail (Oba et al. 2018, 2019; Furuya et al. 2022), the contribution from H2S2 formation to depleting H2S from the solid phase has not been considered so far. In this work, we explore the effectiveness of both reactions thoroughly and assess their respective relevance to the destruction of the H2S ice.
To quantify the efficiencies of Reactions (6a) and (6b), we monitored the abundance of H2S and H2S2 as a function of H-atom fluence during predeposition experiments in which a deposited H2S ice was subsequently bombarded by a constant H-atom flux. The difference spectra after the H-atom bombardment for 20, 40, and 60 min at 10 K together with the pure H2S sample prior to hydrogenation are shown in Fig. 4. Both H2S and H2S2 features can be resolved in the difference spectra by deconvolution using Gaussian profiles, as shown by the superimposing lines. The interaction with H atoms leads to a loss of H2S, as evinced by the decrease in its SH stretching band at ~2553 cm−1 (purple dashed line). Concomitantly, a feature due to the SH stretching modes of H2S2 appears on the red wing of the H2S band and becomes increasingly evident at longer H-atom exposure times (yellow dashed line). The results of the predeposition experiments are therefore consistent with the codeposition counterparts, and they indicate a non-negligible contribution to the H2S depletion from Reaction (6b). In contrast, neither Oba et al. (2018) nor Oba et al. (2019) have detected any other sulfur-bearing species apart from hydrogen sulfide during similar H2S → +H predepositions at 10–30K followed by TPD experiments. Such a discrepancy might be due to the limited abundance of H2S in the aforementioned works (0.7 ML) compared to the present experiments (~40 ML), as they might not yield product amounts above the instrumental detection limit.
To directly probe the chemical desorption of H2S as a result of reactions with H atoms, we monitored the gas-phase signals via the relevant mass fragments (m/z = 34, [H2S]+; m/z = 33, [HS]+) with a QMS during the H-exposure experiments. In Fig. 5, data acquired by both the RAIRS and QMS techniques while intermittently bombarding the predeposited H2S ice with H atoms (i.e., in three intervals of 20min, ending with 60min) are presented in the upper and lower panels, respectively. In the first 20 min of bombardment, we observed a steep decrease in the H2S IR absorbance area coinciding with an abrupt increase in the m/z = 34 readout by the QMS. Once bombardment was stopped, the area of the H2S band remained fairly constant, and the QMS signal dropped to the base value. Such results provide unambiguous evidence of the effective chemical desorption of H2S upon H-atom exposure. Following the first bombardment, a similar behavior was observed through both RAIRS and QMS techniques for the rest of the exposure periods, albeit to a diminishing extent of H2S loss due to saturation of the ice layer within the penetration depth of the hydrogen atoms – typically of a few monolayers (see, e.g., Watanabe & Kouchi 2008; Fuchs et al. 2009). No increase in signal was detected for m/z = 66 ([H2S2]+), indicating that relative to H2S, disulfane does not undergo chemical desorption effectively upon formation. This is quite expected, as H2S2 contains more degrees of freedom and, as inferred from its higher desorption temperature, a higher binding energy than H2S. Consequently, H2S2 does not contribute significantly to the measurement of m/z = 34 during H-atom exposure, which can therefore be solely attributed to H2S.
We measured the intensity of the m/z = 33 signal relative to m/z = 34 to be ~0.55 throughout the H-atom exposure, whereas the expected fragmentation pattern of H2S corresponds to 33/34 ~ 0.42. The excess of [HS]+ fragments detected during the bombardment is consistent with the transfer of HS radicals to the gas phase through chemical desorption as a result of Reaction (1). This fraction, however, is significantly smaller than the detected gaseous H2S and could therefore be neglected. Indeed, due to the high exothermicity of Reaction (6a) and the fact that its excess energy is concentrated in a single product, we expected H2S to be the most susceptible species to chemical desorption during the hydrogenation sequence – as was also suggested by Oba et al. (2018).
In addition to experiments at 10 K, we performed predeposition experiments with analogous conditions at 12 K, 14 K, and 16 K in order to investigate the effects of different temperatures on H2S2 formation and H2S chemical desorption. The percentage of H2S lost either to chemical desorption or H2S2 formation by the end of the predeposition experiments can be derived by comparing the final ΔN of both species, assuming that other potential processes have a minor contribution in decreasing the H2S band. The derived efficiencies are temperature dependent, as shown in Fig. 6; the overall H2S loss due to chemical desorption varies from ~85% to ~74% when the ice temperature increases from 10 K to 16 K. Accordingly, the percentage loss due to the formation of H2S2 varies from ~15% to ~26%. We note that these values are respective to the relative H2S loss at each specific temperature and are not the absolute amount of formed H2S2 or chemically desorbed H2S in each experiment. At higher temperatures, the fraction of H2S consumed to form H2S2 increases relatively to the loss due to chemical desorption, suggesting that the former process becomes increasingly relevant in warmer environments. This observation is possibly related to a significant increase in diffusion rates of HS radicals enhancing the overall H2S2 formation at the expense of chemical desorption by H2S reformation. In summary, by taking into account this chemical loss channel, it is possible to further constrain the fate of H2S molecules upon H-atom bombardment, thus expanding the results from previous works in which H2S2 formation was not observed.
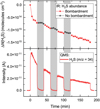 |
Fig. 5 Monitoring of H2S in the solid and gas phases during H-atom bombardment. Upper panel: variation in H2S column density measured from the ~2553 cm−1 band in the IR spectra as a function of time. Lower panel: scan of the m/z = 34 ([H2S]+) as measured by the QMS as a function of time. The shadowed areas denote the periods during which the H-atom flux was stopped. |
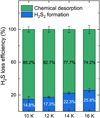 |
Fig. 6 Derived contributions from H2S2 formation and H2S chemical desorption to the measured loss in N(H2S) after 120 min of H-atom exposure at 10, 12, 14, and 16 K. |
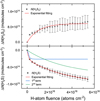 |
Fig. 7 Column densities of H2S and H2S2 in the ice during H-atom bombadrment. Upper panel: variation in H2S2 column density during H-atom exposure of an H2S ice at 10 K. Lower panel: variation in H2S column density as a function of H-atom fluence during bombardment of an H2S ice at 10 K. The two-term exponential fitting to the points is shown in red, while the fast and slow components of the fitting are plotted in blue and green, respectively. |
3.3 Kinetic analysis
Information on the kinetics of H2S2 formation and H2S consumption can be derived from predeposition experiments. In the upper panel of Fig. 7, the variation in column density (ΔN) of H2S2 as a function of H-atom fluence measured from the IR spectra at 10 K is shown. The curve is fitted by a single exponential function:
![Mathematical equation: $ {\rm{\Delta }}{\left[ X \right]_t} = {\left[ {{{\rm{H}}_2}{\rm{S}}} \right]_0} \cdot a\left( {1 - \exp \left( { - \sigma \cdot F} \right)} \right), $](/articles/aa/full_html/2023/10/aa47348-23/aa47348-23-eq14.png) (7)
(7)
where Δ[X] and [H2S]0 are, respectively, the abundance of species X at a given time and the initial abundance of H2S. Here, a is the saturation value, F is the incident H-atom fluence, and σ is the effective formation cross section of H2S2. From this fitting, we derived σ ~ (9.8 ± 0.9) × 10−17 cm2 for H2S2 formation at 10 K. We note, however, that the rate law of H2S2 formation is far from trivial, as both Reactions (1) and (6b) contribute to the effective cross section, with the latter requiring two HS radicals to occur. Therefore, it cannot be simplified by the pseudo firstorder approximation. Moreover, the accurate amount of H atoms available on the surface of the ice is very difficult to quantify, as a fraction will recombine to form H2 – hence the use of the “effective” term. The σ value derived here is thus not suited to be directly employed in chemical models as a rate constant, but it is very useful for comparison purposes with other effective cross sections derived with similar conditions.
In the lower panel of Fig. 7, the effective variation in the column density of H2S as a function of H-atom fluence measured from the infrared spectra is shown. In this case, the plot is better fitted by a two-term exponential function:
![Mathematical equation: $ {\rm{\Delta }}{\left[ {{{\rm{H}}_2}{\rm{S}}} \right]_t} = {\left[ {{{\rm{H}}_2}{\rm{S}}} \right]_0}\left( {{a_1}\left( {1 - \exp \left( { - {\sigma _1} \cdot F} \right)} \right) + {a_2}\left( {1 - \exp \left( { - {\sigma _2} \cdot F} \right)} \right)} \right), $](/articles/aa/full_html/2023/10/aa47348-23/aa47348-23-eq15.png) (8)
(8)
where an is the saturation value and σn is the effective destruction cross section. The interpretation of such a fitting is not straightforward, as it incorporates the contribution from all the processes leading to a decrease in N(H2S). Nonetheless, the double exponential fitting suggests that the processes dominating the observed decrease in N(H2S) can be separated into two different timescales with σ1 ~ 10−16 cm2 and σ2 ~ 10−17 cm2.
The fast process with σ1 ~ 10−16 cm2 is likely due to startup effects, such as collision-induced desorption of the weakly bound topmost molecules (Chuang et al. 2018). Accordingly, the effective destruction cross section of H2S can be approximated as the second exponential term with σ2 ~ 10−17 cm2. Control experiments with neutral helium bombardment of H2S ices show that material loss due to collisional impact should account for ≲10% of the total H2S desorption from the QMS. In comparison, the saturation point of the fast exponential curve (blue line in the lower panel of Fig. 7) corresponds to ~0.3 of the total loss of H2S and should thus be regarded as an upper limit to the real value.
Given that the interaction of H2S with H atoms mostly results in chemical desorption via Reaction (6a) and H2S2 formation via Reaction (6b), it is possible to isolate the H2S chemical desorption curve by subtracting the minimum amount of H2S consumed to form H2S2 (i.e., twice the column density of H2S2). The resulting isolated H2S chemical desorption curve is shown in the upper panel of Fig. 8 and yields an effective cross section of σ ~ (1.7 ± 0.2) × 10−17 cm2. We emphasize, however, that this value was derived using a series of assumptions and is therefore only a rough estimation.
In addition to the IR approach, it is possible to directly probe the chemical desorption of hydrogen sulfide by utilizing mass spectrometry data acquired during hydrogen exposure. The lower panel of Fig. 8 shows the integrated signal for the m/z = 34 ([H2S]+) fragment as a function of H-atom fluence (i.e., the area of the plot in the lower panel of Fig. 5). Similar to H2S2, this curve can be fitted by an exponential function as described in Eq. (7), yielding σ ~ (3.7 ± 0.3) × 10−17 cm2, which is quite compatible with the IR approach. Assuming similar chemical desorption efficiencies for both 32S and 34S isotopes of H2S, the contribution from [34S]+ to m/z = 34 does not affect the exponential factor in the fitting and can therefore be neglected. We find it important to note that the cross section from the QMS data is likely more accurate than the IR counterpart, as the former is a direct fitting of the measurements, whereas the latter involves a number of presumptions. Both values are similar to the chemical desorption cross sections of (2.1 ± 0.2) × 10−17 cm2 derived by Oba et al. (2019) from the exposure of H2S ice to H atoms at 10 K and reinforce the relevance of H2S chemical desorption to interstellar gas-grain chemistry. Small discrepancies between the two studies are expected due to the different experimental conditions, such as ice thicknesses, growth surfaces, and H-atom fluxes.
We performed similar experiments at 12, 14, and 16 K, and the derived effective cross sections are summarized in Table 3. The estimated σ(H2S2) values suggest that the effectiveness of H2S2 formation remains fairly consistent (within the uncertainty range) for temperatures between 10 K and 14 K. At 16 K, the cross section is slightly reduced. This behavior is likely the outcome of competing elementary processes involved in synthesizing H2S2 on ice. While diffusion can be facilitated at higher temperatures, thus enhancing encounters between two HS radicals and favoring Reaction (6b), the sticking coefficient of H atoms on ices diminishes, thus hindering the formation of reactants in the first place. Moreover, faster diffusion rates also imply that H atoms might not have enough available time in the vicinity of an H2S molecule to overcome the ~ 1500 K barrier in Reaction (1). Similar findings were described in other H-atom addition experiments (e.g., in the hydrogenation of O2; Ioppolo et al. 2008, 2010; Cuppen et al. 2010).
We obtained the effective cross sections of H2S chemical desorption from the QMS data, and they show a slight decreasing trend between the temperatures of 10, 12, 14, and 16 K. A similar behavior was also observed by Oba et al. (2019) with measurements at 10, 20, and 30 K, which they attributed to the combination of the H atom availability at T ⩾ 20 K and the true efficiency of H2S chemical desorption at higher temperatures. The slightly lower effective cross sections, they argue, would in reality indicate an increase of the true value at warmer environments, balancing out the considerably diminishing sticking coefficient of H. In the present work, we probe a much smaller temperature range where the availability of H atoms on the surface is not expected to drop as significantly. Nonetheless, some effect of the smaller sticking coefficient of hydrogen at higher temperatures could in principle influence the measured effective cross sections – albeit to a smaller extent than in Oba et al. (2019). Although speculating the effect of the ice temperature on the real σCD(H2S) is challenging, it seems as though a measurable change occurs only from 10 K to 12 K within the range explored in this work.
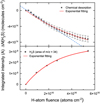 |
Fig. 8 Chemical desorption curves for H2S as a function of H-atom fluence. Upper panel: estimated contribution from chemical desorption to the decrease in N(H2S) as a function of fluence. The simple exponential fitting to the points is shown in red, and the linear fitting to the first 55 min of bombardment is shown in blue (dashed line). Lower panel: integrated intensity of the m/z = 34 signal measured by the QMS as a function of H-atom fluence during the same experiment. The red line shows the exponential fitting to the points. |
Effective cross sections of H2S2 formation (σ(H2S2)) and H2S chemical desorption (σCD(H2S)) derived from the predeposition experiments performed at 10, 12, 14, and 16 K.
4 Astrophysical implications
Hydrogen sulfide is thought to be efficiently formed on the surface of interstellar dust through the hydrogenation of S atoms (see, e.g., Tielens & Hagen 1982; Laas & Caselli 2019). It is also the major sulfur-bearing species found in the comae of comets (Calmonte et al. 2016 and references therein), which in turn are thought to harbor the content of prestellar ices. The (so far) nondetection of solid-phase H2S in interstellar clouds thus poses a question regarding the fate of H2S in interstellar icy mantles. One likely explanation for its absence in observations is that solid-phase H2S is effectively destroyed by, for instance, energetic processing, which is known to result in solid-phase sulfur chemistry (e.g., Moore et al. 2007; Garozzo et al. 2010; Jiménez-Escobar & Muñoz Caro 2011; Jiménez-Escobar et al. 2014; Chen et al. 2015; Shingledecker et al. 2020; Cazaux et al. 2022; Mifsud et al. 2022). In fact, the photochemistry of H2S induced by UV photons has been suggested as a potential sulfur sink, as it has been shown to produce allotropic forms of S (Sn) that are largely refractory (especially for n > 4). In addition to energetic processing, non-energetic routes to remove H2S from the solid phase are also essential, as they are the dominant processes taking place within dense clouds. Indeed, recent observations with the James Webb Space Telescope aimed at highly shielded regions within interstellar clouds (with AV > 50) have still been unable to detect H2S ices, providing only upper limits of 0.6% with respect to H2O (McClure et al. 2023). Especially in such environments, chemical desorption due to hydrogenation seems to be a particularly prominent mechanism to transfer H2S to the gas phase (Oba et al. 2018, 2019). In this work, the cross sections derived directly from the chemically desorbed H2S as measured by the QMS – and thus not influenced by additional H2S destruction phenomena such as chemical reactions – is fully in line with this proposition.
Another relevant value that can be derived from predeposition experiments is the efficiency of chemical desorption per incident H atom. The reason for deriving a value per incident atom instead of per reactive event is because the true value of H atoms involved in the reactions under our experimental conditions is unknown, as a fraction of them will recombine into H2 molecules through diffusion. The efficiency derived per incident atom can therefore be regarded as a lower limit to the value per reaction event. After isolating the variation in the H2S column density due to chemical desorption (as described in Sect. 3.3; see also Fig. 8), a linear fit to the points within the first 55 min of bombardment at 10 K (blue dashed line in the lower panel of Fig. 8) yielded an efficiency of ~0.019 ± 0.001, which is around four times higher than the values reported by Oba et al. (2018, 2019) and consistent with the calculated value per reaction event (i.e., (3 ± 1.5)%) in Furuya et al. (2022). Similar to the cross sections, such a discrepancy could be due to the different ice compositions (pure H2S versus H2S on top of amorphous solid water) and thicknesses (~40 ML versus 0.7 ML). Nonetheless, this estimated efficiency reinforces the key role of H2S chemical desorption as a non-thermal mechanism of transferring hydrogen sulfide to the gas phase within dark clouds. Indeed, by combining gas-grain chemical models with millimeter observations, Navarro-Almaida et al. (2020) found that chemical desorption is the main mechanism responsible for gas-phase H2S formation.
Complementary to chemical desorption, the interaction of H2S with H atoms can also kick-start non-energetic chemistry to form larger sulfur-bearing molecules. The detection of H2S2 under our experimental conditions is one example of how HS radicals produced by Reaction (1) can lead to a higher sulfur-bearing chemical complexity. In fully representative interstellar ices, the probability of two HS radicals meeting is rather low, given the small abundance of H2S relative to other ice components, such as H2O or CO. However, these radicals can react with more widespread ice species, potentially leading to the formation of sulfur-bearing COMs. This present work therefore serves as a proof of concept that non-energetic sulfur chemistry can be initiated by the formation of HS radicals through Reaction (1) with the simplest example of H2S2. We find that it is also noteworthy that the contributions from each process to the consumption of H2S varies significantly with temperature, with an appreciable increase in sulfur-bearing species formed at 16 K compared to 10 K. This is likely due to the enhanced radical diffusion within warmer ices and signifies that sulfur chemistry could be significantly intensified at regions closer to the edges of dark clouds – where temperatures can approach 20 K.
5 Conclusions
In the present work, we experimentally investigated the interaction of H2S ices with H atoms under ultrahigh vacuum pressures and astronomically relevant temperatures (10–16 K). Our main findings are summarized below:
We verified that solid-phase hydrogen sulfide is destroyed and H2S2 is formed as a result of the interaction between H2S and H atoms.
The chemical desorption of H2S was directly probed by quantifying the material ejected into the gas phase during H-atom exposure experiments. The calculated effective cross sections for ice temperatures of 10, 12, 14, and 16 K are, respectively, (3.7 ± 0.3) × 10−17 cm2, (2.8 ± 0.1) × 10−17 cm2, (2.7 ± 0.2) × 10−17 cm2, and (2.6 ± 0.2) × 10−17 cm2.
From the RAIRS data, we estimate the chemical desorption efficiency per incident H atom at 10 K to be ~0.019 ± 0.001.
The derived values for the effective chemical desorption cross sections and efficiency per incident H strengthen the argument that H2S ice is effectively transferred to the gas phase through the excess energy generated by reactions with hydrogen atoms.
The confirmation of H2S2 formation as a result of HS radical recombination proves that non-energetic sulfurchemistry can take place at temperatures as low as 10 K through radical-radical reactions, which could potentially lead to the formation of sulfur-bearing COMs in more representative interstellar ice mixtures.
We derived the effective formation cross sections for H2S2 of (9.8 ± 0.9) × 10−17 cm2, (7.8 ± 0.9) × 10−17 cm2, (8.3 ± 0.7) × 10−17 cm2, and (5.2 ± 0.6) × 10−17 cm2 at 10, 12, 14, and 16 K, respectively.
No chemical desorption was observed upon formation of H2S2 above the current detection limit.
Approximately 85% to 74% of the H2S ice destruction observed under our experimental conditions can be associated with chemical desorption, whereas ~15% to 26% is due to H2S2 formation. The relative consumption of H2S by the latter process grows with temperature, implying that sulfur chemistry induced by HS radicals becomes increasingly more relevant in warmer environments.
Acknowledgements
This work has been supported by the Danish National Research Foundation through the Center of Excellence “InterCat” (Grant agreement no.: DNRF150); the Netherlands Research School for Astronomy (NOVA); and the Dutch Astrochemistry Network II (DANII). K.J.C. is grateful for support from NWO via a VENI fellowship (VI.Veni.212.296).
Appendix A Determination of IR band strengths
The derivation of A′(H2S) for our specific experimental settings was performed in a manner similar to what was described by Chuang et al. (2018). Infrared spectra are acquired during deposition of an H2S ice at 10 K while simultaneously measuring the interference pattern of a HeNe laser that hits the ice sample at an incident angle of ~1.7º. The thickness of the ice (dX) is derived from the laser fringe pattern by the equation (Hollenberg & Dows 1961; Westley et al. 1998):
 (A.1)
(A.1)
where k is the number of fringes, λ is the laser wavelength (i.e., 632.8 nm), nX is the refractive index of the ice species, and θf is the angle of refraction in degrees. From the thickness measurements, it is possible to derive the absolute column density of the ice by the equation:
 (A.2)
(A.2)
where ρX is the density in grams per cubic centimeter, Na is the Avogadro’s constant, and MX is the molar mass of a given species.
In the left panel of Fig. A.1, the HeNe laser interference pattern is shown as a function of time and fit with a sinusoidal function. This pattern arises from the growing H2S ice being deposited on the sample. The corresponding increase in the IR absorption area of the SH stretching mode of H2S (i.e., ~2553 cm−1) as a function of ice column density is shown in the right panel of Fig. A.1. A linear fit to the points yields a band strength value in reflection mode and is specific to our experimental setup of A′(H2S)~2553 cm−1 ~ (4.7 ± 0.1) × 10−17 cm molecule−1. For this calculation, we utilized ρ = 0.944 ± 0.005 g cm−3 and n = 1.407 ± 0.005, as reported by Yarnall & Hudson (2022).
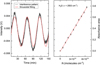 |
Fig. A.1 Derivation of A′(H2S). Left panel: HeNe laser interference pattern obtained from the growing H2S ice at 10 K (black) together with its sinusoidal fitting (red). Changes in the amplitude of the fringes are attributed to laser instabilities. Right panel: Integrated absorbance area of the SH stretching mode of H2S as a function of column density as derived from the fringe patter. A linear fit to the points is also shown in red. |
References
- Bacmann, A., Taquet, V., Faure, A., Kahane, C., & Ceccarelli, C. 2012, A&A, 541, A12 [NASA ADS] [CrossRef] [EDP Sciences] [Google Scholar]
- Bertin, M., Romanzin, C., Doronin, M., et al. 2016, ApJ, 817, L12 [NASA ADS] [CrossRef] [Google Scholar]
- Biver, N., Bockelée-Morvan, D., Moreno, R., et al. 2015, Sci. Adv., 1, 1500863 [NASA ADS] [CrossRef] [Google Scholar]
- Bull, J. N., & Harland, P. W. 2008, Int. J. Mass Spectrom., 273, 53 [NASA ADS] [CrossRef] [Google Scholar]
- Bull, J. N., Harland, P. W., & Vallance, C. 2012, J. Phys. Chem. A, 116, 767 [NASA ADS] [CrossRef] [Google Scholar]
- Calmonte, U., Altwegg, K., Balsiger, H., et al. 2016, MNRAS, 462, S253 [NASA ADS] [CrossRef] [Google Scholar]
- Cazaux, S., Cobut, V., Marseille, M., Spaans, M., & Caselli, P. 2010, A&A, 522, A74 [NASA ADS] [CrossRef] [EDP Sciences] [Google Scholar]
- Cazaux, S., Carrascosa, H., Muñoz Caro, G. M., et al. 2022, A&A, 657, A100 [NASA ADS] [CrossRef] [EDP Sciences] [Google Scholar]
- Cernicharo, J., Marcelino, N., Roueff, E., et al. 2012, ApJ, 759, A43 [Google Scholar]
- Chen, Y. J., Chuang, K. J., Muñoz Caro, G. M., et al. 2014, ApJ, 781, 15 [Google Scholar]
- Chen, Y. J., Juang, K. J., Nuevo, M., et al. 2015, ApJ, 798, 80 [Google Scholar]
- Chuang, K.-J. 2018, Ph.D. Thesis, University of Leiden, The Netherlands [Google Scholar]
- Chuang, K. J., Fedoseev, G., Qasim, D., et al. 2018, ApJ, 853, 102 [NASA ADS] [CrossRef] [Google Scholar]
- Collings, M. P., Anderson, M. A., Chen, R., et al. 2004, MNRAS, 354, 1133 [NASA ADS] [CrossRef] [Google Scholar]
- Cruz-Diaz, G. A., Martín-Doménech, R., Muñoz Caro, G. M., & Chen, Y. J. 2016, A&A, 592, A68 [NASA ADS] [CrossRef] [EDP Sciences] [Google Scholar]
- Cuppen, H., Ioppolo, S., Romanzin, C., & Linnartz, H. 2010, Phys. Chem. Chem. Phys., 12, 12077 [NASA ADS] [CrossRef] [Google Scholar]
- Cuppen, H. M., Walsh, C., Lamberts, T., et al. 2017, Space Sci. Rev., 212, 1 [Google Scholar]
- Dulieu, F., Congiu, E., Noble, J., et al. 2013, Sci. Rep., 3, 1338 [Google Scholar]
- Fayolle, E. C., Bertin, M., Romanzin, C., et al. 2011, ApJ, 739, L36 [Google Scholar]
- Fredon, A., Radchenko, A. K., & Cuppen, H. M. 2021, Acc. Chem. Res., 54, 745 [CrossRef] [Google Scholar]
- Fuchs, G. W., Cuppen, H. M., Ioppolo, S., et al. 2009, A&A, 505, 629 [NASA ADS] [CrossRef] [EDP Sciences] [Google Scholar]
- Furuya, K., Oba, Y., & Shimonishi, T. 2022, ApJ, 926, 171 [NASA ADS] [CrossRef] [Google Scholar]
- Garozzo, M., Fulvio, D., Kanuchova, Z., Palumbo, M. E., & Strazzulla, G. 2010, A&A, 509, A67 [NASA ADS] [CrossRef] [EDP Sciences] [Google Scholar]
- Garrod, R., Park, I. H., Caselli, P., & Herbst, E. 2006, Faraday Discuss., 133, 51 [Google Scholar]
- Garrod, R. T., Wakelam, V., & Herbst, E. 2007, A&A, 467, 1103 [NASA ADS] [CrossRef] [EDP Sciences] [Google Scholar]
- Hatchell, J., Thompson, M. A., Millar, T. J., & MacDonald, G. H. 1998, A&A, 338, 713 [Google Scholar]
- He, J., Emtiaz, S. M., & Vidali, G. 2017, ApJ, 851, 104 [NASA ADS] [CrossRef] [Google Scholar]
- Hollenberg, J. L., & Dows, D. A. 1961, J. Chem. Phys., 34, 1061 [NASA ADS] [CrossRef] [Google Scholar]
- Hudson, J. E., Hamilton, M. L., Vallance, C., & Harland, P. W. 2003, Phys. Chem. Chem. Phys., 5, 3162 [Google Scholar]
- Hudson, J. E., Weng, Z. F., Vallance, C., & Harland, P. W. 2006, Int. J. Mass Spectrom., 248, 42 [NASA ADS] [CrossRef] [Google Scholar]
- Ioppolo, S., Cuppen, H. M., Romanzin, C., van Dishoeck, E. F., & Linnartz, H. 2008, ApJ, 686, 1474 [NASA ADS] [CrossRef] [Google Scholar]
- Ioppolo, S., Cuppen, H. M., Romanzin, C., van Dishoeck, E. F., & Linnartz, H. 2010, Phys. Chem. Chem. Phys., 12, 12065 [Google Scholar]
- Ioppolo, S., Fedoseev, G., Lamberts, T., Romanzin, C., & Linnartz, H. 2013, Rev. Sci. Instrum., 84, 073112 [NASA ADS] [CrossRef] [Google Scholar]
- Isoniemi, E., Pettersson, M., Khriachtchev, L., Lundell, J., & Räsänen, M. 1999, J. Phys. Chem. A, 103, 679 [Google Scholar]
- Jiménez-Escobar, A., & Muñoz Caro, G. M. 2011, A&A, 536, A91 [Google Scholar]
- Jiménez-Escobar, A., Muñoz Caro, G. M., & Chen, Y. J. 2014, MNRAS, 443, 343 [Google Scholar]
- Jiménez-Serra, I., Vasyunin, A. I., Caselli, P., et al. 2016, ApJ, 830, L6 [Google Scholar]
- Laas, J. C., & Caselli, P. 2019, A&A, 624, A108 [NASA ADS] [CrossRef] [EDP Sciences] [Google Scholar]
- Lamberts, T., & Kästner, J. 2017, J. Phys. Chem. A, 121, 9736 [Google Scholar]
- Le Roy, L., Altwegg, K., Balsiger, H., et al. 2015, A&A, 583, A1 [NASA ADS] [CrossRef] [EDP Sciences] [Google Scholar]
- Martín-Doménech, R., Manzano-Santamaría, J., Muñoz Caro, G. M., et al. 2015, A&A, 584, A14 [NASA ADS] [CrossRef] [EDP Sciences] [Google Scholar]
- McClure, M. K., Rocha, W. R. M., Pontoppidan, K. M., et al. 2023, Nat. Astron., 7, 431 [NASA ADS] [CrossRef] [Google Scholar]
- McCord, T. B., Hansen, G. B., Clark, R. N., et al. 1998, J. Geophys. Res., 103, 8603 [NASA ADS] [CrossRef] [Google Scholar]
- Mifsud, D. V., Herczku, P., Rácz, R., et al. 2022, Front. Chem., 10, 1003163 [NASA ADS] [CrossRef] [Google Scholar]
- Minh, Y. C., Irvine, W. M., & Ziurys, L. M. 1989, ApJ, 345, L63 [NASA ADS] [CrossRef] [Google Scholar]
- Minissale, M., & Dulieu, F. 2014, J. Chem. Phys., 141, 014304 [NASA ADS] [CrossRef] [Google Scholar]
- Minissale, M., Moudens, A., Baouche, S., Chaabouni, H., & Dulieu, F. 2016, MNRAS, 458, 2953 [Google Scholar]
- Moore, M., Hudson, R., & Carlson, R. 2007, Icarus, 189, 409 [CrossRef] [Google Scholar]
- Muñoz Caro, G. M., Jiménez-Escobar, A., Martín-Gago, J. Á., et al. 2010, A&A, 522, A108 [NASA ADS] [CrossRef] [EDP Sciences] [Google Scholar]
- Nash, D. B., & Howell, R. R. 1989, Science, 244, 454 [CrossRef] [Google Scholar]
- Navarro-Almaida, D., Le Gal, R., Fuente, A., et al. 2020, A&A, 637, A39 [NASA ADS] [CrossRef] [EDP Sciences] [Google Scholar]
- Neufeld, D. A., Godard, B., Gerin, M., et al. 2015, A&A, 577, A49 [NASA ADS] [CrossRef] [EDP Sciences] [Google Scholar]
- Nguyen, T., Oba, Y., Shimonishi, T., Kouchi, A., & Watanabe, N. 2020, ApJ, 898, L52 [NASA ADS] [CrossRef] [Google Scholar]
- Nguyen, T., Oba, Y., Sameera, W. M. C., Kouchi, A., & Watanabe, N. 2021, ApJ, 918, 73 [NASA ADS] [CrossRef] [Google Scholar]
- Oba, Y., Tomaru, T., Lamberts, T., Kouchi, A., & Watanabe, N. 2018, Nat. Astron., 2, 228 [NASA ADS] [CrossRef] [Google Scholar]
- Oba, Y., Tomaru, T., Kouchi, A., & Watanabe, N. 2019, ApJ, 874, 124 [NASA ADS] [CrossRef] [Google Scholar]
- Öberg, K. I., Fuchs, G. W., Awad, Z., et al. 2007, ApJ, 662, L23 [Google Scholar]
- Öberg, K. I., Bottinelli, S., Jørgensen, J. K., & van Dishoeck, E. F. 2010, ApJ, 716, 825 [Google Scholar]
- Paardekooper, D. M., Fedoseev, G., Riedo, A., & Linnartz, H. 2016, A&A, 596, A72 [NASA ADS] [CrossRef] [EDP Sciences] [Google Scholar]
- Phuong, N. T., Chapillon, E., Majumdar, L., et al. 2018, A&A, 616, A5 [NASA ADS] [CrossRef] [EDP Sciences] [Google Scholar]
- Qasim, D., Witlox, M. J. A., Fedoseev, G., et al. 2020, Rev. Sci. Instrum., 91, 054501 [NASA ADS] [CrossRef] [Google Scholar]
- Santos, J. C., Chuang, K.-J., Schrauwen, J. G. M., et al. 2023, A&A, 672, A112 [NASA ADS] [CrossRef] [EDP Sciences] [Google Scholar]
- Scibelli, S., & Shirley, Y. 2020, ApJ, 891, 73 [NASA ADS] [CrossRef] [Google Scholar]
- Shingledecker, C. N., Lamberts, T., Laas, J. C., et al. 2020, ApJ, 888, 52 [Google Scholar]
- Sie, N.-E., Cho, Y.-T., Huang, C.-H., et al. 2022, ApJ, 938, 48 [NASA ADS] [CrossRef] [Google Scholar]
- Smith, R. G. 1991, MNRAS, 249, 172 [NASA ADS] [CrossRef] [Google Scholar]
- Thaddeus, P., Kutner, M. L., Penzias, A. A., Wilson, R. W., & Jefferts, K. B. 1972, ApJ, 176, L73 [NASA ADS] [CrossRef] [Google Scholar]
- Tielens, A. G. G. M., & Hagen, W. 1982, A&A, 114, 245 [Google Scholar]
- Tschersich, K. G. 2000, J. Appl. Phys., 87, 2565 [NASA ADS] [CrossRef] [Google Scholar]
- van der Tak, F. F. S., Boonman, A. M. S., Braakman, R., & van Dishoeck, E. F. 2003, A&A, 412, 133 [NASA ADS] [CrossRef] [EDP Sciences] [Google Scholar]
- van Dishoeck, E. F., Blake, G. A., Jansen, D. J., & Groesbeck, T. D. 1995, ApJ, 447, 760 [Google Scholar]
- van Dishoeck, E. F., Herbst, E., & Neufeld, D. A. 2013, Chem. Rev., 113, 9043 [Google Scholar]
- Vastel, C., Phillips, T. G., Ceccarelli, C., & Pearson, J. 2003, ApJ, 593, L97 [Google Scholar]
- Vasyunin, A. I., & Herbst, E. 2013, ApJ, 769, 34 [Google Scholar]
- Vidal, T. H. G., Loison, J.-C., Jaziri, A. Y., et al. 2017, MNRAS, 469, 435 [Google Scholar]
- Wakelam, V., Castets, A., Ceccarelli, C., et al. 2004, A&A, 413, 609 [NASA ADS] [CrossRef] [EDP Sciences] [Google Scholar]
- Watanabe, N., & Kouchi, A. 2002, ApJ, 571, L173 [Google Scholar]
- Watanabe, N., & Kouchi, A. 2008, Progr. Surf. Sci., 83, 439 [NASA ADS] [CrossRef] [Google Scholar]
- Westley, M. S., Baratta, G. A., & Baragiola, R. A. 1998, J. Chem. Phys., 108, 3321 [NASA ADS] [CrossRef] [Google Scholar]
- Yarnall, Y. Y., & Hudson, R. L. 2022, ApJ, 931, L4 [CrossRef] [Google Scholar]
Values have been taken from the NIST Computational Chemistry Comparison and Benchmark Database (CCCBDB), NIST Standard Reference Database Number 101, https://cccbdb.nist.gov/
All Tables
Effective cross sections of H2S2 formation (σ(H2S2)) and H2S chemical desorption (σCD(H2S)) derived from the predeposition experiments performed at 10, 12, 14, and 16 K.
All Figures
|
Fig. 1 Infrared spectra of the codeposition experiments. Panel a: comparison between the final infrared spectra after deposition of a pure H2S ice (black) superimposed by the final spectrum after codeposition of H2S and H atoms (red) with analogous experimental conditions. Panel b: infrared spectra acquired during the warming up of the H2S ice codeposited with H atoms, offset for clarity. In both panels, the assignments of the H2S and H2S2 vibrational bands are shown with dashed lines. |
| In the text | |
|
Fig. 2 TPD-QMS results for the detection of H2S. Panel a: TPD-QMS spectra of m/z = 32 (blue) and m/z = 34 (red) after deposition of a pure H2S ice and codeposition of H2S + H with analogous experimental conditions. Spectra are offset for clarity and shown in the temperature range relevant to H2S thermal desorption. Panel b: Comparison between the relative intensities of m/z = 32 and 34 desorbing at 85 K in both H2S and H2S + H experiments together with the standard fragmentation pattern of H2S from NIST. |
| In the text | |
|
Fig. 3 TPD-QMS results for the detections of H2S2. Panel a: TPD-QMS spectra of m/z = 32 (blue), 34 (red), 64 (green), 65 (purple), and 66 (yellow) after deposition of apure H2S ice and codeposition of H2S + H with analogous experimental conditions. Spectra are offset for clarity and shown in the temperature range relevant to H2S2 thermal desorption. Panel b: mass fragmentation pattern of H2S2 generated by 70 eV electron ionization as measured in this work. |
| In the text | |
|
Fig. 4 Infrared spectrum after deposition of a pure H2S ice (black) and the difference spectra after exposure to H atoms for 20 min (red), 40 min (blue), and 60 min (green). Superimposed onto the difference spectra are the corresponding Gaussian fittings of the H2S band (purple), H2S2 band (yellow), and the resulting convoluted feature (brown). The spectra have been offset for clarity. |
| In the text | |
|
Fig. 5 Monitoring of H2S in the solid and gas phases during H-atom bombardment. Upper panel: variation in H2S column density measured from the ~2553 cm−1 band in the IR spectra as a function of time. Lower panel: scan of the m/z = 34 ([H2S]+) as measured by the QMS as a function of time. The shadowed areas denote the periods during which the H-atom flux was stopped. |
| In the text | |
|
Fig. 6 Derived contributions from H2S2 formation and H2S chemical desorption to the measured loss in N(H2S) after 120 min of H-atom exposure at 10, 12, 14, and 16 K. |
| In the text | |
|
Fig. 7 Column densities of H2S and H2S2 in the ice during H-atom bombadrment. Upper panel: variation in H2S2 column density during H-atom exposure of an H2S ice at 10 K. Lower panel: variation in H2S column density as a function of H-atom fluence during bombardment of an H2S ice at 10 K. The two-term exponential fitting to the points is shown in red, while the fast and slow components of the fitting are plotted in blue and green, respectively. |
| In the text | |
|
Fig. 8 Chemical desorption curves for H2S as a function of H-atom fluence. Upper panel: estimated contribution from chemical desorption to the decrease in N(H2S) as a function of fluence. The simple exponential fitting to the points is shown in red, and the linear fitting to the first 55 min of bombardment is shown in blue (dashed line). Lower panel: integrated intensity of the m/z = 34 signal measured by the QMS as a function of H-atom fluence during the same experiment. The red line shows the exponential fitting to the points. |
| In the text | |
|
Fig. A.1 Derivation of A′(H2S). Left panel: HeNe laser interference pattern obtained from the growing H2S ice at 10 K (black) together with its sinusoidal fitting (red). Changes in the amplitude of the fringes are attributed to laser instabilities. Right panel: Integrated absorbance area of the SH stretching mode of H2S as a function of column density as derived from the fringe patter. A linear fit to the points is also shown in red. |
| In the text | |
Current usage metrics show cumulative count of Article Views (full-text article views including HTML views, PDF and ePub downloads, according to the available data) and Abstracts Views on Vision4Press platform.
Data correspond to usage on the plateform after 2015. The current usage metrics is available 48-96 hours after online publication and is updated daily on week days.
Initial download of the metrics may take a while.