Fig. 2
Download original image
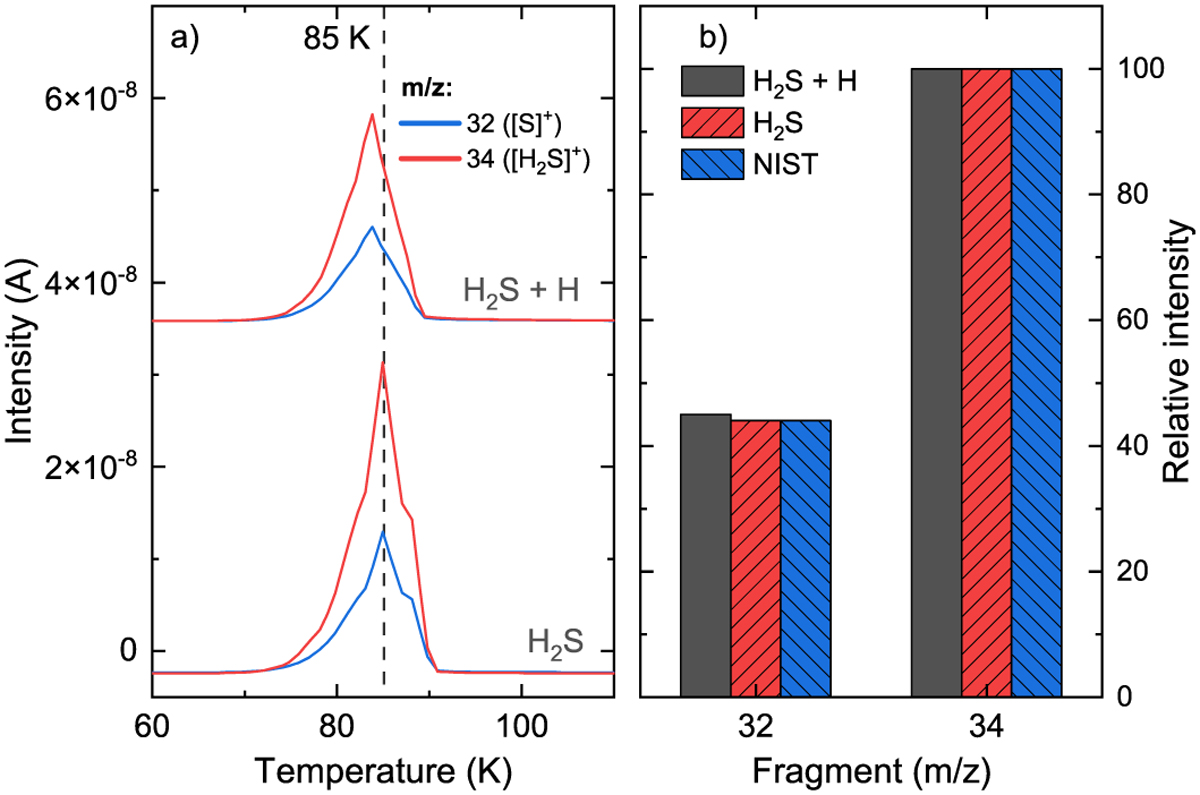
TPD-QMS results for the detection of H2S. Panel a: TPD-QMS spectra of m/z = 32 (blue) and m/z = 34 (red) after deposition of a pure H2S ice and codeposition of H2S + H with analogous experimental conditions. Spectra are offset for clarity and shown in the temperature range relevant to H2S thermal desorption. Panel b: Comparison between the relative intensities of m/z = 32 and 34 desorbing at 85 K in both H2S and H2S + H experiments together with the standard fragmentation pattern of H2S from NIST.
Current usage metrics show cumulative count of Article Views (full-text article views including HTML views, PDF and ePub downloads, according to the available data) and Abstracts Views on Vision4Press platform.
Data correspond to usage on the plateform after 2015. The current usage metrics is available 48-96 hours after online publication and is updated daily on week days.
Initial download of the metrics may take a while.