Fig. 8
Download original image
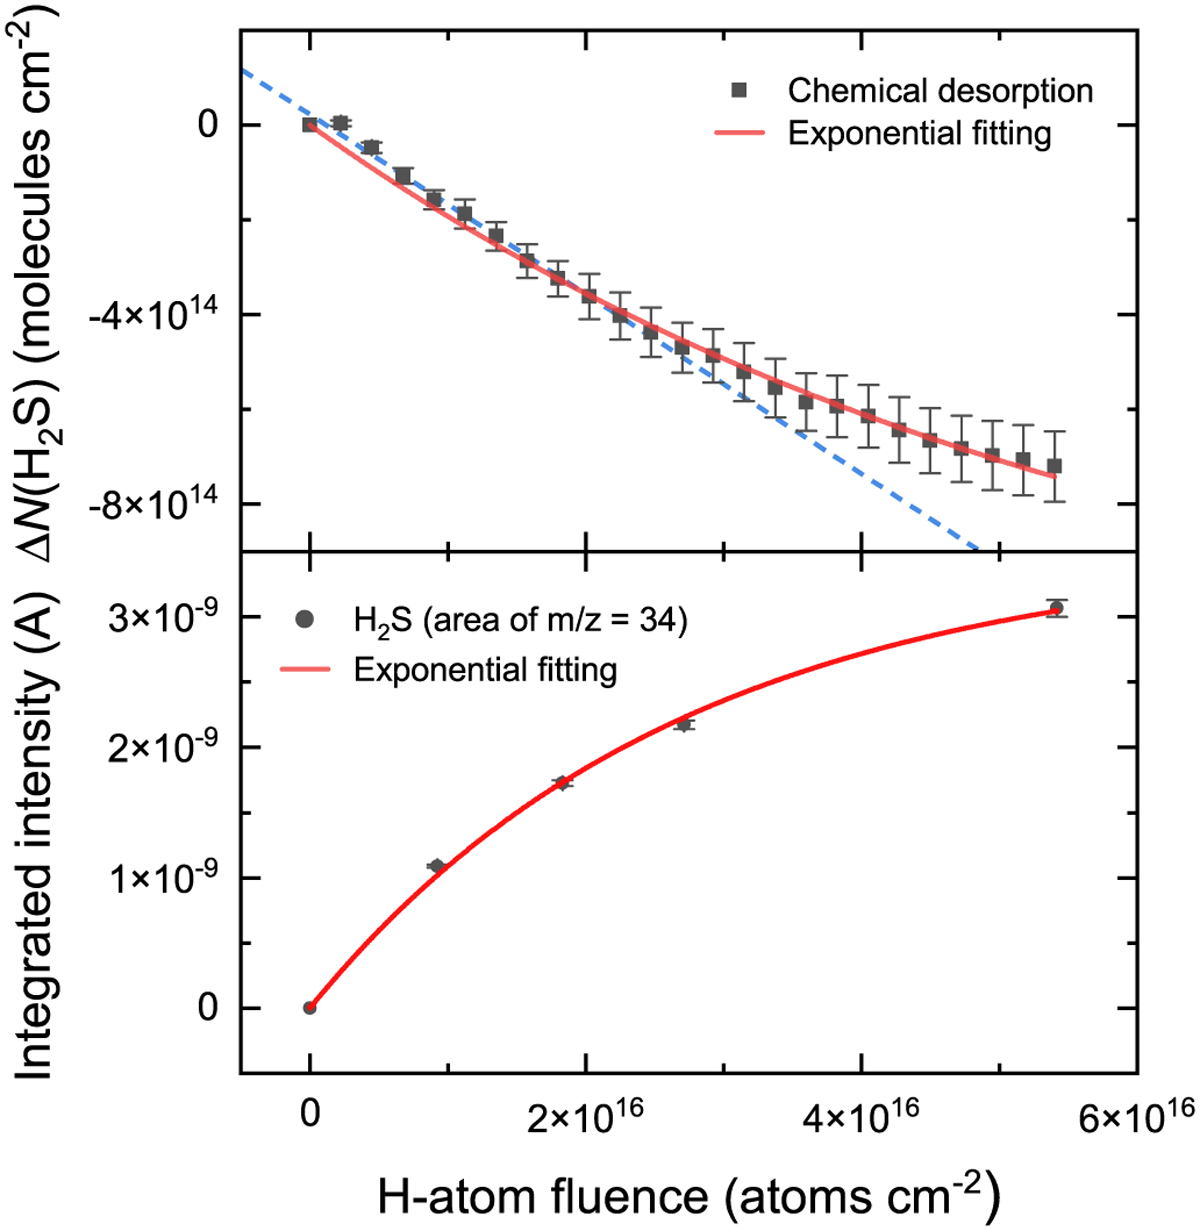
Chemical desorption curves for H2S as a function of H-atom fluence. Upper panel: estimated contribution from chemical desorption to the decrease in N(H2S) as a function of fluence. The simple exponential fitting to the points is shown in red, and the linear fitting to the first 55 min of bombardment is shown in blue (dashed line). Lower panel: integrated intensity of the m/z = 34 signal measured by the QMS as a function of H-atom fluence during the same experiment. The red line shows the exponential fitting to the points.
Current usage metrics show cumulative count of Article Views (full-text article views including HTML views, PDF and ePub downloads, according to the available data) and Abstracts Views on Vision4Press platform.
Data correspond to usage on the plateform after 2015. The current usage metrics is available 48-96 hours after online publication and is updated daily on week days.
Initial download of the metrics may take a while.