Fig. 7
Download original image
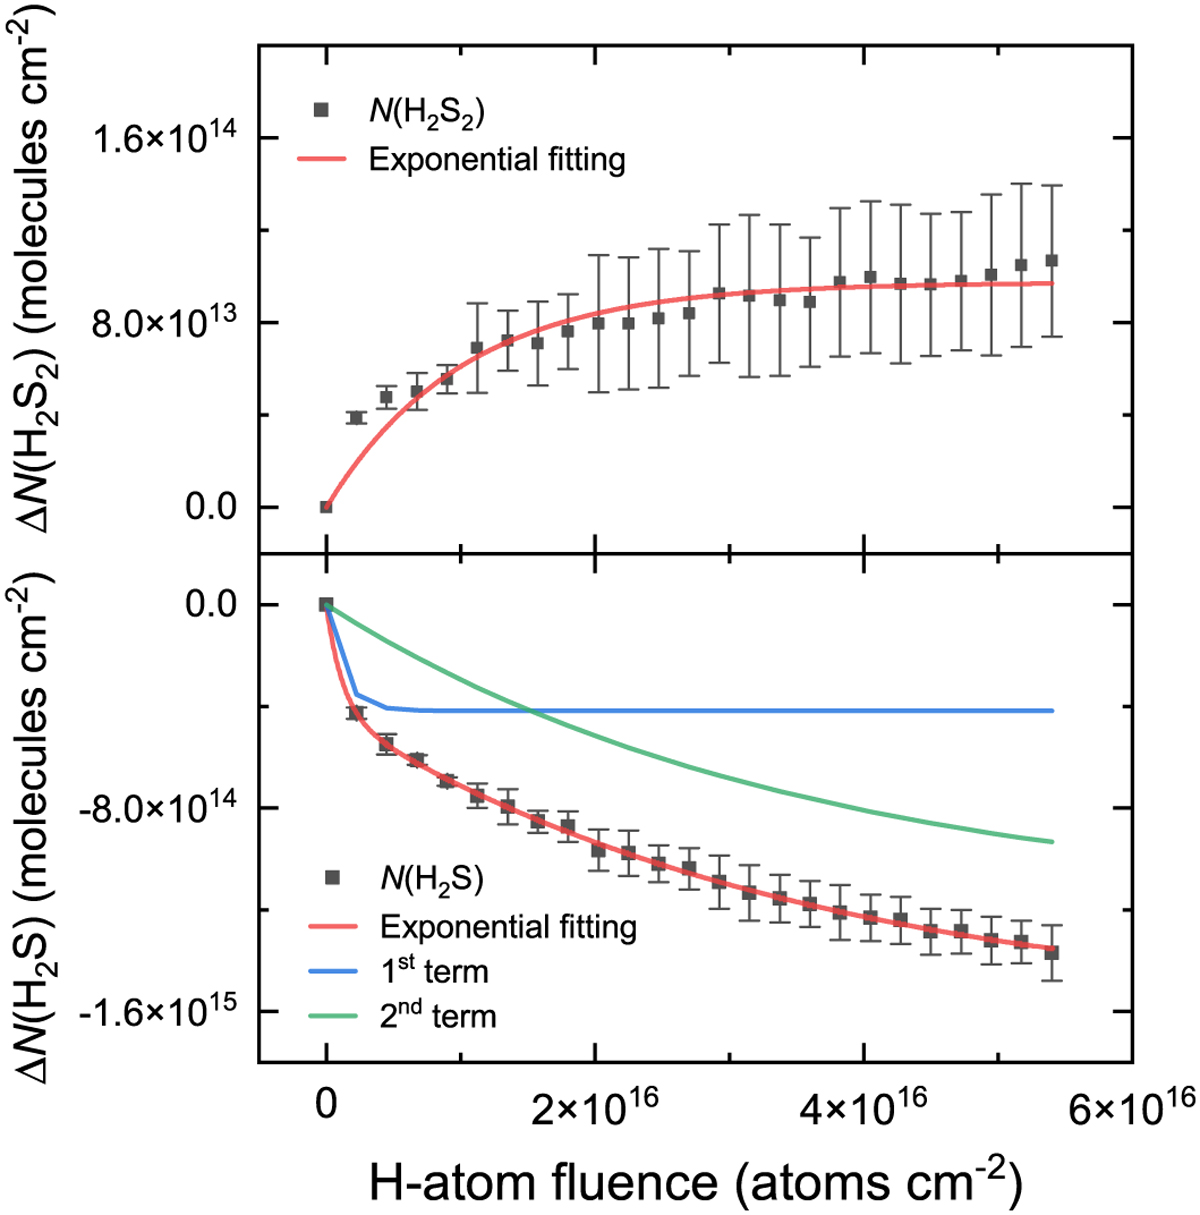
Column densities of H2S and H2S2 in the ice during H-atom bombadrment. Upper panel: variation in H2S2 column density during H-atom exposure of an H2S ice at 10 K. Lower panel: variation in H2S column density as a function of H-atom fluence during bombardment of an H2S ice at 10 K. The two-term exponential fitting to the points is shown in red, while the fast and slow components of the fitting are plotted in blue and green, respectively.
Current usage metrics show cumulative count of Article Views (full-text article views including HTML views, PDF and ePub downloads, according to the available data) and Abstracts Views on Vision4Press platform.
Data correspond to usage on the plateform after 2015. The current usage metrics is available 48-96 hours after online publication and is updated daily on week days.
Initial download of the metrics may take a while.