Fig. 5
Download original image
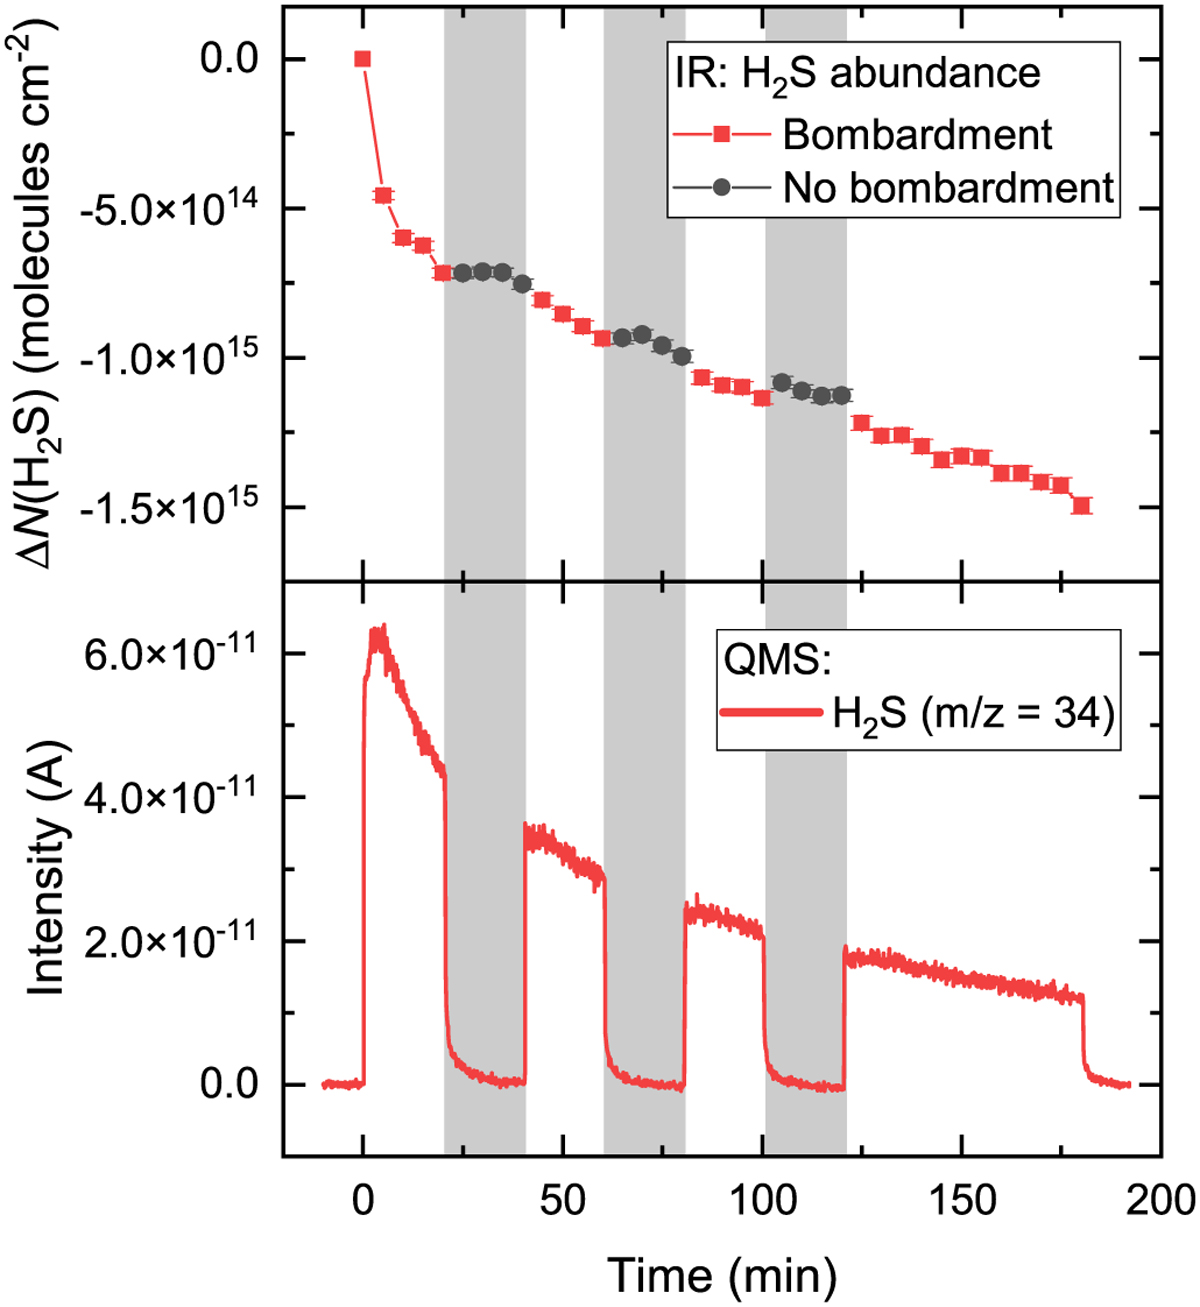
Monitoring of H2S in the solid and gas phases during H-atom bombardment. Upper panel: variation in H2S column density measured from the ~2553 cm−1 band in the IR spectra as a function of time. Lower panel: scan of the m/z = 34 ([H2S]+) as measured by the QMS as a function of time. The shadowed areas denote the periods during which the H-atom flux was stopped.
Current usage metrics show cumulative count of Article Views (full-text article views including HTML views, PDF and ePub downloads, according to the available data) and Abstracts Views on Vision4Press platform.
Data correspond to usage on the plateform after 2015. The current usage metrics is available 48-96 hours after online publication and is updated daily on week days.
Initial download of the metrics may take a while.