Fig. 4
Download original image
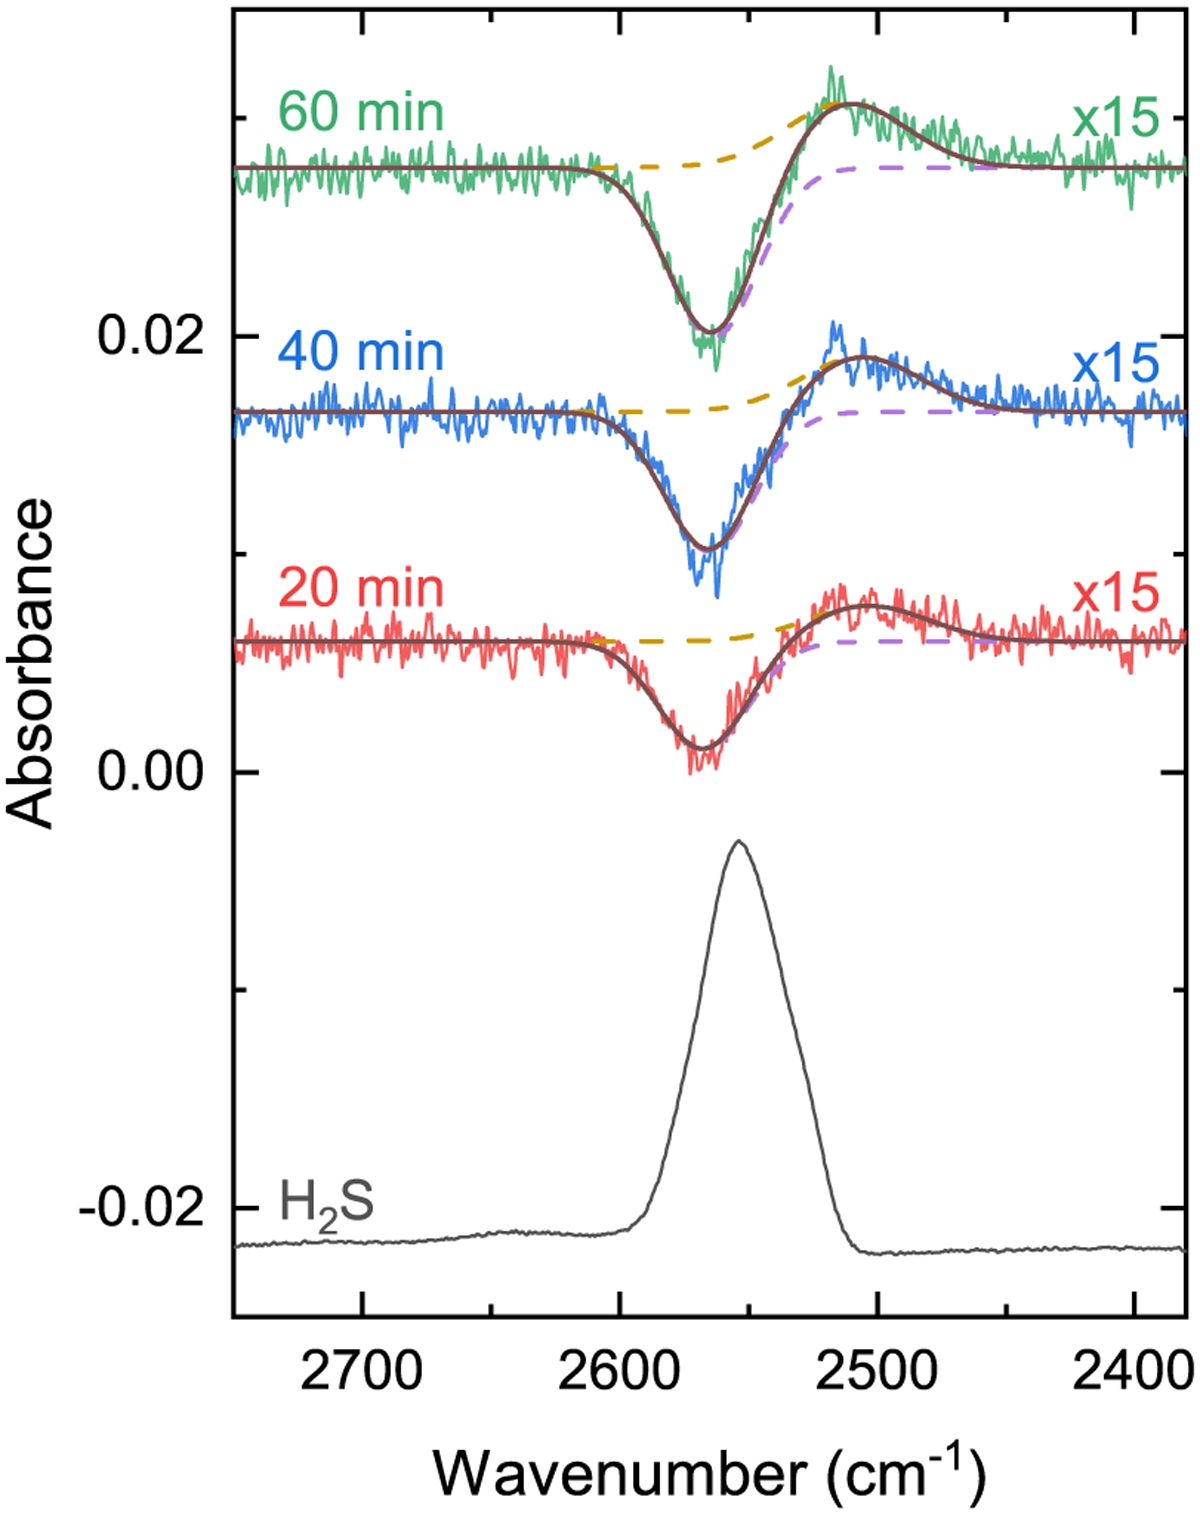
Infrared spectrum after deposition of a pure H2S ice (black) and the difference spectra after exposure to H atoms for 20 min (red), 40 min (blue), and 60 min (green). Superimposed onto the difference spectra are the corresponding Gaussian fittings of the H2S band (purple), H2S2 band (yellow), and the resulting convoluted feature (brown). The spectra have been offset for clarity.
Current usage metrics show cumulative count of Article Views (full-text article views including HTML views, PDF and ePub downloads, according to the available data) and Abstracts Views on Vision4Press platform.
Data correspond to usage on the plateform after 2015. The current usage metrics is available 48-96 hours after online publication and is updated daily on week days.
Initial download of the metrics may take a while.