| Issue |
A&A
Volume 676, August 2023
|
|
|---|---|---|
| Article Number | A105 | |
| Number of page(s) | 10 | |
| Section | Planets and planetary systems | |
| DOI | https://doi.org/10.1051/0004-6361/202346775 | |
| Published online | 17 August 2023 | |
The volatile composition of C/2021 A1 (Leonard): Comparison between infrared and UV-optical measurements
1
INAF – Osservatorio astrofisico di Arcetri,
Largo Enrico Fermi 5,
50125
Firenze,
Italy
e-mail: This email address is being protected from spambots. You need JavaScript enabled to view it.
2
Space sciences, Technologies & Astrophysics Research (STAR) Institute Allée du Six Août,
19C, University of Liège,
4000
Liège,
Belgium
3
NASA – GSFC,
8800 Greenbelt Rd,
Greenbelt, MD
20771,
USA
4
Physics Department, Leach Science Center, Auburn University,
Auburn, AL
36832,
USA
Received:
28
April
2023
Accepted:
9
June
2023
Abstract
Aims. We report on the composition of comet C/2021 A1 (Leonard) as measured by CRIRES+, the upgraded high resolution infrared echelle spectrometer of VLT/ESO. We compare our results with those obtained in the near-UV-visible using TRAPPIST-South.
Methods. C/2021 A1 (Leonard) was observed with CRIRES+ on December 29, 2021 and January 1–3, 2022, and monitored almost daily using TRAPPIST-South from about mid-December 2021 to the end of January 2022. During the TRAPPIST observations the comet showed (almost) periodic outbursts, with an estimated interval of about 4.4 days. One of these outbursts occurred close in time with our CRIRES+ observations on January 1, allowing us to investigate fresh material released from the nucleus. Both data sets were reduced using established algorithms tailored for each telescope and instrument. The obtained results in the two spectral ranges were searched for correlations and similarities to compare the primary and secondary species in the coma.
Results. The abundance ratios (with respect to water) of CH3OH, C2H6, and CH4 in C/2021 A1, as measured in the infrared with CRIRES+, are lower than the average values measured in other comets, suggesting a depletion in organics for this comet. On the contrary, measurements in the near UV-Visible spectral region obtained close in time with TRAPPIST-South show a C2/CN ratio that falls in the typical range. The different conclusions that can be reached observing the same comet in different spectral ranges (organic depleted vs. organic typical) open a series of questions on the processes occurring in the coma. Their comprehensive interpretation requires deeper investigations in future studies.
Key words: comets: general / comets: individual: Comet C/2021 A1 / infrared: planetary systems
© The Authors 2023
 Open Access article, published by EDP Sciences, under the terms of the Creative Commons Attribution License (https://creativecommons.org/licenses/by/4.0), which permits unrestricted use, distribution, and reproduction in any medium, provided the original work is properly cited.
This article is published in open access under the Subscribe to Open model. This email address is being protected from spambots. You need JavaScript enabled to view it. to support open access publication.
1 Introduction
Comets formed about 4.6 billion years ago in our protoplanetary disk. After their formation, giant planet orbital migrations contributed to their scattering into their current reservoirs (i.e., the Oort cloud and the scattered disk of the Kuiper Belt, Gomes et al. 2005; Brasser & Morbidelli 2013; Walsh & Morbidelli 2011). There, the comet nuclei remained frozen until now, preserving most of the chemical and mineralogical properties inherited from their formation site. The comparison between the chemical composition of comets and that observed in star formation regions can thus test the processes that affected the material during the formation of the Solar System and its early evolution (Lippi et al. 2021; Eistrup et al. 2019).
Taxonomic studies based on infrared observations (2–5 µm) of primary volatiles (i.e. molecules that sublimate directly from the surface of an active nucleus) reveal a broad chemical diversity, but with no clear chemical families distinguished among these bodies (Mumma & Charnley 2011; Lippi et al. 2021; Dello Russo et al. 2016; Bockelée-Morvan & Biver 2017). Conversely, optical surveys of photo-dissociated (i.e., secondary) species in the coma (e.g., OH, NH, CN, C2, C3, and NH2) show two distinct chemical classes, with about 30% of objects depleted in the C2/CN ratio (A’Hearn et al. 1995; Cochran et al. 2015; Fink 2009; Opitom 2016; Moulane 2021). Even if it is not unusual to observe these inconsistencies between infrared (IR) and near-ultraviolet-visible (near-UV-visible) data, it is still not clear if observing conditions and diverse reduction approaches influence the results obtained at different wavelengths. Moreover, the formation of secondary species from primary ones and the evolution of molecular species in the coma with respect to the heliocentric distance are still poorly portrayed (Feldman et al. 2004)
Comet C/2021 A1 (Leonard), hereafter C/2021 A1, was a long-period comet characterized by a retrograde orbit. It approached the Sun between December 2021 and January 2022 (perihelion at about 0.615 au on January 3, 2022) with a minimum geocentric distance of 0.233 au on December 12, 2021. Close to perihelion, the comet showed a peculiar behavior presenting (almost) periodical outbursts about every 4 days. The comet started to breakup in mid-December 2022, and disintegrated completely at the end of February 2022 (see Fig. 1 and Jewitt et al. 2023).
Here, we report the molecular abundances of different organic species retrieved observing C/2021 A1 in the near-infrared with the CRyogenic high-resolution cross-dispersed InfraRed Echelle Spectrograph – CRIRES+ (Dorn et al. 2014; Kaeufl et al. 2004). We compare these results with those of radicals observed in the optical spectral range during the same period using the TRAnsiting Planets and PlanetesImals Small Telescope–South – TRAPPIST-South (Jehin et al. 2011).
CRIRES+ observation log for C/2021 A1.
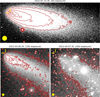 |
Fig. 1 TRAPPIST-South images of C/2021 A1 taken between January and April 2022 showing the disruption of its nucleus. (Vander Donckt et al. 2022). Contours at different sigma levels (red) show dissipation of the dust after the disruption. While there is a well defined optocenter on January 22 with a > 500 sigma detection at the position computed by the NASA JPL Horizon API1 (indicated by a yellow cross), only a diffuse dust leftover without optocenter is observed on April 7, SouthEast of the NASA JPL Horizon-predicted position. March 8 shows an intermediate stage of the disruption. North is up and east is right, and a 30″ diameter yellow circle on the bottom left of the images indicates the scale. |
2 Observations and data reduction
2.1 CRIRES+ first reported observation of a comet
CRIRES+ is the European Southern Observatory (ESO) infrared (0.95–5.3 µm) long-slit cross-dispersed high resolution spectro-graph situated at the Very Large Telescope (VLT) in Paranal, and it is an upgraded version of the previous instrument CRIRES (Kaeufl et al. 2004). As it is now a cross-dispersed echelle spectrometer, it allows for a wavelength coverage that is greater by a factor of ten compared to the previous version; at the same time, the instrument is still characterized by high spectral resolving power of 40000 (80000) for a slit width of 0.4″ (0.2″). A set of three new detectors provides a large field coverage area with lower noise, higher quantum efficiency, and lower dark current. CRIRES+ is equipped with a multi-application curvature adaptive optic system (MACAO), which can further increase the performances of the instrument (Paufique et al. 2004).
We observed comet C/2021 A1 with CRIRES+ over three nights, as reported in Table 1. During this time, the visual brightness (mv) of the comet oscillated between about 5 and 3, peaking on December 31 st, 2021, when the comet possibly had one of the many outbursts observed between December 2021 and January 2022 (see Sect. 3.1). For our observations, we used a single setting (L3302) and a slit width of 0.4 arcsec, oriented along the extended Sun-comet radius vector direction.
The observations were challenging in many regards. First, the target was not in optimal observing conditions being visible for only about 30 minutes per night at high airmass and low altitude, pushing the UT3-VLT telescope to its elevation limit. Second, we decided to use a nod-off-comet strategy. In fact, standard observations use a four step nodding sequence along the slit, pointing on the comet (ABBA sequence) in order to cancel thermal background and line emissions from Earth’s atmosphere through the (A1−B1−B2+A2) operation. In our case, considering the extent of the coma of C/2021 A1 and the current slit length of CRIRES+ (10″), we instead used an ABBA sequence where A is the comet and B is the sky, with a separation of 12″. With this strategy, we were able to avoid significant subtraction of the comet signal along the slit, even if (in the case of a highly variable atmosphere) it may result in an improper subtraction of the sky and higher residual values during the reduction process. Moreover, it reduces the total time on source resulting in corresponding lower signal-to-noise. Finally, due to the very high airmass, there was no particular gain in using the adaptive optics module.
Nevertheless, we were able to acquire high-quality spectra, as shown in Figs. 2 and 3. Even with a single setting, the increased wavelength coverage of CRIRES+ allowed us to observe multiple species (as listed in Table 2) simultaneously with water, which we used as reference to compute the relative abundances.
We processed all data sets in a systematic way using NASA-Goddard custom and semi-automated tools that include the latest procedures for flat-fielding and removal of high dark current pixels and cosmic ray hits, along with spatial and spectral straightening with millipixel precision (cf., Bonev 2005; DiSanti et al. 2006; Villanueva et al. 2013). Spectral calibration and compensation for telluric absorption was achieved by comparing the data with highly precise atmospheric radiance and transmittance models obtained with the Planetary Spectrum Generator (PSG, Villanueva et al. 2018). Flux calibration was obtained using a suitable standard star observed closely in time with the comet and processed with the same algorithms.
For each observing date, the rotational temperature was retrieved from the analysis of water lines and assumed to be the same for all the species. Nucleus-centered production rates were obtained using well established quantum mechanical fluorescence models (see e.g., DiSanti et al. 2006; Villanueva et al. 2012a,b; Lippi et al. 2013; Radeva et al. 2011), using both a chi-square minimization process based on Levenberg–Marquardt non-linear fitting algorithm (Villanueva et al. 2011) and a complementary correlation analysis (Bonev 2005). Nucleus-centered production rates were multiplied by a common growth factor (accounting for slit losses and aperture effects) retrieved from the spatial analysis of water lines (for details on the growth factor formalism, see, e.g., Villanueva et al. 2011 or Appendix B2 in Dello Russo et al. 1998). In our calculations, we assumed a spherically symmetric uniform outflow  , where Rh is the heliocentric distance in au. The final total production rates and corresponding relative abundances (i.e., mixing ratios) with respect to water are reported in Table 2 and discussed in Sect. 3.2.
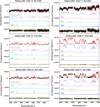 |
Fig. 2 Example of spectra of comet C/2021 A1 obtained with CRIRES+. From top to bottom: spectra on the left side cover the water region (L3302–Order 19), while spectra on the right cover the methane region (L3302 – Order 17). For each plot, the top-most spectrum is the observed and total model (in red), the gray line below is the modeled transmittance. Each molecular model used to retrieve the presented production rates is shown in different colors and labeled accordingly. The bottom black line represents the fit residual, while the yellow lines are the ±1σ error. The gaps between the spectra are due to the gaps between the three detectors of CRIRES+. |
2.2 TRAPPIST-South monitoring
Using narrowband and broadband filters, we imaged comet C/2021 A1 extensively throughout its passage in 2021/2022 with TRAPPIST-South (Jehin et al. 2011). Regular monitoring with narrow-band HB comet filters (Farnham et al. 2000) was conducted from late December 2021 through late January 2022, where we observed the comet on an almost nightly basis (see Fig. 4). Exposure times varied with the comet’s brightness, but were typically 1–15 s for broad-band images and 120–600 s for narrow-band images. Most filters were acquired in sets of between three and five images, which were used later to look for short-term changes in the dust and gas activity in the coma and/or to detect outbursts instantly. When conditions were photometric, we collected observations of HB standard stars (Farnham et al. 2000) to derive the zero-points in order to calibrate the absolute flux of the comet.
For the data reduction, we followed standard procedures using frequently updated master bias, flat, and dark frames. The sky contribution was sampled in a part of the image devoid of cometary flux and subtracted from the image, and a flux calibration was performed using standard stars. For the absolute flux calibration, we used an uncertainty of 5% on the extinction coefficients in all filters as seen in our long-term observations of the standard stars. This is almost negligible compared to the sky level uncertainty at lower airmass, but it becomes significant at high airmass. We estimated the 3σ level uncertainty on the sky background value and used it to compute the error on production rates due to the sky subtraction. As a result, errors given in the following sections are a quadratic combination of sky background and extinction coefficient uncertainties.
In order to derive the production rates, we converted the flux of different gas species (OH, NH, CN, C3, and C2) to column densities using heliocentric distance and heliocentric velocity dependent fluorescence efficiencies (Schleicher 2010, and references therein). The contribution of the dust in each filter was removed using the procedure described in Farnham et al. (2000), with dust decontamination coefficients estimated from the BC dust filter and the dust color computed between the BC and decontaminated GC dust filters. Similarly, CN images were decontaminated from C3 contribution. The applied decontamination coefficient were averaged over all the nights, as no clear trend was observed in the coefficients between the different nights. To convert column densities into production rates, we used a Haser model (Haser 1957) to fit the coma profile between nucleus distances of ρ = 103.5 to ρ = 104.3 km. We used for the Haser model the same parameters as A’Hearn et al. (1995), that is, a constant velocity for daughter and parent species of 1 km s−1, and the parent and daughter scale lengths presented in Table 3 that we scaled as the square of the heliocentric distance.
We derived the Afρ parameter, proxy of dust production (A’Hearn et al. 1984), from the dust profiles at a nucleus distance ρ = 10 000 km using the HB comet dust continuum BC, GC and RC filters and the broad-band B, V, R and I filters. We corrected the A(θ)fρ from the phase angle effect to obtain A(0)fρ using the composite phase function by David Schleicher2 normalized at 0° angle. It is a composite of the two different phase functions obtained by Schleicher et al. (1998) and Marcus (2007). A(0) fρ values for the for R and RC filters for December 2021 and January 2022 are shown in the bottom panel of Fig. 4. The overall production rates and Afρ values measured with TRAPPIST-South are reported in Tables A.1 and A.2, where the observations concurring to the CRIRES+’s ones are highlighted in bold.
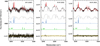 |
Fig. 3 Detection of NH2 and OH* (prompt emission) in CRIRES+ spectra for the three observing dates; one unidentified feature is also visible (highlighted with a question mark). As in Fig. 2, the topmost is the observed spectrum and total model (in red), the gray line below is the modeled transmittance. Each molecular model used to retrieve the presented production rates is shown in different colors and labeled accordingly. The bottom black line represents the fit residual, while the yellow lines are the ±1σ error. |
CRIRES+ total production rates (Q) and mixing ratios with respect to water  in C/2021 A1.
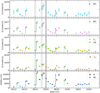 |
Fig. 4 Production rates of secondary species (upper four panels) and A(0)fρ dust activity proxy for R and RC filters (lowest panel) as measured during the TRAPPIST-South monitoring. It is possible to notice different outbursts indicated by vertical green arrows. Each observed radical is shown in a different color. Dates corresponding to CRIRES+ observations are indicated with hashed regions, and perihelion with a vertical dashed line. |
Scale lengths of parents (LP) and daughters (LD) species used in this work, given at Rh =1 au (A’Hearn et al. 1995).
3 Results and discussion: investigating the nature of comet C/2021 A1
3.1 The outbursting activity of C/2021 A1
The outbursting activity of C/2021 A1 was important close to perihelion. We identified at least six outbursts with strong increase of activity in all gases and dust filters between December 20 and January 11 in the TRAPPIST-South quasi-daily monitoring (see Fig. 4). By averaging the delay between those six outbursts, we found the outburst periodicity to be 4.4 ± 1.1 days, with the uncertainty corresponding to the standard deviation. Ferrin et al. (2022) reported a rotational period of 6.56 ± 0.10 days obtained from the analysis of C/2021 A1 light curves; from the same analysis, they also suggested that the comet could be a contact binary with equal size components. Their retrieved rotational period value is slightly longer but comparable to the periodicity we measured for the outbursts, so that it could be possible that the latter is correlated to the exposure to solar radiation of the same part of the surface (or of the same comet component in case of a contact binary). We find no significant variation in abundance ratios with the comet’s activity (see Fig. 7), indicating that the ices driving the outbursts and the ices driving the secular activity of the comet are homogeneous in composition or they are the same.
3.2 Production rates and mixing ratios of primary species as measured with CRIRES+
Comet C/2021 A1 showed a very high activity mainly due to sublimation of water ice. The evolution of water production rates as shown in Table 2 and the corresponding change in the dust continuum intensity signal in Fig. 2, suggest that one of the many outbursts occurred in a lapse of time very close to our second observing night; this is confirmed also by the TRAPPIST observations. During these outbursts the comet most likely released fresh material from the inside of its nucleus, but despite this high activity, the study of primary organic species reveals a comet characterized by quite low relative abundances of organics compared to median reference values in other comets, as shown in Fig. 6. In fact, while the water lines are particularly bright, it is almost impossible to identify other typical spectral features usually observed in similar targets. For example, the CH3OH Q-branch appeared only faintly during the January 1 outburst (see Fig. 5). If we compare our results with the statistics reported in Lippi et al. (2021, Table 4), we see that for methanol our overall mixing ratio (0.45 ± 0.03) is much lower than the median one  . Two hydrocarbons (methane and ethane) were also identified and showed low mixing ratios (0.22 ± 0.03 and 0.208 ± 0.005, respectively) if compared to the median measured in other comets
  and
and  , respectively). The only exceptions to this trend seem to be H2CO, which showed instead particularly enriched values (0.26 ± 0.02) vs.
  . Our ammonia measurements are affected by very high noise; nevertheless, the most stringent upper limit for NH3 (<0.6) is slightly smaller than the median value in comets
  .
.
In the spectra obtained during the second and third observing nights it is possible to also observe some unidentified lines. Even if the majority of these lines are most likely due to OH* prompt emission, a few seem to correspond to HCl molecular emissions (see Fig. 5). Unfortunately, not all the expected or modeled HCl lines were visible in our spectra, and the detected ones are affected by high noise and/or blended with lines from other species. Nevertheless, for this molecule we estimate an average mixing ratio of (0.026 ± 0.003), consistent with previous reported values in comets (Bockelée-Morvan et al. 2014; De Keyser et al. 2017) and with the value reported by Faggi et al. (2023), who observed the same comet a few days after our observations.
Considering the overall results, we can conclude that from the IR perspective, comet C/2021 A1 is depleted in almost all the organics except formaldehyde. A depletion in organics is consistent with a possible primitive composition (i.e., more similar to ISM composition) for this comet or with a depletion of volatiles due to thermal evolution of the nucleus. Importantly, our results are comparable with those measured with iSHELL on a neighboring observing period (Faggi et al. 2023), which also showed an overall organic depletion of the chemical inventory of this comet, further confirming that these results were not unique to our observing dates.
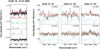 |
Fig. 5 CH3OH Q-branch, H2CO, OH* prompt emission and HCl detection (after continuum subtraction) observed the second observing night (left) and fluorescence emission lines most likely due to HCl observed in order 16 (right) during the 01.01.2022 and 03.01.2022 (upper and lower panel, respectively) observing nights. The model (in red) fits the observed lines after the removal of the continuum. The line at about 2864.5 cm−1 is affected by atmospheric residual (the modeled transmittance is below the spectra in cyan), while the line at about 2838.5 cm−1 seems blended with another species. For all the plots, the yellow line indicates the ±1σ error. |
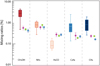 |
Fig. 6 Comparison of measured mixing ratios in comet C/2021 A1 and the box statistic as described in Lippi et al. (2021). For each molecule indicated in the plot, the box is calculated as the range between the 25th and 75th percentiles, with the horizontal line representing the median value, computed considering 20 comets. C/2021 A1 data are in magenta, green, and blue for the first, second, and third observing date, respectively. |
3.3 Production rates and mixing ratios of secondary species as measured with TRAPPIST-South
If we consider the relative abundances among secondary species, the results show a completely different scenario. In fact, compared to mean values in the comet population, C/2021 A1 shows typical relative abundances both with respect to OH and CN (see Fig. 7), according to the taxonomic classification by A’Hearn et al. (1995) based on the statistical analysis of the composition of 85 comets. We find that the comet belongs to the “typical” group rather than the “carbon-chain depleted” group, the latter being characterized by a depletion in the species C2 and C3 with respect to CN and OH. The ratio NH/OH seems to be enriched with respect to other comets. The dust activity is seen to increase around perihelion, while the relative compositions of secondary species did not change during the TRAPPIST-South monitoring. A comparison between the observed abundance ratios of secondary species in C/2021 A1 and the taxonomic groups found by A’Hearn et al. (1995) is given in Table 4.
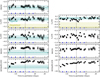 |
Fig. 7 Logarithm of the production rates and dust-to-gas ratios as a function of OH and CN over time around perihelion for comet C/2021 A1. The dust-to-gas ratio is indicated in cm/molecules/s. The mean values and ranges of abundance ratios corresponding to the typical comets taxonomic family, as defined by A’Hearn et al. (1995), are indicated in blue; the mean values and ranges for the carbon-depleted family are shown in green (only for C2). Outburst dates, indicated by blue arrows, are not correlated with significant changes in abundance ratios or dust-to-gas ratios. |
Average of the logarithm of the production rates and A(0) fρ values for C/2021 A1 over all the observation nights compared with the taxonomic groups found by A Hearn et al. (1995).
3.4 Broad discrepancies between parent and daughter species in C/2021 A1
In Table 5, we show the comparison between some observed primary and secondary molecules, the latter thought to be produced by the former through photo-dissociation processes in cometary comae (Feldman et al. 2004); to include more species, we made use of additional IR results for HCN and C2H2 as reported in Faggi et al. (2023) that we compared with TRAPPIST measurements taken on neighboring dates (January 8, 2022; see Table A.1).
HCN is thought to be the primary source of CN in some comets, but in the case of C/2021 A1, the relative abundance measured by Faggi et al. (2023) is not sufficient to explain the abundance we measured for CN with TRAPPIST-South. This is not novel in these types of studies, since other comets observed in the past presented a similar behavior (see, e.g., 8P/Tuttle Bonev et al. 2008, or 67P/Churyumov-Gerasimenko Hänni et al. 2020). Similarly, if we assume that NH3 is the principal source of NH2, in turn it can produce NH through single-step photolysis and so, the measured NH2 abundance does agree with the upper limit we found for NH3, but it is lower than the value found for NH. Finally, the abundance of acetylene reported in Faggi et al. (2023) is not sufficient to explain the abundances of its associated daughter C2 obtained on neighboring dates using TRAPPIST-South. In all these cases, the differences observed between the optical and infrared results point to the existence of still unknown chemical processes in the coma and the need for additional parent sources for the analyzed daughter species. Considering that the comet displays a A(0) fρ parameter that is higher than the average, secondary molecules could also have sublimated from complex refractory organic material from dust grains in the coma. Unfortunately, our data set is not sufficient to investigate this hypothesis in greater detail.
Finally, it is interesting to discuss the differences in the absolute amounts of water and OH. In fact, while the production rates of the two molecules seem to be consistent before the outburst observed on the 1st of January 2022 (with OH/H2O ≈ 0.77), after the outburst the production rate of water increases dramatically, while the OH one remains almost constant (OH/H2O ≈ 0.10). The excess of water compared to our OH measurement is still apparent if we consider the H2O values reported in Faggi et al. (2023) for January 8 and 9, 2022 (OH/H2O ≈ 0.30). A rapid increase of water production rate is reported also by Combi et al. (2023), who retrieved a maximum value of about 2 × 1029 molecules s−1 on December 29, 2021 using SOHO/Swan hydrogen Lyman-α observations; this value is consistent with the OH values measured with TRAPPIST-South on neighboring dates.
In this regard, the differences that we observe between the infrared and optical results may be related to the still large uncertainties in the models that are used to correlate primary molecules to their photo-dissociation products, especially in case of outbursting activity where the relation between species would be better represented with a time-dependent model. Implementing simultaneous multi-wavelength observations as a standard may help to better understand the processes that are ongoing in the coma to retrieve more reliable information about the overall chemical composition of comets.
Comparisons of relative abundances of secondary and primary species observed with TRAPPIST-South and CRIRES+, respectively.
4 Conclusions
We reported production rates and relative abundances for different primary species in C/2021 A1 as measured by CRIRES+ between the end of December 2021 and beginning of January 2022. We compared these results with those obtained from the TRAPPIST-South campaign that observed the same comet during the period between December 2021 and January 2022, covering about the same dates as CRIRES+.
The chemical composition of this comet displays a dichotomy: while C/2021 A1 appears depleted in almost all the organics (with the exception of H2CO), the results in the optical reveal instead a more typical composition, but with enhanced NH and dust.
Comet C/2021 A1 was observed almost simultaneously with CRIRES+ and TRAPPIST-South. Still, the resulting chemical compositions as retrieved at different wavelengths are in contrast, and the reason why is not clear. This highlights the need of implementing multi-wavelength simultaneous observations for the next comets, in order to better characterize these differences and better understand the processes that relate primary and product species in the coma.
Acknowledgements
The presented infrared results are based on observations under the DDT program 2108.C-5017(A), at the European Southern Observatory (ESO), Cerro Paranal. TRAPPIST is a project funded by the Belgian Fonds (National) de la Recherche Scientifique (F.R.S.-FNRS) under grant PDR T.0120.21. We thank NASA, David Schleicher and the Lowell Observatory for the loan of a set of HB comet filters. M.L. acknowledges funding from the Agnes Pockels Fellowships and from the “Next Generation EU” in the context of the “Italian PNRR”; E. Jehin is F.R.S.-FNRS Senior Research Associate; Mathieu Vander Donckt received for this work the support of the French-speaking Community of Belgium through a FRIA grant.
Appendix A TRAPPIST-South monitoring results
Here, we report the production rates and A(0) fρ values as measured during the TRAPPIST-South monitoring campaign. Simultaneous observations with CRIRES+ are highlighted in bold. Observations were carried between UT 00:00 and UT 02:00, except for broadband observation before 2021-07-14 (included) that were carried between UT 22:00 and UT 00:00.
OH, CN, C2, C3, and NH production rates of comet C/2021 A1 from the TRAPPIST-South monitoring.
A(0)fρ computed at nucleus distance ρ = 10000 km for comet C/2021 A1 from the TRAPPIST-South monitoring.
References
- A’Hearn, M. F., Schleicher, D. G., Millis, R. L., Feldman, P. D., & Thompson, D. T. 1984, AJ, 89, 579 [Google Scholar]
- A’Hearn, M. F., Millis, R. C., Schleicher, D. O., Osip, D. J., & Birch, P. V. 1995, Icarus, 118, 223 [Google Scholar]
- Bockelée-Morvan, D., & Biver, N. 2017, Phil. Trans. R. Soc. London, Ser. A, 375, 20160252 [Google Scholar]
- Bockelée-Morvan, D., Biver, N., Crovisier, J., et al. 2014, A&A, 562, A5 [NASA ADS] [CrossRef] [EDP Sciences] [Google Scholar]
- Bonev, B. P. 2005, PhD thesis, University of Toledo, Ohio [Google Scholar]
- Bonev, B. P., Mumma, M. J., Radeva, Y. L., et al. 2008, ApJ, 680, L61 [NASA ADS] [CrossRef] [Google Scholar]
- Brasser, R., & Morbidelli, A. 2013, Icarus, 225, 40 [Google Scholar]
- Cochran, A. L., Levasseur-Regourd, A.-C., Cordiner, M., et al. 2015, Space Sci. Rev., 197, 9 [CrossRef] [Google Scholar]
- Combi, M. R., Mäkinen, T., Bertaux, J. L., Quémerais, E., & Ferron, S. 2023, Icarus, 398, 115543 [NASA ADS] [CrossRef] [Google Scholar]
- De Keyser, J., Dhooghe, F., Altwegg, K., et al. 2017, MNRAS, 469, S695 [NASA ADS] [CrossRef] [Google Scholar]
- Dello Russo, N., DiSanti, M. A., Mumma, M. J., Magee-Sauer, K., & Rettig, T. W. 1998, Icarus, 135, 377 [NASA ADS] [CrossRef] [Google Scholar]
- Dello Russo, N., Kawakita, H., Vervack, R. J., & Weaver, H. A. 2016, Icarus, 278, 301 [NASA ADS] [CrossRef] [Google Scholar]
- DiSanti, M. A., Bonev, B. P., Magee-Sauer, K., et al. 2006, ApJ, 650, 470 [CrossRef] [Google Scholar]
- Dorn, R. J., Anglada-Escude, G., Baade, D., et al. 2014, The Messenger, 156, 7 [NASA ADS] [Google Scholar]
- Eistrup, C., Walsh, C., & van Dishoeck, E. F. 2019, A&A, 629, A84 [NASA ADS] [CrossRef] [EDP Sciences] [Google Scholar]
- Faggi, S., Lippi, M., Mumma, M. J., & Villanueva, G. L. 2023, Planet. Sci. J., 4, 8 [CrossRef] [Google Scholar]
- Farnham, T. L., Schleicher, D. G., & A’Hearn, M. F. 2000, Icarus, 147, 180 [Google Scholar]
- Feldman, P. D., Cochran, A. L., & Combi, M. R. 2004, in Comets II, eds. M. C. Festou, H. U. Keller, & H. A. Weaver (Tucson: University of Arizona Press), 425 [Google Scholar]
- Ferrin, I., & Gomez, A. 2022, ATel, 15361, 1 [NASA ADS] [Google Scholar]
- Fink, U. 2009, Icarus, 201, 311 [Google Scholar]
- Gomes, R., Levison, H. F., Tsiganis, K., & Morbidelli, A. 2005, Nature, 435, 466 [Google Scholar]
- Hänni, N., Altwegg, K., Pestoni, B., et al. 2020, MNRAS, 498, 2239 [Google Scholar]
- Haser, L. 1957, Bulletin de la Société Royale des Sciences de Liège, 43, 740 [Google Scholar]
- Jehin, E., Gillon, M., Queloz, D., et al. 2011, The Messenger, 145, 2 [NASA ADS] [Google Scholar]
- Jewitt, D., Kim, Y., Mattiazzo, M., et al. 2023, AJ, 165, 122 [NASA ADS] [CrossRef] [Google Scholar]
- Kaeufl, H.-U., Ballester, P., Biereichel, P., et al. 2004, SPIE Conf. Ser., 5492, 1218 [NASA ADS] [Google Scholar]
- Lippi, M., Villanueva, G. L., DiSanti, M. A., et al. 2013, A&A, 551, A51 [NASA ADS] [CrossRef] [EDP Sciences] [Google Scholar]
- Lippi, M., Villanueva, G. L., Mumma, M. J., & Faggi, S. 2021, AJ, 162, 74 [NASA ADS] [CrossRef] [Google Scholar]
- Marcus, J. N. 2007, International Comet Quarterly, 29, 39 [NASA ADS] [Google Scholar]
- Moulane, Y. 2021, PhD Thesis, University of Liège, Belgium [Google Scholar]
- Mumma, M. J., & Charnley, S. B. 2011, ARA&A, 49, 471 [NASA ADS] [CrossRef] [Google Scholar]
- Opitom, C. 2016, PhD Thesis, University of Liège, Belgium [Google Scholar]
- Paufique, J., Biereichel, P., Donaldson, R., et al. 2004, SPIE Conf. Ser., 5490, 216 [NASA ADS] [Google Scholar]
- Radeva, Y. L., Mumma, M. J., Villanueva, G. L., & A’Hearn, M. F. 2011, ApJ, 729, 135 [NASA ADS] [CrossRef] [Google Scholar]
- Schleicher, D. G. 2010, AJ, 140, 973 [Google Scholar]
- Schleicher, D. G., Millis, R. L., & Birch, P. V. 1998, Icarus, 132, 397 [NASA ADS] [CrossRef] [Google Scholar]
- Vander Donckt, M., Lippi, M., Faggi, S., & Jehin, E. 2022, Eur. Planet. Sci. Cong., 2022, 685 [Google Scholar]
- Villanueva, G. L., Mumma, M. J., DiSanti, M. A., et al. 2011, Icarus, 216, 227 [NASA ADS] [CrossRef] [Google Scholar]
- Villanueva, G. L., DiSanti, M. A., Mumma, M. J., & Xu, L. H. 2012a, ApJ, 747, 37 [NASA ADS] [CrossRef] [Google Scholar]
- Villanueva, G. L., Mumma, M. J., Bonev, B. P., et al. 2012b, J. Quant. Spectrosc. Radiat. Transf., 113, 202 [NASA ADS] [CrossRef] [Google Scholar]
- Villanueva, G. L., Mumma, M. J., Novak, R. E., et al. 2013, Icarus, 223, 11 [CrossRef] [Google Scholar]
- Villanueva, G. L., Smith, M. D., Protopapa, S., Faggi, S., & Mandell, A. M. 2018, J. Quant. Spectrosc. Radiat. Transf., 217, 86 [NASA ADS] [CrossRef] [Google Scholar]
- Walsh, K. J., & Morbidelli, A. 2011, A&A, 526, A126 [NASA ADS] [CrossRef] [EDP Sciences] [Google Scholar]
All Tables
CRIRES+ total production rates (Q) and mixing ratios with respect to water in C/2021 A1.
Scale lengths of parents (LP) and daughters (LD) species used in this work, given at Rh =1 au (A’Hearn et al. 1995).
Average of the logarithm of the production rates and A(0) fρ values for C/2021 A1 over all the observation nights compared with the taxonomic groups found by A Hearn et al. (1995).
Comparisons of relative abundances of secondary and primary species observed with TRAPPIST-South and CRIRES+, respectively.
OH, CN, C2, C3, and NH production rates of comet C/2021 A1 from the TRAPPIST-South monitoring.
A(0)fρ computed at nucleus distance ρ = 10000 km for comet C/2021 A1 from the TRAPPIST-South monitoring.
All Figures
|
Fig. 1 TRAPPIST-South images of C/2021 A1 taken between January and April 2022 showing the disruption of its nucleus. (Vander Donckt et al. 2022). Contours at different sigma levels (red) show dissipation of the dust after the disruption. While there is a well defined optocenter on January 22 with a > 500 sigma detection at the position computed by the NASA JPL Horizon API1 (indicated by a yellow cross), only a diffuse dust leftover without optocenter is observed on April 7, SouthEast of the NASA JPL Horizon-predicted position. March 8 shows an intermediate stage of the disruption. North is up and east is right, and a 30″ diameter yellow circle on the bottom left of the images indicates the scale. |
| In the text | |
|
Fig. 2 Example of spectra of comet C/2021 A1 obtained with CRIRES+. From top to bottom: spectra on the left side cover the water region (L3302–Order 19), while spectra on the right cover the methane region (L3302 – Order 17). For each plot, the top-most spectrum is the observed and total model (in red), the gray line below is the modeled transmittance. Each molecular model used to retrieve the presented production rates is shown in different colors and labeled accordingly. The bottom black line represents the fit residual, while the yellow lines are the ±1σ error. The gaps between the spectra are due to the gaps between the three detectors of CRIRES+. |
| In the text | |
|
Fig. 3 Detection of NH2 and OH* (prompt emission) in CRIRES+ spectra for the three observing dates; one unidentified feature is also visible (highlighted with a question mark). As in Fig. 2, the topmost is the observed spectrum and total model (in red), the gray line below is the modeled transmittance. Each molecular model used to retrieve the presented production rates is shown in different colors and labeled accordingly. The bottom black line represents the fit residual, while the yellow lines are the ±1σ error. |
| In the text | |
|
Fig. 4 Production rates of secondary species (upper four panels) and A(0)fρ dust activity proxy for R and RC filters (lowest panel) as measured during the TRAPPIST-South monitoring. It is possible to notice different outbursts indicated by vertical green arrows. Each observed radical is shown in a different color. Dates corresponding to CRIRES+ observations are indicated with hashed regions, and perihelion with a vertical dashed line. |
| In the text | |
|
Fig. 5 CH3OH Q-branch, H2CO, OH* prompt emission and HCl detection (after continuum subtraction) observed the second observing night (left) and fluorescence emission lines most likely due to HCl observed in order 16 (right) during the 01.01.2022 and 03.01.2022 (upper and lower panel, respectively) observing nights. The model (in red) fits the observed lines after the removal of the continuum. The line at about 2864.5 cm−1 is affected by atmospheric residual (the modeled transmittance is below the spectra in cyan), while the line at about 2838.5 cm−1 seems blended with another species. For all the plots, the yellow line indicates the ±1σ error. |
| In the text | |
|
Fig. 6 Comparison of measured mixing ratios in comet C/2021 A1 and the box statistic as described in Lippi et al. (2021). For each molecule indicated in the plot, the box is calculated as the range between the 25th and 75th percentiles, with the horizontal line representing the median value, computed considering 20 comets. C/2021 A1 data are in magenta, green, and blue for the first, second, and third observing date, respectively. |
| In the text | |
|
Fig. 7 Logarithm of the production rates and dust-to-gas ratios as a function of OH and CN over time around perihelion for comet C/2021 A1. The dust-to-gas ratio is indicated in cm/molecules/s. The mean values and ranges of abundance ratios corresponding to the typical comets taxonomic family, as defined by A’Hearn et al. (1995), are indicated in blue; the mean values and ranges for the carbon-depleted family are shown in green (only for C2). Outburst dates, indicated by blue arrows, are not correlated with significant changes in abundance ratios or dust-to-gas ratios. |
| In the text | |
Current usage metrics show cumulative count of Article Views (full-text article views including HTML views, PDF and ePub downloads, according to the available data) and Abstracts Views on Vision4Press platform.
Data correspond to usage on the plateform after 2015. The current usage metrics is available 48-96 hours after online publication and is updated daily on week days.
Initial download of the metrics may take a while.