Fig. 3
Download original image
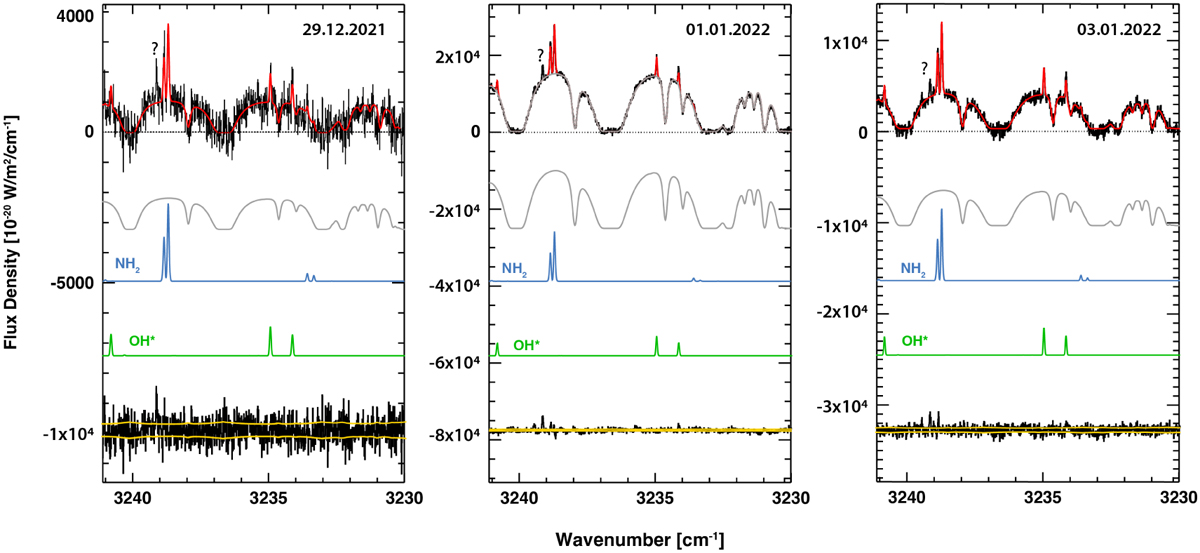
Detection of NH2 and OH* (prompt emission) in CRIRES+ spectra for the three observing dates; one unidentified feature is also visible (highlighted with a question mark). As in Fig. 2, the topmost is the observed spectrum and total model (in red), the gray line below is the modeled transmittance. Each molecular model used to retrieve the presented production rates is shown in different colors and labeled accordingly. The bottom black line represents the fit residual, while the yellow lines are the ±1σ error.
Current usage metrics show cumulative count of Article Views (full-text article views including HTML views, PDF and ePub downloads, according to the available data) and Abstracts Views on Vision4Press platform.
Data correspond to usage on the plateform after 2015. The current usage metrics is available 48-96 hours after online publication and is updated daily on week days.
Initial download of the metrics may take a while.