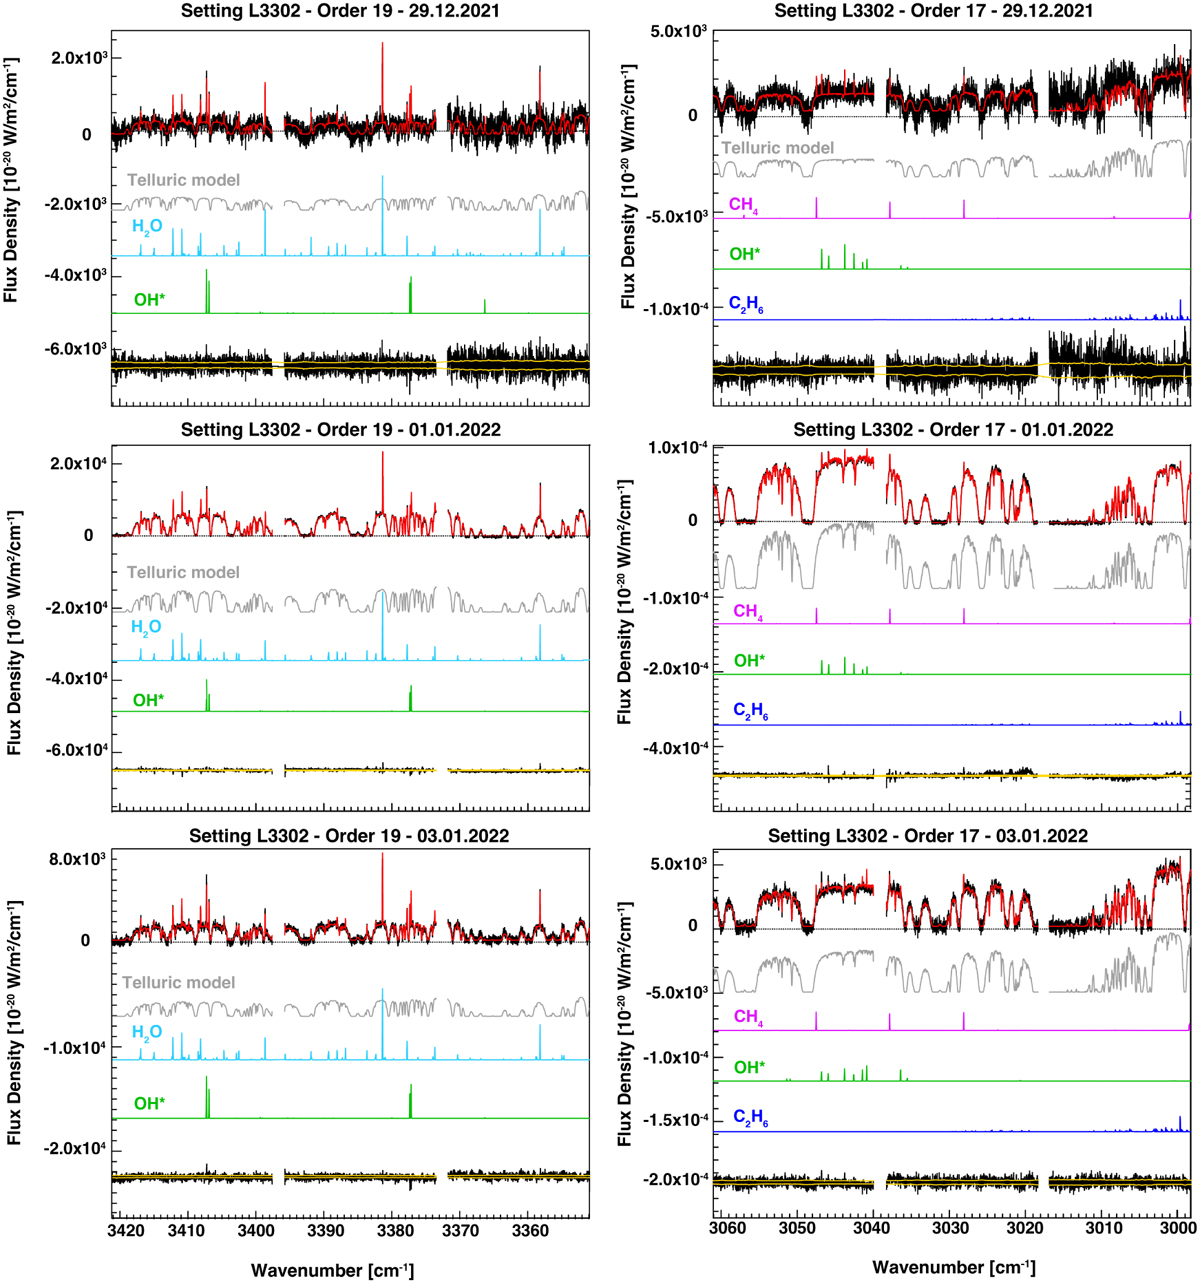
Fig. 2
Download original image
Example of spectra of comet C/2021 A1 obtained with CRIRES+. From top to bottom: spectra on the left side cover the water region (L3302–Order 19), while spectra on the right cover the methane region (L3302 – Order 17). For each plot, the top-most spectrum is the observed and total model (in red), the gray line below is the modeled transmittance. Each molecular model used to retrieve the presented production rates is shown in different colors and labeled accordingly. The bottom black line represents the fit residual, while the yellow lines are the ±1σ error. The gaps between the spectra are due to the gaps between the three detectors of CRIRES+.
Current usage metrics show cumulative count of Article Views (full-text article views including HTML views, PDF and ePub downloads, according to the available data) and Abstracts Views on Vision4Press platform.
Data correspond to usage on the plateform after 2015. The current usage metrics is available 48-96 hours after online publication and is updated daily on week days.
Initial download of the metrics may take a while.