Fig. 6
Download original image
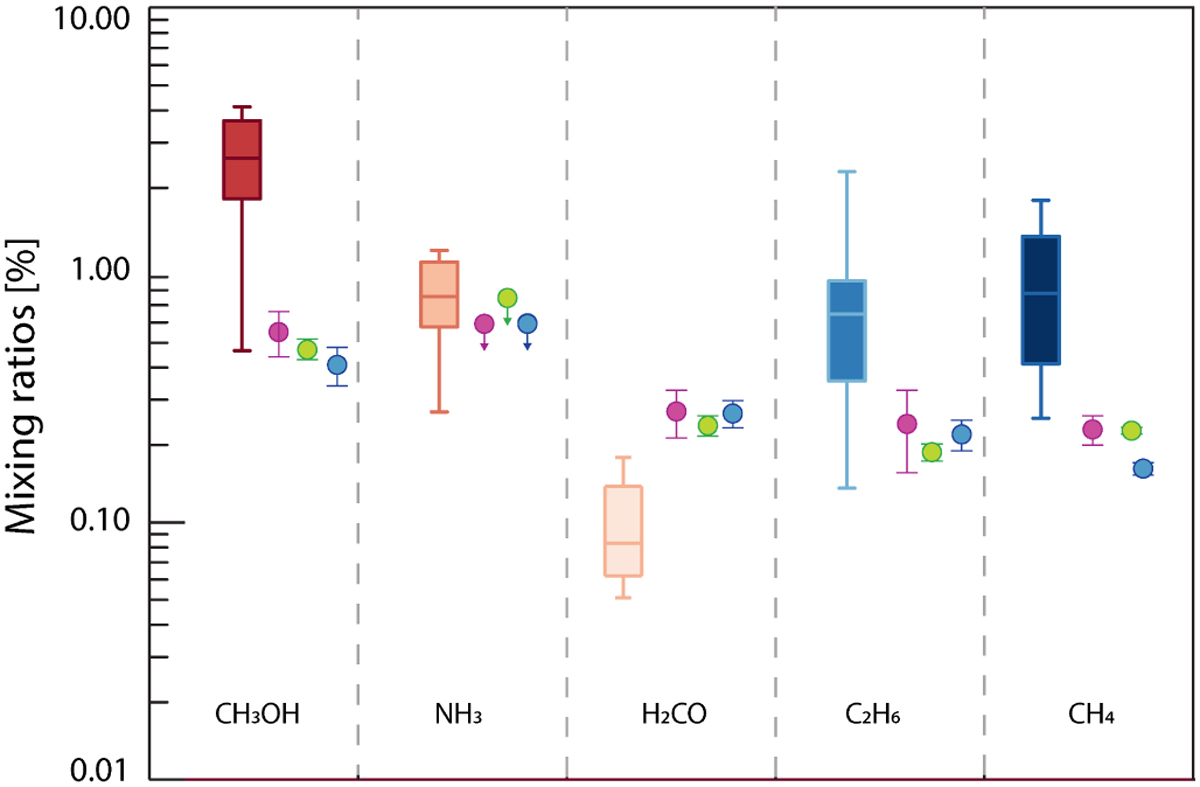
Comparison of measured mixing ratios in comet C/2021 A1 and the box statistic as described in Lippi et al. (2021). For each molecule indicated in the plot, the box is calculated as the range between the 25th and 75th percentiles, with the horizontal line representing the median value, computed considering 20 comets. C/2021 A1 data are in magenta, green, and blue for the first, second, and third observing date, respectively.
Current usage metrics show cumulative count of Article Views (full-text article views including HTML views, PDF and ePub downloads, according to the available data) and Abstracts Views on Vision4Press platform.
Data correspond to usage on the plateform after 2015. The current usage metrics is available 48-96 hours after online publication and is updated daily on week days.
Initial download of the metrics may take a while.