Fig. 7
Download original image
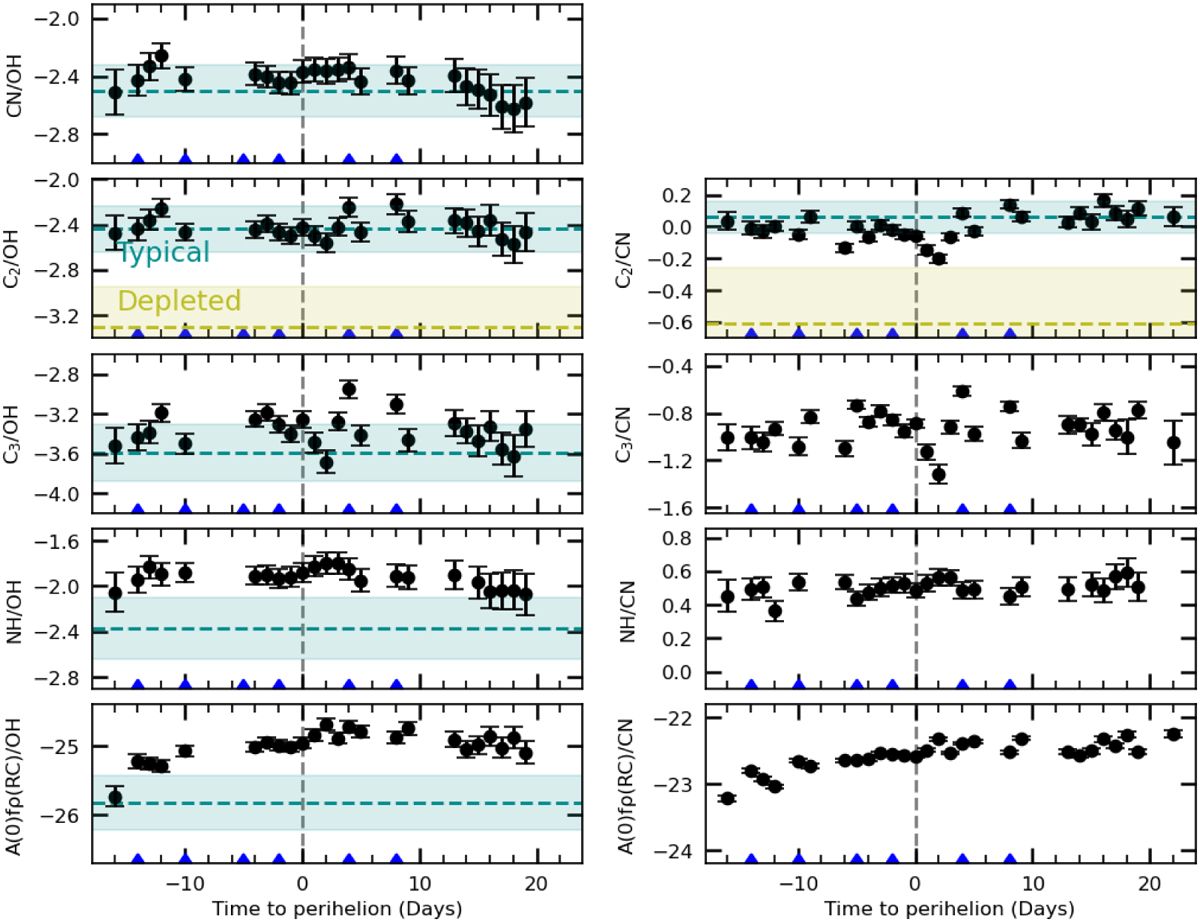
Logarithm of the production rates and dust-to-gas ratios as a function of OH and CN over time around perihelion for comet C/2021 A1. The dust-to-gas ratio is indicated in cm/molecules/s. The mean values and ranges of abundance ratios corresponding to the typical comets taxonomic family, as defined by A’Hearn et al. (1995), are indicated in blue; the mean values and ranges for the carbon-depleted family are shown in green (only for C2). Outburst dates, indicated by blue arrows, are not correlated with significant changes in abundance ratios or dust-to-gas ratios.
Current usage metrics show cumulative count of Article Views (full-text article views including HTML views, PDF and ePub downloads, according to the available data) and Abstracts Views on Vision4Press platform.
Data correspond to usage on the plateform after 2015. The current usage metrics is available 48-96 hours after online publication and is updated daily on week days.
Initial download of the metrics may take a while.