Fig. 4
Download original image
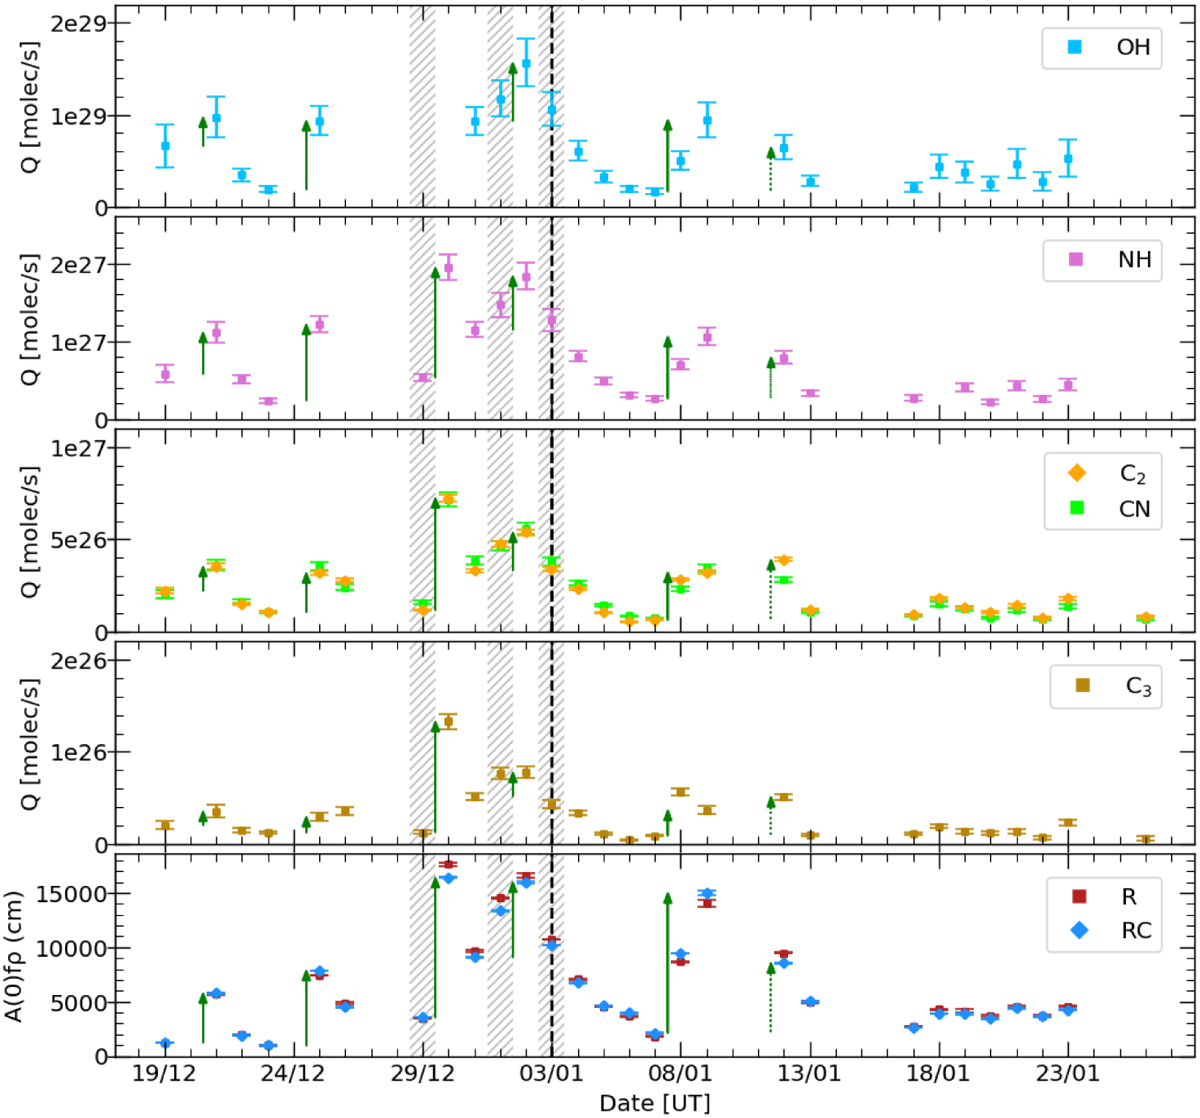
Production rates of secondary species (upper four panels) and A(0)fρ dust activity proxy for R and RC filters (lowest panel) as measured during the TRAPPIST-South monitoring. It is possible to notice different outbursts indicated by vertical green arrows. Each observed radical is shown in a different color. Dates corresponding to CRIRES+ observations are indicated with hashed regions, and perihelion with a vertical dashed line.
Current usage metrics show cumulative count of Article Views (full-text article views including HTML views, PDF and ePub downloads, according to the available data) and Abstracts Views on Vision4Press platform.
Data correspond to usage on the plateform after 2015. The current usage metrics is available 48-96 hours after online publication and is updated daily on week days.
Initial download of the metrics may take a while.