Fig. 5
Download original image
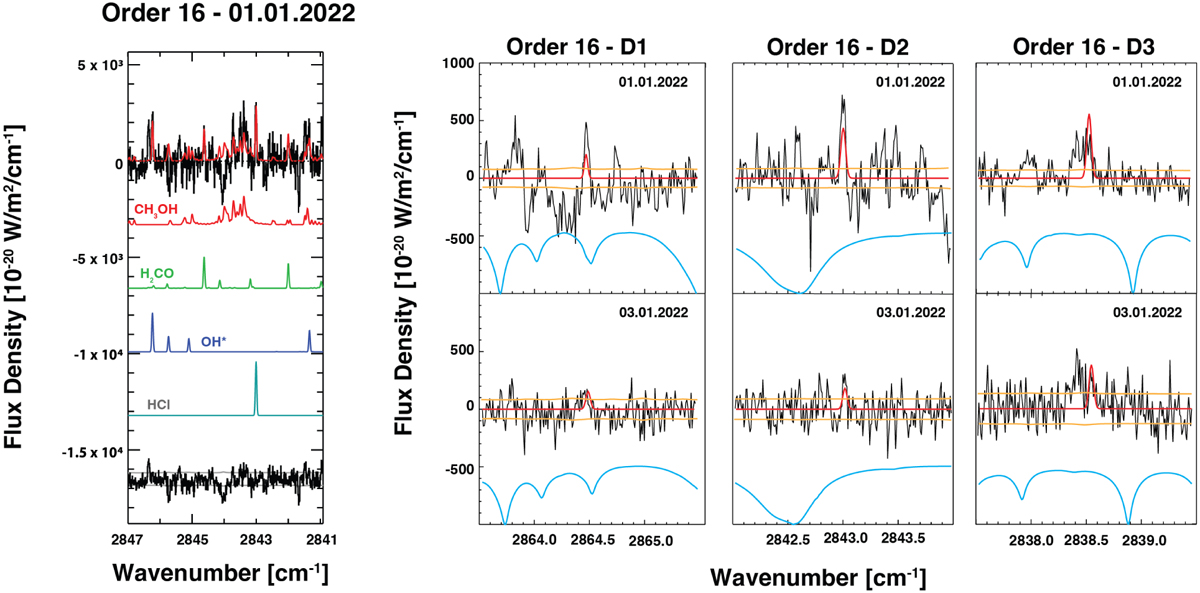
CH3OH Q-branch, H2CO, OH* prompt emission and HCl detection (after continuum subtraction) observed the second observing night (left) and fluorescence emission lines most likely due to HCl observed in order 16 (right) during the 01.01.2022 and 03.01.2022 (upper and lower panel, respectively) observing nights. The model (in red) fits the observed lines after the removal of the continuum. The line at about 2864.5 cm−1 is affected by atmospheric residual (the modeled transmittance is below the spectra in cyan), while the line at about 2838.5 cm−1 seems blended with another species. For all the plots, the yellow line indicates the ±1σ error.
Current usage metrics show cumulative count of Article Views (full-text article views including HTML views, PDF and ePub downloads, according to the available data) and Abstracts Views on Vision4Press platform.
Data correspond to usage on the plateform after 2015. The current usage metrics is available 48-96 hours after online publication and is updated daily on week days.
Initial download of the metrics may take a while.