Fig. 1
Download original image
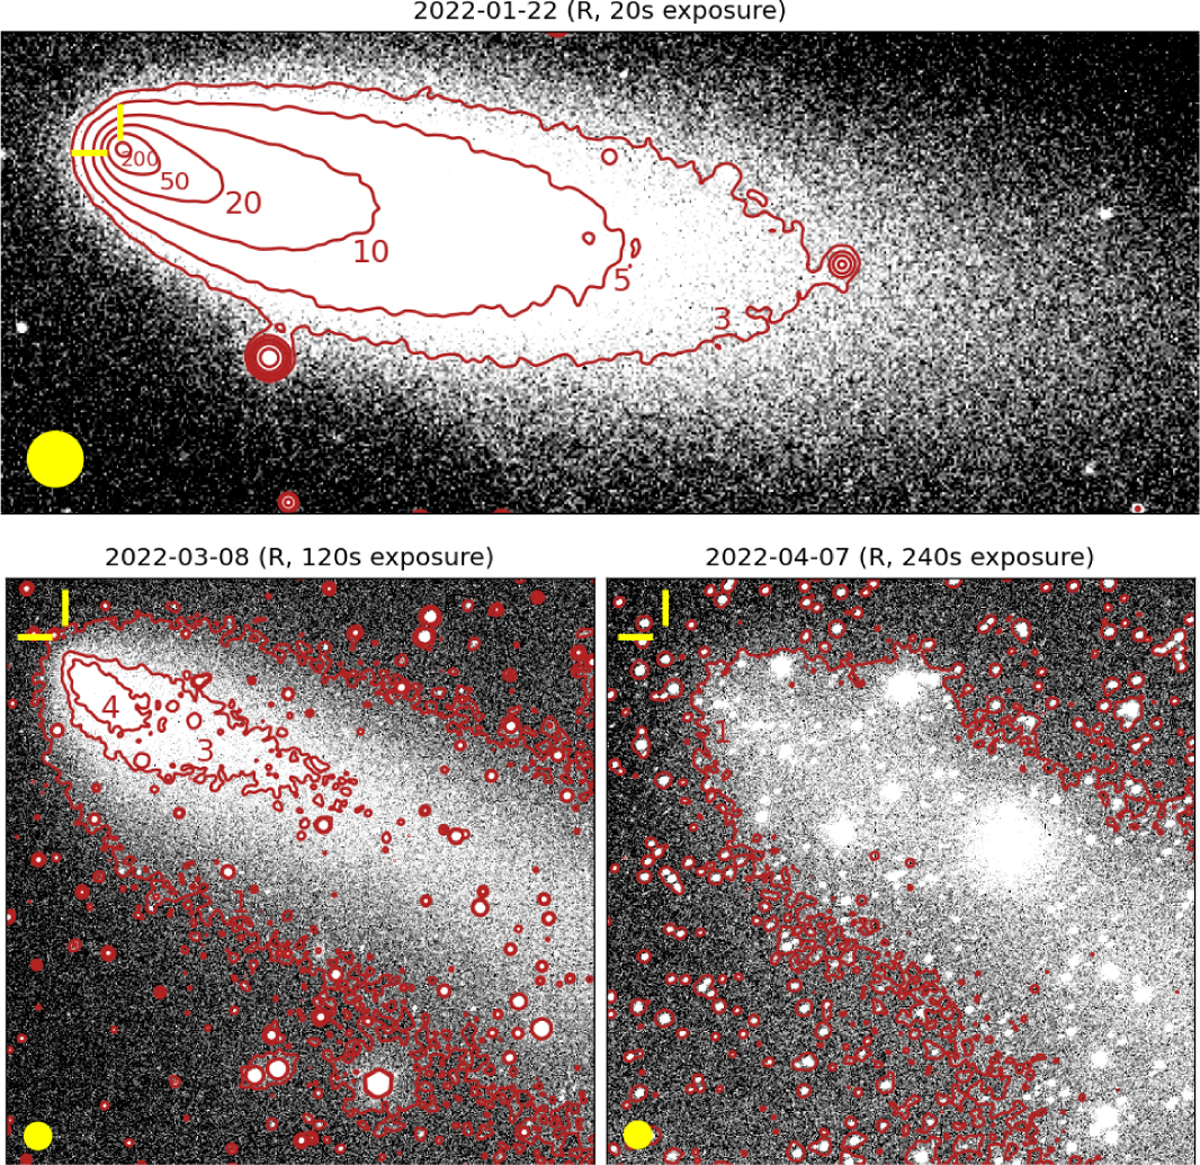
TRAPPIST-South images of C/2021 A1 taken between January and April 2022 showing the disruption of its nucleus. (Vander Donckt et al. 2022). Contours at different sigma levels (red) show dissipation of the dust after the disruption. While there is a well defined optocenter on January 22 with a > 500 sigma detection at the position computed by the NASA JPL Horizon API1 (indicated by a yellow cross), only a diffuse dust leftover without optocenter is observed on April 7, SouthEast of the NASA JPL Horizon-predicted position. March 8 shows an intermediate stage of the disruption. North is up and east is right, and a 30″ diameter yellow circle on the bottom left of the images indicates the scale.
Current usage metrics show cumulative count of Article Views (full-text article views including HTML views, PDF and ePub downloads, according to the available data) and Abstracts Views on Vision4Press platform.
Data correspond to usage on the plateform after 2015. The current usage metrics is available 48-96 hours after online publication and is updated daily on week days.
Initial download of the metrics may take a while.