| Issue |
A&A
Volume 674, June 2023
|
|
|---|---|---|
| Article Number | L15 | |
| Number of page(s) | 10 | |
| Section | Letters to the Editor | |
| DOI | https://doi.org/10.1051/0004-6361/202346702 | |
| Published online | 27 June 2023 | |
Letter to the Editor
A CO funnel in the Galactic centre: Molecular counterpart of the northern Galactic chimney
1
Max-Planck-Institut für Radioastronomie, auf dem Hügel 69, 53121 Bonn, Germany
e-mail: This email address is being protected from spambots. You need JavaScript enabled to view it.
2
I. Physikalisches Institut, Universität zu Käln, Zülpicher Str. 77, 50937 Köln, Germany
3
Instituto Multidisciplinario de Investigación y Postgrado, Universidad de La Serena, Raúl Bitrán 1305, La Serena, Chile
4
Departamento de Astronomía, Universidad de La Serena, Av. Cisternas 1200, La Serena, Chile
5
Institut für Theoretische Astrophysik, Zentrum für Astronomie, Universität Heidelberg, Albert-Ueberle-Str. 2, 69120 Heidelberg, Germany
6
Escuela de Ciencias Físicas y Nanotecnología, Universidad Yachay Tech, Hacienda San José s/n, 100119 Urcuquí, Ecuador
7
Hamburger Sternwarte, University of Hamburg, Gojenbergsweg 112, 21029 Hamburg, Germany
8
Jodrell Bank Centre for Astrophysics, Department of Physics and Astronomy, The University of Manchester, Manchester, M13 9PL
UK
Received:
19
April
2023
Accepted:
12
June
2023
Abstract
We report the discovery of a velocity coherent, funnel-shaped 13CO emission feature in the Galactic centre (GC) using data from the SEDIGISM survey. The molecular cloud appears as a low-velocity structure (VLSR = [ − 3.5, + 3.5] km s−1) with an angular extent of 0.95° ×1°, extending towards positive Galactic latitudes. The structure is offset from Sgr A* towards negative Galactic longitudes; it spatially and morphologically correlates well with the northern lobe of the 430 pc radio bubble, believed to be the radio counterpart of the multiwavelength GC chimney. Spectral line observations in the frequency range of 85–116 GHz have been carried out using the IRAM 30-m telescope towards 12 positions along the funnel-shaped emission. We examine the 12C/13C isotopic ratios using various molecules and their isotopologues. The mean 12C/13C isotope ratio (30.6 ± 2.9) is consistent with the structure located within inner 3 kpc of the Galaxy and possibly in the GC. The velocity of the molecular funnel is consistent with previous radio recombination line measurements of the northern lobe of radio bubble. Our multiwavelength analysis suggests that the funnel-shaped structure extending over 100 pc above the Galactic plane is the molecular counterpart of the northern GC chimney.
Key words: Galaxy: center / Galaxy: evolution / ISM: clouds / ISM: molecules / ISM: kinematics and dynamics
© The Authors 2023
 Open Access article, published by EDP Sciences, under the terms of the Creative Commons Attribution License (https://creativecommons.org/licenses/by/4.0), which permits unrestricted use, distribution, and reproduction in any medium, provided the original work is properly cited.
This article is published in open access under the Subscribe to Open model.
Open access funding provided by Max Planck Society.
1. Introduction
High-resolution observations of external galaxies reveal outflows from galactic nuclei that are driven either by a nuclear starburst or an active galactic nucleus (Cicone et al. 2014, 2016). These outflows extend from dense star-forming regions near the galactic mid-planes up to several kiloparsec away from them and are capable of ejecting ionised, atomic, and molecular gas from their host galaxies (Tumlinson et al. 2017). Hence, they are often considered a negative feedback process that contributes to the star formation quenching of a galaxy (Fabian 2012; Geach et al. 2014). Conversely, these outflows could constitute a positive trigger, with compression of gas within the outflows leading to gravitational collapse and subsequent star formation (Zubovas et al. 2013; Bieri et al. 2016). Radio observations of the Galactic centre (GC) region in the 1980s revealed evidence of a large-scale outflow from the GC. Emission extending several hundreds of parsec was identified (e.g., Scoville 1972; Kaifu et al. 1972; Sofue et al. 1989) that was believed to originate from the high-energy activity in the core of the Milky Way. This was later confirmed with the discovery of the Fermi bubbles, the bipolar lobes extending vertically up to 8 kpc, observed in the γ-ray bands (Su et al. 2010), which also have radio counterparts (Carretti et al. 2013). Predehl et al. (2020) reported the discovery of soft-X-ray emitting bubbles extending 14 kpc above and below the GC that are believed to originate in large energy injections from the GC. Other studies of the GC in X-ray bands uncovered two oppositely directed, 200 pc chimneys of hot plasma at the base of the Fermi bubbles (Bland-Hawthorn & Cohen 2003; Nakashima et al. 2013). Recently, Heywood et al. (2019) reported the discovery of radio counterparts at 1 GHz of these chimneys, extending to 430 pc in the vertical plane. Ponti et al. (2021) examined the spatial relationship between the emission observed in different wavebands. Based on H2 column density maps derived from Herschel dust continuum data, they also identified molecular gas within a few tens of parsecs above the GC that is interpreted as molecular gas outflowing within the chimneys. Their analysis revealed that the X-ray, radio, and infrared emissions are deeply interconnected, forming coherent features on scales of hundreds of parsecs, representing the channel connecting the quasi-continuous intermittent activity at the GC within the base of the Fermi bubbles. However, there are also studies that question the association of this structure with the GC. For example, Tsuboi et al. (2020) suggested that the western part of the northern lobe is an H II region located within a few kiloparsec from us (at a heliocentric distance of ∼2 kpc) and not in the GC region.
In this Letter we report the discovery of a prominent funnel-shaped CO emission feature in the GC extending spatially over 100 pc, in latitude and in longitude. We investigate the possible association of this cloud with the GC chimneys using CO data from APEX 12 m telescope, 3 mm molecular line data from IRAM 30 m telescope, and multiwavelength archival data. The details of our observations are described in Sect 2. The results are presented in Sects. 3 and 4 and discussed in Sect 5. Finally, in Sect. 6 we summarise our conclusions.
2. Observations and archival data
2.1. The SEDIGISM survey
The Structure, Excitation and Dynamics of the Inner Galactic Interstellar Medium (SEDIGISM; Schuller et al. 2017, 2021) is a survey that covers an 84 deg2 area of the inner Galactic plane (−60° < l < +31°,  5) in the J = 2 − 1 transition of 13CO and C18O isotopologues of the carbon monoxide molecule, which probe the moderately dense (n(H2)∼103 cm−3) component of the interstellar medium (ISM). The coverage is extended in latitude to
  0 around the GC (−2° < l < +1.5°). The observations were carried out with Swedish Heterodyne Facility Instrument (SHFI) at the Atacama Pathfinder Experiment 12-m submillimetre telescope (APEX; Güsten et al. 2006). The spectral and angular resolutions are 0.25 km s−1 and 30″, respectively; the pixel size is 9.5″; and the rms sensitivity is 0.9 K in main-beam brightness temperature units, TMB.
2.2. IRAM 3 mm observations
Observations of spectral lines in the 3 mm wavelength range were carried out using the Institut de Radioastronomie Millimétrique (IRAM) 30-m telescope during the period 2022 December 24–26 (Project ID: 144-22) with the Eight MIxer Receiver (EMIR; Carter et al. 2012). The position switching On–Off mode observations were performed with two frequency set-ups covering the range 84.9–116.7 GHz that allowed us to observe transitions of various molecular species. We used the FTS200 backend with a spectral resolution of 200 kHz (equivalent to 0.6 km s−1 at 3 mm) and the data reduction was performed using the Continuum and Line Analysis Single-dish Software (CLASS), which is part of the GILDAS software (Pety 2005).
3. Extended CO funnel-like structure near SgrA*
In order to search for a possible molecular counterpart of the northern Galactic chimney, we examined the 13CO (2–1) data from the SEDIGISM survey. In channel maps of the SEDIGISM data, we identify a prominent funnel-like feature centred at l ∼ 359.6°, within the GC region in the velocity range from −3.5 km s−1 to +3.5 km s−1 (see Fig. A.1). Figure 1 (left) shows the velocity integrated intensity map over the same velocity range. The emission resembles a funnel with an angular extent of 0.95° ×1°, narrower close to the Galactic plane (0.2° at b ∼ −0.2°) and wider at higher latitudes (0.9° at b ∼ 0.8°). The centroid of this structure is offset from Sgr A*. We call this feature the Galactic Centre Molecular Funnel (GCMF). In Fig. 1 (middle), we present the MeerKAT 1 GHz radio image from Heywood et al. (2019), which shows a 430 pc bipolar radio bubble associated with the GC chimney. The northern lobe of the bipolar bubble is asymmetric with respect to Sgr A*, shifted westwards, towards the fourth Galactic quadrant. Figure 1 (right) shows the Spitzer 24 μm mid-infrared (MIR) image of the GC where the MIR counterpart of the northern radio bubble is seen as filamentary structures extending up to 1° in latitude. Comparison of the GCMF with radio and MIR emission reveals that 13CO emission is spatially and morphologically well correlated with the northern lobe of the GC chimney. This is evident from Fig. 2 and from Fig. A.2. Finger-like protrusions are found around b ∼ 0.3°, pointing radially inwards towards the interior of the funnel. These fingers are observed in star-forming regions and Galactic supershells (e.g., Dawson 2013). They are thought to originate from the interaction of the expanding shock with pre-existing molecular clouds, caused by the Rayleigh-Taylor instability on the inner surface of the supershells. The resultant clumplets exposed to the hot high-velocity winds get subsequently evaporated and acquire a head-tail structure (Dawson et al. 2015).
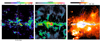 |
Fig. 1. Multiwavelength view of GC chimney. Left: SEDIGISM 13CO velocity integrated intensity map in the velocity range from −3.5 to 3.5 km s−1 showing the funnel-shaped CO feature known as the Galactic Centre Molecular Funnel, proposed as the molecular counterpart of the radio bubble. Middle: MeerKAT 1 GHz radio emission map towards the GC region (Heywood et al. 2022) showing the 430 pc bipolar radio bubble (Heywood et al. 2019). Right: Spitzer 24 μm warm dust emission. The IR counterpart of the northern lobe of the radio bubble (white dashed curves in middle and right panels) is seen as filamentary features extending to northern latitudes. |
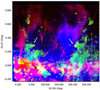 |
Fig. 2. Three-colour composite image showing the MeerKAT 1 GHz radio emission (red), SEDIGISM 13CO emission (green), and Spitzer 24 μm emission (blue). The 13CO emission contours are shown in yellow. The contour levels are 4, 6.5, 9, 14, and 20 K km s−1. The position of Sgr A* is marked with a cross (×). White arrows point to finger-like protrusions. |
4. Molecular line survey of the GCMF
To investigate the chemical properties of the GCMF, we carried out a molecular line survey of the GCMF at 3 mm using the IRAM 30 m telescope. For this, we selected 12 positions along the GCMF (see Fig. 3), targeting clumps of high 13CO emission intensity. We only considered positions above b > 0.08° to avoid strong contamination from the Galactic mid-plane. The observations reveal the rich chemistry of the GCMF. We present below some key first results, while a more comprehensive analysis will be presented in a future paper.
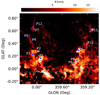 |
Fig. 3. 13CO integrated intensity map. The 12 positions used for the IRAM 3 mm line survey are marked. The cyan line shows the physical mid-plane of the Galaxy. |
4.1. 12C/13C isotope ratio
Important information on the chemical evolution of galaxies can be inferred from elemental isotopic abundance ratios. In particular, the 12C/13C ratio is an excellent probe for such studies as 12C is predicted to form predominantly in triple-alpha reactions in massive stars (Timmes et al. 1995), whereas 13C is a product of secondary processes such as the CNO-I cycle (in intermediate and massive stars), the burning of 12C in low-metallicity massive stars, and proton-capture nucleosynthesis in AGB stars (Meyer 1994; Langer et al. 1999; Meynet & Maeder 2002). Various studies have investigated variations in 12C/13C across the Galactic disc (Langer & Penzias 1990; Milam et al. 2005; Jacob et al. 2020; Yan et al. 2023). One common method is to measure the intensity ratio of 12C and 13C isotopologues of a molecule. A disadvantage is that the emission from more abundant (12C-bearing) species could be saturated, leading to underestimated isotope ratios. Another effect is chemical fractionation in which one isotope could be preferentially enriched compared to the other under certain conditions (Langer et al. 1984; Colzi et al. 2020; Jacob et al. 2020). Nevertheless, 12C/13C studies of Galactic clouds reveal that a systematic gradient exists in the Milky Way with the 12C/13C ratio steadily increasing with distance from the GC (e.g., Giannetti et al. 2014).
To investigate carbon isotopic ratios in the GCMF, we used intensity ratios of four molecular lines, 12C18O (1–0), 12CS (2–1), HN12C (1–0), and H12CO+ (1–0), and their 13C isotopologues. We consider all detections with a signal-to-noise ratio ≳2.5σ, where σ is the rms noise. Apart from the primary emission line of interest here at ∼0 km s−1, high-velocity components (| VLSR | > 100 km s−1) are also seen towards a few positions. Spectra of 12CS, 12C18O, H12CO+, HN12C, and their 13C isotopologues towards a few selected positions are shown in Figs. A.3–A.6. Table A.1 lists 12CS and 13CS line parameters for selected positions where both lines are detected. Similarly, the line parameters of the 12C18O and 13C18O lines are listed in Table A.2. Figure 4 (left) shows the 12C/13C line ratios of different species as a function of their velocities. Considering those components that are only associated with the GCMF (−3.5 ≤ VLSR ≤ 3.5 km s−1; see Fig. A.7), the intensity ratios for individual molecules are as follows: 12C18O/13C18O (26.2–36.5, mean = 32.1±3.1), 12CS/13CS (15.6–36.2, mean = 25.6±3.7), HN12C/HN13C (7.0–20.2, mean = 12.7±2.0), H12CO+/H13CO+ (1.8–12.1, mean = 7.1±1.0). The HN12C/HN13C and H12CO+/H13CO+ ratios are systematically lower than the 12C18O/13C18O and 12CS/13CS ratios derived at the same positions, and are less than half the standard value at the GC (∼25; Riquelme et al. 2010, and references therein). This implies that H12CO+ and HN12C are mostly optically thick.
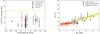 |
Fig. 4. Results of molecular line analysis of the GCMF. Left: 12C/13C ratio of various species vs corresponding cloud velocities. The yellow dotted line corresponds to a carbon isotope ratio of 24, the value expected at the GC. The dash-dotted line corresponds to 12C/13C = 40 and the dashed line corresponds to 12C/13C = 65, the carbon isotope ratio of the local ISM in the solar neighbourhood. Right: 12C/13C derived from I[C18O]/I[13C18O] (for GCMF; red triangles) as a function of galactocentric distance. Distances to cloud components are determined using the 12C/13C gradient across the Galaxy (Yan et al. 2023). The shaded area corresponds to the 1σ interval of the fit. The grey and black dots correspond to isotope ratios from C18O and its isotopologue from Giannetti et al. (2014) and Langer & Penzias (1990), respectively. |
The intensity ratios derived from the 12C18O and 12CS species are significantly lower than the 12C/13C ratio of the local ISM (∼65; see Table A.3). The ratios towards P1 and P9 estimated using 12CS is lower than that of 12C18O (< 20). Hence 12CS could be optically thick at these positions, whereas the ratios are similar to those derived from 12C18O at positions P2 and P6. In general, values derived using 12C18O are the most reliable estimates of carbon isotope ratios as 12C18O is ∼500 times less abundant than 12C16O (Bergin et al. 1997) and hence can safely be assumed to be optically thin. However, the isotope ratio derived from 12C18O and its isotopologue could suffer from fractionation effects. For example, Langer et al. (1984) studied the fractionation effects in dense molecular clouds and found that the carbon isotope ratios can be separated into three groups: (a) the CO group, (b) the HCO+ group, and (c) the carbon isotope pool group consisting of species such as CS and HCN. They concluded that for group (a) the abundance of 13CO is enhanced relative to that of 12CO at lower temperatures, densities, and high metal abundances, whereas 12C is enhanced for species belonging to group (c), the carbon isotope pool. On the other hand, selective photodissociation of 13CO can increase the 12C/13C ratio in diffuse clouds (Visser et al. 2009). Overall, intensity ratios of C18O and CS are consistent with each other, and thus we cannot find any significant evidence of these effects in the GCMF.
4.2. Distance estimates from carbon isotope ratio
For determining the distance to the GCMF, we only consider carbon isotope ratios derived from C18O/13C18O. Conversion of the 12C18O/13C18O intensity ratios to carbon isotopic ratios requires correcting for two factors: 1) the difference in frequency between the two isotopes leading to a difference in proportionality constant between column density and antenna temperature (Linke et al. 1977), which can be corrected by a multiplicative factor of 0.95 (Wilson et al. 1981); (2) opacity corrections for possible optical depth effects for 12C18O. Using J = 2–1 and J = 1–0 transitions of 12C18O and an LVG radiative transfer model, Langer & Penzias (1990) estimated opacity corrections towards a sample of interstellar clouds and found a typical correction of 5%. These are dense clouds that host high-mass star formation where the optical depth effects could play a more significant role compared to the GCMF. If we assume 5% as the upper limit to the opacity correction, this translates to a maximum isotope ratio uncertainty of ±1.5. To calculate the distance we use the corrected intensity ratios (i.e., 24.9–34.7 with a mean of 30.6±2.9). We apply the isotope gradient–Galactocentric distance relation derived by Yan et al. (2023)
 (1)
(1)
where RGC is the Galactocentric distance. We find RGC of GCMF in the range 0.9–2.9 kpc (see Fig. 4 (right)) with a mean  kpc (i.e., heliocentric distance D = 6.2 ± 0.6 kpc). Thus, the current analysis supports the association of the GCMF with the inner 3 kpc of the Galaxy. Using five complex molecules, Halfen et al. (2017) estimated the 12C/13C ratio towards the GC source SgrB2(N), which was found to range between 15 ± 5 and 33 ± 13, with an average value of 24 ± 7. Their mean estimate, within the uncertainties, is consistent with our estimate of the 12C/13C ratio. Hence, it is likely that the GCMF is located in the GC. However, we would like to caution that the obtained carbon isotope ratios could still suffer from isotopic fractionation effects. Follow-up observations are necessary to investigate these effects in detail.
5. Discussion
From its funnel-shaped morphology, spatial correlation with the northern lobe of the multiwavelength GC chimney, and chemical signatures supporting association with the GC, we believe that GCMF is tracing the molecular outflow from the centre of the Milky Way. The physical extent of the structure, as determined by the heliocentric distance derived from the mean isotope ratio (D = 6.2 kpc), is estimated to be ∼103 × 108 pc. If the GCMF is located at the GC (D = 8.2 kpc; Reid et al. 2019; GRAVITY Collaboration 2019), the physical size of the funnel is ∼130 × 145 pc. It is important to note that these measurements do not account for potential projection effects, suggesting that the derived sizes serve as lower limits. Overall, the structure appears to extend over 100 pc. Previous studies have identified atomic hydrogen (McClure-Griffiths et al. 2013) and molecular CO counterparts of the outflow from our Galactic nucleus. Di Teodoro et al. (2018) discovered a population of anomalous high-velocity HI clouds (VLSR ≤ 360 km s−1) extending to heights of 1.5 kpc (2.5° < | b | < 10°) from the Galactic plane, whose velocities deviate from purely circular Galactic rotation. These are explained as the relics of dense, cold, neutral gas blown away by the Galactic nuclear wind. CO emission (+160 < VLSR < 280 km s−1) associated with these high-velocity HI outflows has also been detected (Di Teodoro et al. 2020). The 13CO structure discovered in the SEDIGISM data is at lower latitudes and different velocities (−3.5 < VLSR < 3.5 km s−1), which raises the question of how it is related to the phenomena discussed above. Using radio recombination lines (RRLs), Law et al. (2009) studied the kinematics of the northern GC lobe. They found surprisingly low LSR velocities and velocity widths (VLSR: 0.4–1.7 km s−1, ΔV: 11.5–24.5 km s−1), and proposed that such low velocities could be explained by gas deceleration due to ambient magnetic fields. The CO observations towards the double helix nebula (DHN), believed to be a magnetically shaped feature at the GC (position P6 in Fig. 3) also show emission features at 0 km s−1 (Torii et al. 2014). The velocity of GCMF is in close agreement with the RRL velocity measurements of the GC lobe and molecular line velocities of the DHN. Several formation scenarios are possible. For example, the bubble could be (i) advected molecular gas outlining the base of the outflow (e.g. Walch et al. 2015), (ii) gas formed via shock compression, and/or (iii) material that has cooled down and is either outflowing or falling back onto the Galactic plane (Banda-Barragán et al. 2021). It is possible that the low-velocity low-latitude GCMF is much younger compared to the high-velocity higher-latitude outflows launched at a different epoch, and traces intermittent activity at the GC.
From Figs. 1 and 2 it is evident that the GCMF is closely associated with the radio emission from the northern lobe of the 430 pc bipolar radio bubble. Such geometries where CO outflow encases the ionising gas is similar to that observed in extragalactic nuclear outflows (e.g., Dall’Agnol de Oliveira et al. 2023). Moreover, several non-thermal radio filaments (NTFs; Yusef-Zadeh et al. 1984) are located within the cavity of the funnel. This indicates that the progenitor event is also a source of the relativistic particles required to power the NTFs. Heywood et al. (2019) suggested that the observed bipolar radio bubble could be a less energetic version of the event that generated the Fermi bubbles. Such events could be powered by past activity from the SgrA* (Zubovas et al. 2011; Zhang & Guo 2020) and/or supernova driven winds (Lacki 2014; Crocker et al. 2015). According to Sarkar et al. (2015), a star formation rate of ∼0.5 M⊙ yr−1 over a timescale of ∼30 Myr could produce Fermi-like bubbles. This is in agreement with the enhanced star formation rate of 0.2–0.8 M⊙ yr−1 observed towards the nuclear stellar disc over the past 30 Myr (Nogueras-Lara et al. 2020). Using 3D magnetohydrodynamic simulations, Zhang et al. (2021) investigated the origin of the 430 pc bipolar radio bubble. A magnetic field of 80 μG and a supernova rate of 1 kyr−1 reproduced the observed morphology, internal energy, and X-ray luminosity of the bubbles after an evolutionary time of 330 kyr. This model could also explain a fraction of the NTFs that are believed to originate within mutual collisions between the shock waves of the individual supernovae. Yusef-Zadeh et al. (2023) have classified NTFs into two distinct categories: long NTFs with non-thermal spectral indices, oriented perpendicular to the Galactic plane, and short NTFs with thermal spectral indices aligned parallel to the plane. The origin of long NTFs is attributed to a large-scale Galactic wind that created bipolar radio bubbles, which is consistent with the discussed scenario.
Assuming that the funnel-shaped morphology is due to gas expansion out of the plane, we expect the base of the funnel to be anchored in the Galactic mid-plane. In this scenario the narrowest parts of the funnel are high-density regions in the Galactic plane and the widest parts are regions of low-density gas in free expansion. The base of the GCMF is located at b = −0.16° (Fig. 2). Thus, at a distance of 8.2 kpc, it is located at 16 pc below SgrA* (see Fig. 3). There are two possibilities for the observed shift with respect to Sgr A*. In scenario (a) the funnel is tilted towards our line of sight so that the base appears at a lower latitude than its true position without the tilt (see Fig. 5); in scenario (b) the funnel is located in front of the GC. The IAU mid-plane is tilted (θtilt = 0.12°) with respect to the true mid-plane (Goodman et al. 2014). Correcting for the Sun’s height above the plane (zSun ∼ 25 pc) and tilt of the IAU plane, we find that the true mid-plane is located at a distance of D ∼ 5.2 kpc for b = −0.16°. This would suggest that the GCMF is located at RGC = 3 kpc. A combination of the two scenarios is possible as well. However, the possibility of the GCMF being a local cloud with the current assumptions is unlikely as at a heliocentric distance of 2 kpc the base of the GCMF should appear at b = −0.6°. The northern chimney is observed as a silhouette against the low-frequency radio emission. Based on this, Ponti et al. (2021) suggested that the chimney is rooted at the GC, but is significantly tilted towards us, which is in agreement with scenario (a). To summarise, our analysis favours GCMF to be located within the inner 3 kpc of the GC. With the data presented in this paper, we are currently unable to confirm whether the outflow has a southern counterpart as the CO emission is contaminated by emission from foreground star-forming regions at negative Galactic latitudes, whereas the northern lobe experiences minimal contamination as it extended towards positive latitudes. Galactic outflows tend to be bipolar, and we are carrying out further investigations to find signatures of a southern lobe.
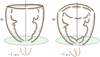 |
Fig. 5. Pictorial representation of the molecular funnel: (a) without tilt; (b) tilted towards the observer’s line of sight so that the base of the funnel appears to be lower than its true position. |
6. Conclusions
We have identified a 136 × 144 pc213CO(2–1) Galactic Centre Molecular Funnel (GCMF). The GCMF extends up to 150 pc above the Galactic plane and is asymmetric with respect to SgrA*, shifted to negative longitudes. The velocity of the gas in the GCMF ranges from −3.5 to 3.5 km s−1 and is consistent with the velocity of the ionised gas associated with the northern GC lobe estimated using RRLs. The 12C/13C isotope ratio (24.9–34.7; mean = 30.6 ± 2.9) is consistent with the structure located at the GC or within the inner 3 kpc of the Galaxy. The GCMF appears to encompass radio and MIR emission corresponding to the northern lobe of the GC chimney and has finger-like protrusions radially pointed inwards indicating their origin is related to a GC outflow in which molecular gas can emerge via dense gas advection, shock compression, cooling flows, or a combination of the three. Combining our observational results with previous studies, we propose that the GCMF is the molecular counterpart of the northern Galactic chimney. This gives us a unique opportunity to study the properties of molecular gas associated with the GC chimney, which can also be used as a local template to understand the chemistry of nuclear outflows in external galaxies.
Acknowledgments
We thank the referee for the valuable comments and suggestions that improved the quality of the paper. We thank the staff of IRAM 30m telescope for their excellent support. This publication is based on data acquired with the Atacama Pathfinder Experiment (APEX) under programmes 092.F-9315 and 193.C-0584. APEX is a collaboration among the Max-Planck-Institut fur Radioastronomie, the European Southern Observatory, and the Onsala Space Observatory. The processed data products are available from the SEDIGISM survey database located at https://sedigism.mpifr-bonn.mpg.de/index.html, which was constructed by James Urquhart and hosted by the Max Planck Institute for Radio Astronomy. This work is based in part on observations made with the Spitzer Space Telescope, which was operated by the Jet Propulsion Laboratory, California Institute of Technology under a contract with NASA. This work make use of data from MeerKAT telescope. The MeerKAT telescope is operated by the South African Radio Astronomy Observatory, which is a facility of the National Research Foundation, an agency of the Department of Science and Innovation.
References
- Banda-Barragán, W. E., Brüggen, M., Heesen, V., et al. 2021, MNRAS, 506, 5658 [CrossRef] [Google Scholar]
- Bergin, E. A., Goldsmith, P. F., Snell, R. L., & Langer, W. D. 1997, ApJ, 482, 285 [NASA ADS] [CrossRef] [Google Scholar]
- Bieri, R., Dubois, Y., Silk, J., Mamon, G. A., & Gaibler, V. 2016, MNRAS, 455, 4166 [NASA ADS] [CrossRef] [Google Scholar]
- Bland-Hawthorn, J., & Cohen, M. 2003, ApJ, 582, 246 [Google Scholar]
- Carretti, E., Crocker, R. M., Staveley-Smith, L., et al. 2013, Nature, 493, 66 [NASA ADS] [CrossRef] [Google Scholar]
- Carter, M., Lazareff, B., Maier, D., et al. 2012, A&A, 538, A89 [NASA ADS] [CrossRef] [EDP Sciences] [Google Scholar]
- Cicone, C., Maiolino, R., Sturm, E., et al. 2014, A&A, 562, A21 [NASA ADS] [CrossRef] [EDP Sciences] [Google Scholar]
- Cicone, C., Maiolino, R., & Marconi, A. 2016, A&A, 588, A41 [NASA ADS] [CrossRef] [EDP Sciences] [Google Scholar]
- Colzi, L., Sipilä, O., Roueff, E., Caselli, P., & Fontani, F. 2020, A&A, 640, A51 [NASA ADS] [CrossRef] [EDP Sciences] [Google Scholar]
- Crocker, R. M., Bicknell, G. V., Taylor, A. M., & Carretti, E. 2015, ApJ, 808, 107 [NASA ADS] [CrossRef] [Google Scholar]
- Dall’Agnol de Oliveira, B., Storchi-Bergmann, T., Morganti, R., Riffel, R. A., & Ramakrishnan, V. 2023, MNRAS, 522, 3753 [CrossRef] [Google Scholar]
- Dawson, J. R. 2013, PASA, 30, e025 [NASA ADS] [CrossRef] [Google Scholar]
- Dawson, J. R., Ntormousi, E., Fukui, Y., Hayakawa, T., & Fierlinger, K. 2015, ApJ, 799, 64 [NASA ADS] [CrossRef] [Google Scholar]
- Di Teodoro, E. M., McClure-Griffiths, N. M., Lockman, F. J., et al. 2018, ApJ, 855, 33 [Google Scholar]
- Di Teodoro, E. M., McClure-Griffiths, N. M., Lockman, F. J., & Armillotta, L. 2020, Nature, 584, 364 [NASA ADS] [CrossRef] [Google Scholar]
- Fabian, A. C. 2012, ARA&A, 50, 455 [Google Scholar]
- Geach, J. E., Hickox, R. C., Diamond-Stanic, A. M., et al. 2014, Nature, 516, 68 [NASA ADS] [CrossRef] [Google Scholar]
- Giannetti, A., Wyrowski, F., Brand, J., et al. 2014, A&A, 570, A65 [NASA ADS] [CrossRef] [EDP Sciences] [Google Scholar]
- Goodman, A. A., Alves, J., Beaumont, C. N., et al. 2014, ApJ, 797, 53 [CrossRef] [Google Scholar]
- GRAVITY Collaboration (Abuter, R., et al.) 2019, A&A, 625, L10 [NASA ADS] [CrossRef] [EDP Sciences] [Google Scholar]
- Güsten, R., Nyman, L. Å., Schilke, P., et al. 2006, A&A, 454, L13 [NASA ADS] [CrossRef] [EDP Sciences] [Google Scholar]
- Halfen, D. T., Woolf, N. J., & Ziurys, L. M. 2017, ApJ, 845, 158 [Google Scholar]
- Heywood, I., Camilo, F., Cotton, W. D., et al. 2019, Nature, 573, 235 [Google Scholar]
- Heywood, I., Rammala, I., Camilo, F., et al. 2022, ApJ, 925, 165 [NASA ADS] [CrossRef] [Google Scholar]
- Jacob, A. M., Menten, K. M., Wiesemeyer, H., et al. 2020, A&A, 640, A125 [EDP Sciences] [Google Scholar]
- Kaifu, N., Kato, T., & Iguchi, T. 1972, Nat. Phys. Sci., 238, 105 [Google Scholar]
- Lacki, B. C. 2014, MNRAS, 444, L39 [NASA ADS] [CrossRef] [Google Scholar]
- Langer, W. D., & Penzias, A. A. 1990, ApJ, 357, 477 [Google Scholar]
- Langer, N., Heger, A., Wellstein, S., & Herwig, F. 1999, A&A, 346, L37 [Google Scholar]
- Langer, W. D., Graedel, T. E., Frerking, M. A., & Armentrout, P. B. 1984, ApJ, 277, 581 [Google Scholar]
- Law, C. J., Backer, D., Yusef-Zadeh, F., & Maddalena, R. 2009, ApJ, 695, 1070 [NASA ADS] [CrossRef] [Google Scholar]
- Linke, R. A., Goldsmith, P. F., Wannier, P. G., Wilson, R. W., & Penzias, A. A. 1977, ApJ, 214, 50 [NASA ADS] [CrossRef] [Google Scholar]
- McClure-Griffiths, N. M., Green, J. A., Hill, A. S., et al. 2013, ApJ, 770, L4 [Google Scholar]
- Meyer, B. S. 1994, ARA&A, 32, 153 [NASA ADS] [CrossRef] [Google Scholar]
- Meynet, G., & Maeder, A. 2002, A&A, 390, 561 [NASA ADS] [CrossRef] [EDP Sciences] [Google Scholar]
- Milam, S. N., Savage, C., Brewster, M. A., Ziurys, L. M., & Wyckoff, S. 2005, ApJ, 634, 1126 [Google Scholar]
- Nakashima, S., Nobukawa, M., Uchida, H., et al. 2013, ApJ, 773, 20 [Google Scholar]
- Nogueras-Lara, F., Schödel, R., Gallego-Calvente, A. T., et al. 2020, Nat. Astron., 4, 377 [Google Scholar]
- Pety, J. 2005, in SF2A-2005: Semaine de l’Astrophysique Francaise, eds. F. Casoli, T. Contini, J. M. Hameury, & L. Pagani, 721 [Google Scholar]
- Ponti, G., Morris, M. R., Churazov, E., Heywood, I., & Fender, R. P. 2021, A&A, 646, A66 [NASA ADS] [CrossRef] [EDP Sciences] [Google Scholar]
- Predehl, P., Sunyaev, R. A., Becker, W., et al. 2020, Nature, 588, 227 [CrossRef] [Google Scholar]
- Reid, M. J., Menten, K. M., Brunthaler, A., et al. 2019, ApJ, 885, 131 [Google Scholar]
- Riquelme, D., Amo-Baladrón, M. A., Martín-Pintado, J., et al. 2010, A&A, 523, A51 [NASA ADS] [CrossRef] [EDP Sciences] [Google Scholar]
- Sarkar, K. C., Nath, B. B., & Sharma, P. 2015, MNRAS, 453, 3827 [Google Scholar]
- Schuller, F., Csengeri, T., Urquhart, J. S., et al. 2017, A&A, 601, A124 [NASA ADS] [CrossRef] [EDP Sciences] [Google Scholar]
- Schuller, F., Urquhart, J. S., Csengeri, T., et al. 2021, MNRAS, 500, 3064 [Google Scholar]
- Scoville, N. Z. 1972, ApJ, 175, L127 [Google Scholar]
- Sofue, Y., Reich, W., & Reich, P. 1989, ApJ, 341, L47 [Google Scholar]
- Su, M., Slatyer, T. R., & Finkbeiner, D. P. 2010, ApJ, 724, 1044 [Google Scholar]
- Timmes, F. X., Woosley, S. E., & Weaver, T. A. 1995, ApJS, 98, 617 [NASA ADS] [CrossRef] [Google Scholar]
- Torii, K., Enokiya, R., Morris, M. R., et al. 2014, ApJS, 213, 8 [Google Scholar]
- Tsuboi, M., Tsutsumi, T., Kitamura, Y., et al. 2020, PASJ, 72, L10 [NASA ADS] [CrossRef] [Google Scholar]
- Tumlinson, J., Peeples, M. S., & Werk, J. K. 2017, ARA&A, 55, 389 [Google Scholar]
- Visser, R., van Dishoeck, E. F., & Black, J. H. 2009, A&A, 503, 323 [NASA ADS] [CrossRef] [EDP Sciences] [Google Scholar]
- Walch, S., Girichidis, P., Naab, T., et al. 2015, MNRAS, 454, 238 [Google Scholar]
- Wilson, R. W., Langer, W. D., & Goldsmith, P. F. 1981, ApJ, 243, L47 [NASA ADS] [CrossRef] [Google Scholar]
- Yan, Y. T., Henkel, C., Kobayashi, C., et al. 2023, A&A, 670, A98 [NASA ADS] [CrossRef] [EDP Sciences] [Google Scholar]
- Yusef-Zadeh, F., Morris, M., & Chance, D. 1984, Nature, 310, 557 [NASA ADS] [CrossRef] [Google Scholar]
- Yusef-Zadeh, F., Arendt, R. G., Wardle, M., & Heywood, I. 2023, ApJ, 949, L31 [NASA ADS] [CrossRef] [Google Scholar]
- Zhang, M., Li, Z., & Morris, M. R. 2021, ApJ, 913, 68 [NASA ADS] [CrossRef] [Google Scholar]
- Zhang, R., & Guo, F. 2020, ApJ, 894, 117 [Google Scholar]
- Zubovas, K., King, A. R., & Nayakshin, S. 2011, MNRAS, 415, L21 [Google Scholar]
- Zubovas, K., Nayakshin, S., King, A., & Wilkinson, M. 2013, MNRAS, 433, 3079 [Google Scholar]
Appendix A: Additional figures and tables
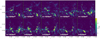 |
Fig. A.1. SEDIGISM 13CO channel maps in the velocity range –5.6 to 3.4 km s−1 showing the funnel-shaped molecular feature in the GC. |
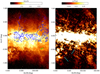 |
Fig. A.2. Infrared emission from the GC. (Left) Spitzer 8 μm emission overlaid with 13CO contours. The contour level is 4 K kms−1. The green arrow points to part of the southern lobe of the bipolar chimney. (Right) Herschel 70 μm emission. The cyan arrows point to foreground H II regions. |
 |
Fig. A.3. Spectra of CS and 13CS J = 2 − 1 emission towards four positions along the GCMF restricted to a velocity range of −30 to 30 km s−1 for better visualisation of the emission features. 13CS spectra are scaled by a factor of 6. The blue dashed line corresponds to the peak of the 13CS line. |
 |
Fig. A.4. Spectra of C18O and 13C18O J = 1 − 0 emission towards eight positions along the GCMF restricted to a velocity range of −30 to 30 km s−1 for better visualisation of the emission features. The 13C18O spectra are scaled by a factor of 6. The blue dashed line corresponds to the peak of the 13C18O line. |
 |
Fig. A.5. Spectra of HCO+ and H13CO+J = 1 − 0 emission towards eight positions along the GCMF restricted to a velocity range of −30 to 30 km s−1 for better visualisation of the emission features. The 13C18O spectra are scaled by a factor of 3. The blue dashed line corresponds to the peak of the H13CO+ line. |
 |
Fig. A.6. Spectra of HNC and HN13C J = 1 − 0 emission towards four positions along the GCMF restricted to a velocity range of −30 to 30 km s−1 for better visualisation of the emission features. The 13CS spectra are scaled by a factor of 3. The blue dashed line corresponds to the peak of the HN13C line. |
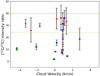 |
Fig. A.7. Zoomed-in view of Fig. 4(Left) in the velocity range -5 to 5 km s−1 showing carbon isotope ratio of components belonging to GCMF. |
Line parameters for CS and 13CS*.
Line parameters for C18O and 13C18O*.
Derived carbon isotope ratios towards GCMF based on C18O and CS and their isotopologues.
All Tables
Derived carbon isotope ratios towards GCMF based on C18O and CS and their isotopologues.
All Figures
|
Fig. 1. Multiwavelength view of GC chimney. Left: SEDIGISM 13CO velocity integrated intensity map in the velocity range from −3.5 to 3.5 km s−1 showing the funnel-shaped CO feature known as the Galactic Centre Molecular Funnel, proposed as the molecular counterpart of the radio bubble. Middle: MeerKAT 1 GHz radio emission map towards the GC region (Heywood et al. 2022) showing the 430 pc bipolar radio bubble (Heywood et al. 2019). Right: Spitzer 24 μm warm dust emission. The IR counterpart of the northern lobe of the radio bubble (white dashed curves in middle and right panels) is seen as filamentary features extending to northern latitudes. |
| In the text | |
|
Fig. 2. Three-colour composite image showing the MeerKAT 1 GHz radio emission (red), SEDIGISM 13CO emission (green), and Spitzer 24 μm emission (blue). The 13CO emission contours are shown in yellow. The contour levels are 4, 6.5, 9, 14, and 20 K km s−1. The position of Sgr A* is marked with a cross (×). White arrows point to finger-like protrusions. |
| In the text | |
|
Fig. 3. 13CO integrated intensity map. The 12 positions used for the IRAM 3 mm line survey are marked. The cyan line shows the physical mid-plane of the Galaxy. |
| In the text | |
|
Fig. 4. Results of molecular line analysis of the GCMF. Left: 12C/13C ratio of various species vs corresponding cloud velocities. The yellow dotted line corresponds to a carbon isotope ratio of 24, the value expected at the GC. The dash-dotted line corresponds to 12C/13C = 40 and the dashed line corresponds to 12C/13C = 65, the carbon isotope ratio of the local ISM in the solar neighbourhood. Right: 12C/13C derived from I[C18O]/I[13C18O] (for GCMF; red triangles) as a function of galactocentric distance. Distances to cloud components are determined using the 12C/13C gradient across the Galaxy (Yan et al. 2023). The shaded area corresponds to the 1σ interval of the fit. The grey and black dots correspond to isotope ratios from C18O and its isotopologue from Giannetti et al. (2014) and Langer & Penzias (1990), respectively. |
| In the text | |
|
Fig. 5. Pictorial representation of the molecular funnel: (a) without tilt; (b) tilted towards the observer’s line of sight so that the base of the funnel appears to be lower than its true position. |
| In the text | |
|
Fig. A.1. SEDIGISM 13CO channel maps in the velocity range –5.6 to 3.4 km s−1 showing the funnel-shaped molecular feature in the GC. |
| In the text | |
|
Fig. A.2. Infrared emission from the GC. (Left) Spitzer 8 μm emission overlaid with 13CO contours. The contour level is 4 K kms−1. The green arrow points to part of the southern lobe of the bipolar chimney. (Right) Herschel 70 μm emission. The cyan arrows point to foreground H II regions. |
| In the text | |
|
Fig. A.3. Spectra of CS and 13CS J = 2 − 1 emission towards four positions along the GCMF restricted to a velocity range of −30 to 30 km s−1 for better visualisation of the emission features. 13CS spectra are scaled by a factor of 6. The blue dashed line corresponds to the peak of the 13CS line. |
| In the text | |
|
Fig. A.4. Spectra of C18O and 13C18O J = 1 − 0 emission towards eight positions along the GCMF restricted to a velocity range of −30 to 30 km s−1 for better visualisation of the emission features. The 13C18O spectra are scaled by a factor of 6. The blue dashed line corresponds to the peak of the 13C18O line. |
| In the text | |
|
Fig. A.5. Spectra of HCO+ and H13CO+J = 1 − 0 emission towards eight positions along the GCMF restricted to a velocity range of −30 to 30 km s−1 for better visualisation of the emission features. The 13C18O spectra are scaled by a factor of 3. The blue dashed line corresponds to the peak of the H13CO+ line. |
| In the text | |
|
Fig. A.6. Spectra of HNC and HN13C J = 1 − 0 emission towards four positions along the GCMF restricted to a velocity range of −30 to 30 km s−1 for better visualisation of the emission features. The 13CS spectra are scaled by a factor of 3. The blue dashed line corresponds to the peak of the HN13C line. |
| In the text | |
|
Fig. A.7. Zoomed-in view of Fig. 4(Left) in the velocity range -5 to 5 km s−1 showing carbon isotope ratio of components belonging to GCMF. |
| In the text | |
Current usage metrics show cumulative count of Article Views (full-text article views including HTML views, PDF and ePub downloads, according to the available data) and Abstracts Views on Vision4Press platform.
Data correspond to usage on the plateform after 2015. The current usage metrics is available 48-96 hours after online publication and is updated daily on week days.
Initial download of the metrics may take a while.