Open Access
Fig. A.2.
Download original image
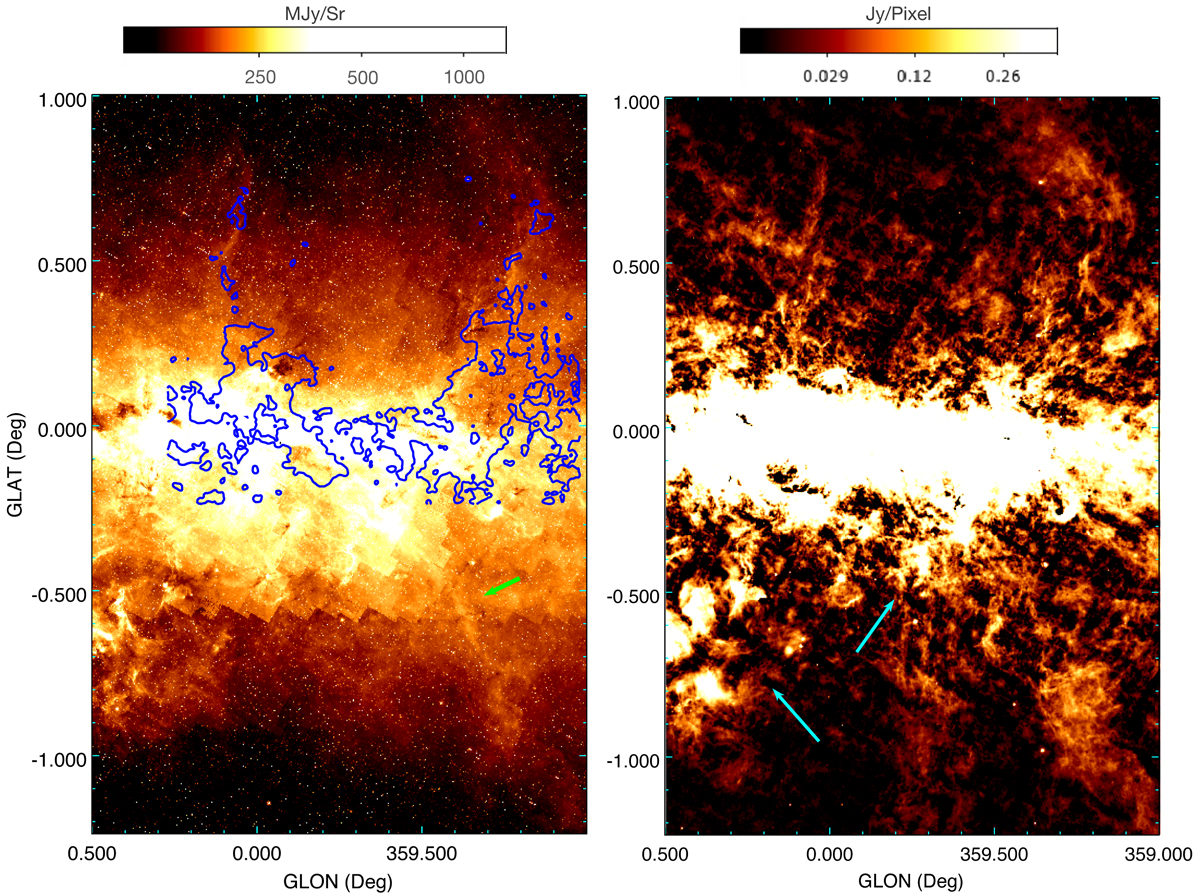
Infrared emission from the GC. (Left) Spitzer 8 μm emission overlaid with 13CO contours. The contour level is 4 K kms−1. The green arrow points to part of the southern lobe of the bipolar chimney. (Right) Herschel 70 μm emission. The cyan arrows point to foreground H II regions.
Current usage metrics show cumulative count of Article Views (full-text article views including HTML views, PDF and ePub downloads, according to the available data) and Abstracts Views on Vision4Press platform.
Data correspond to usage on the plateform after 2015. The current usage metrics is available 48-96 hours after online publication and is updated daily on week days.
Initial download of the metrics may take a while.