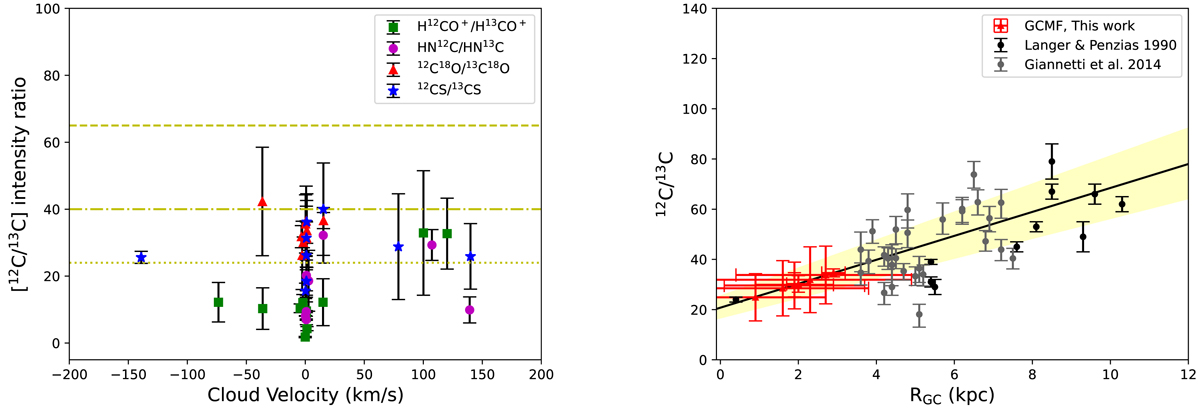
Fig. 4.
Download original image
Results of molecular line analysis of the GCMF. Left: 12C/13C ratio of various species vs corresponding cloud velocities. The yellow dotted line corresponds to a carbon isotope ratio of 24, the value expected at the GC. The dash-dotted line corresponds to 12C/13C = 40 and the dashed line corresponds to 12C/13C = 65, the carbon isotope ratio of the local ISM in the solar neighbourhood. Right: 12C/13C derived from I[C18O]/I[13C18O] (for GCMF; red triangles) as a function of galactocentric distance. Distances to cloud components are determined using the 12C/13C gradient across the Galaxy (Yan et al. 2023). The shaded area corresponds to the 1σ interval of the fit. The grey and black dots correspond to isotope ratios from C18O and its isotopologue from Giannetti et al. (2014) and Langer & Penzias (1990), respectively.
Current usage metrics show cumulative count of Article Views (full-text article views including HTML views, PDF and ePub downloads, according to the available data) and Abstracts Views on Vision4Press platform.
Data correspond to usage on the plateform after 2015. The current usage metrics is available 48-96 hours after online publication and is updated daily on week days.
Initial download of the metrics may take a while.