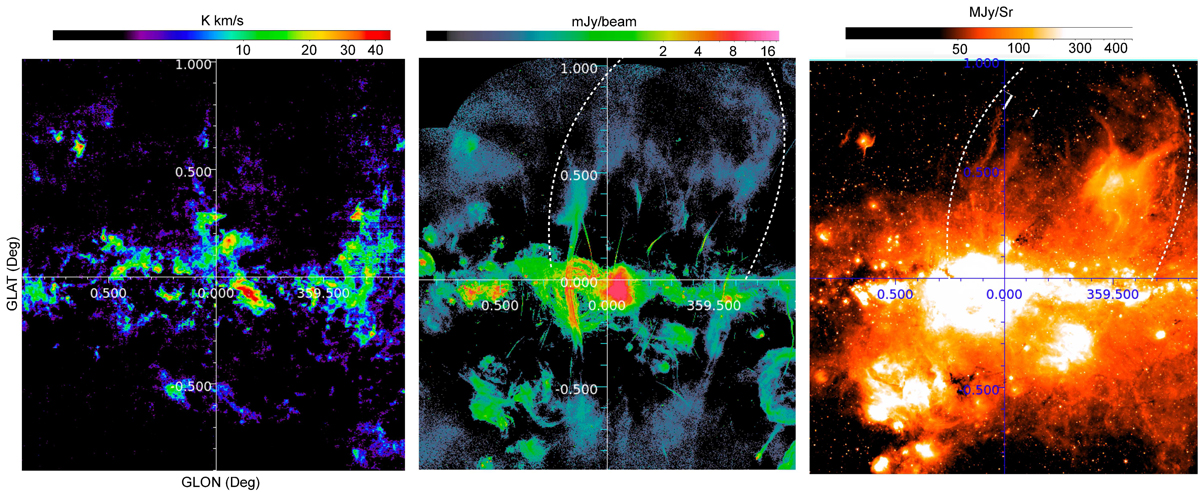
Fig. 1.
Download original image
Multiwavelength view of GC chimney. Left: SEDIGISM 13CO velocity integrated intensity map in the velocity range from −3.5 to 3.5 km s−1 showing the funnel-shaped CO feature known as the Galactic Centre Molecular Funnel, proposed as the molecular counterpart of the radio bubble. Middle: MeerKAT 1 GHz radio emission map towards the GC region (Heywood et al. 2022) showing the 430 pc bipolar radio bubble (Heywood et al. 2019). Right: Spitzer 24 μm warm dust emission. The IR counterpart of the northern lobe of the radio bubble (white dashed curves in middle and right panels) is seen as filamentary features extending to northern latitudes.
Current usage metrics show cumulative count of Article Views (full-text article views including HTML views, PDF and ePub downloads, according to the available data) and Abstracts Views on Vision4Press platform.
Data correspond to usage on the plateform after 2015. The current usage metrics is available 48-96 hours after online publication and is updated daily on week days.
Initial download of the metrics may take a while.