Open Access
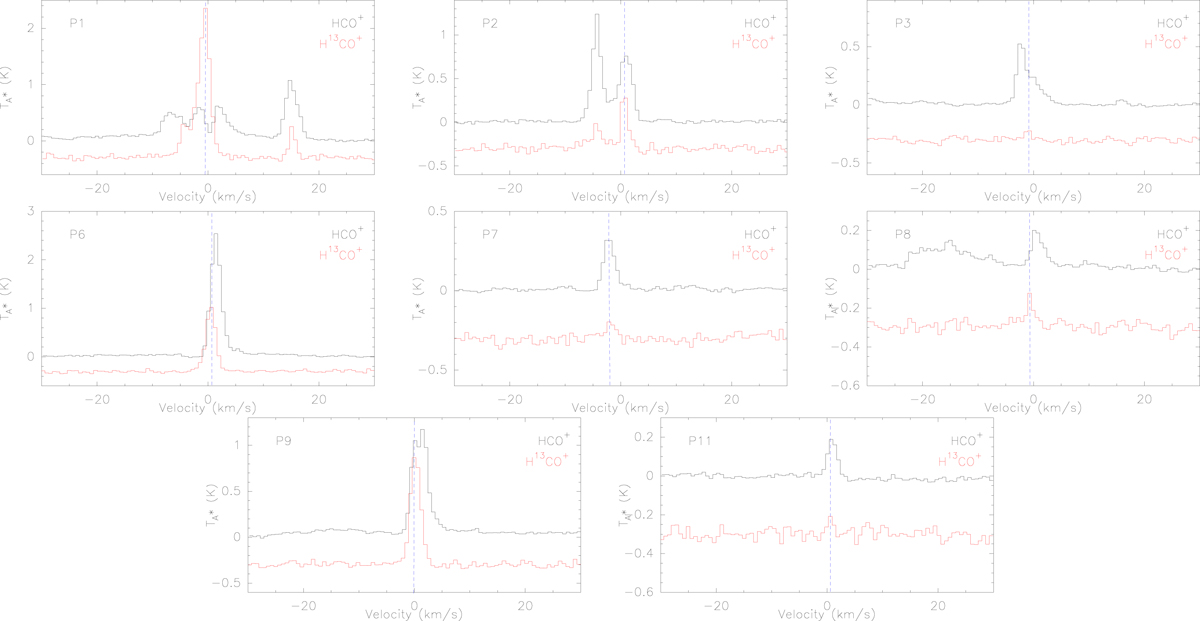
Fig. A.5.
Download original image
Spectra of HCO+ and H13CO+J = 1 − 0 emission towards eight positions along the GCMF restricted to a velocity range of −30 to 30 km s−1 for better visualisation of the emission features. The 13C18O spectra are scaled by a factor of 3. The blue dashed line corresponds to the peak of the H13CO+ line.
Current usage metrics show cumulative count of Article Views (full-text article views including HTML views, PDF and ePub downloads, according to the available data) and Abstracts Views on Vision4Press platform.
Data correspond to usage on the plateform after 2015. The current usage metrics is available 48-96 hours after online publication and is updated daily on week days.
Initial download of the metrics may take a while.