| Issue |
A&A
Volume 665, September 2022
|
|
|---|---|---|
| Article Number | A107 | |
| Number of page(s) | 15 | |
| Section | Extragalactic astronomy | |
| DOI | https://doi.org/10.1051/0004-6361/202243920 | |
| Published online | 15 September 2022 | |
Black hole and host galaxy growth in an isolated z ∼ 6 QSO observed with ALMA
1
Dipartimento di Fisica, Università di Trieste, Sezione di Astronomia, Via G.B. Tiepolo 11, 34131 Trieste, Italy
2
INAF – Osservatorio Astronomico di Trieste, via G. Tiepolo 11, 34143 Trieste, Italy
e-mail: This email address is being protected from spambots. You need JavaScript enabled to view it.
3
IFPU – Institute for Fundamental Physics of the Universe, via Beirut 2, 34151 Trieste, Italy
4
Scuola Normale Superiore, Piazza dei Cavalieri 7, 56126 Pisa, Italy
5
INFN – National Institute for Nuclear Physics, via Valerio 2, 34127 Trieste, Italy
6
Institute of Astronomy, University of Cambridge, Madingley Road, Cambridge CB3 0HA, UK
7
Kavli Institute for Cosmology, University of Cambridge, Madingley Road, Cambridge CB3 0HA, UK
8
Department of Physics and Astronomy, University College London, Gower Street, London WC1E 6BT, UK
9
Dipartimento di Fisica e Astronomia, Università di Firenze, via G. Sansone 1, Sesto F.no, Firenze, Italy
10
INAF – Osservatorio Astrofisico di Arcetri, Largo E. Fermi 5, 50125 Firenze, Italy
11
INAF – Osservatorio Astronomico di Roma, via Frascati 33, 00040 Monte Porzio Catone, Italy
Received:
2
May
2022
Accepted:
6
July
2022
Abstract
The outstanding mass growth of supermassive black holes (SMBHs) at the epoch of reionisation and its relation to the concurrent growth of their host galaxies poses challenges to theoretical models aimed at explaining how these systems formed on short timescales (< 1 Gyr). To trace the average evolutionary paths of quasi-stellar objects (QSOs) and their host galaxies in the plane of BH mass to host mass (Mdyn), we compare the star formation rate (SFR), derived from the accurate estimate of the dust temperature and the dust mass (Tdust, Mdust) based on infrared and sub-millimeter (sub-mm) spectral energy distribution (SED), with the BH accretion rate, derived from Lbol based on X-ray and optical and ultraviolet SED. To this aim, we analysed a deep ALMA observation of the sub-mm continuum, [CII], and H2O of the z ∼ 6 QSO J2310+1855 with a resolution of 900 pc, which enabled a detailed study of dust properties and cold gas kinematics. We performed an accurate SED analysis obtaining a dust temperature of Tdust = 71 ± 4 K, dust mass Mdust = (4.4 ± 0.7)×108 M⊙, and total far-infrared luminosity of LTIR = 2.5−0.5+0.6 × 10¹³ L⊙. The implied active galactic nuclei (AGN) – corrected SFR = 1240−260+310 M⊙ yr−1 is a factor of 2 lower than previously reported for this QSO. We measured a gas-to-dust ratio of GDR = 101 ± 20. The dust continuum and [CII] surface brightness profiles are spatially extended out to r ∼ 6.7 kpc and r ∼ 5 kpc, respectively, with half-light radii of 0.9 and 1.1 kpc for the dust and gas, respectively. The derived gas surface density, Σgas, and star formation rate density, ΣSFR, place the J2310+1855 host galaxy above the Kennicutt-Schmidt relation. We derived a best estimate of the dynamical mass Mdyn = 5.2 × 10¹⁰ M⊙ within r = 1.7 kpc based on a dynamical model of the system with a rotating disk inclined at i = 25 deg. The Toomre parameter profile across the disk is Qgas ∼ 3 and implies that the disk is unstable. We found that SFR/Mdyn > ṀBH/MBH, suggesting that AGN feedback might be efficiently acting to slow down the SMBH accretion, while stellar mass assembly is still vigorously taking place in the host galaxy. In addition, we were also able to detect high-velocity emission on the red and blue sides of the [CII] emission line that is not consistent with disk rotation and traces a gaseous outflow. We derived an outflow mass Mout = 3.5 × 10⁸ M⊙, and a mass outflow rate in the range Ṁout = 1800 − 4500 M⊙ yr−1. The implied Ėout ∼ 0.0005 − 0.001 Lbol is in agreement with the values observed for ionised winds. For the first time, we mapped a spatially resolved water vapour disk through the H2O v = 0 3(2, 2) − 3(1, 3) emission line detected at νobs = 274.074 GHz, whose kinematic properties and size are broadly consistent with those of the [CII] disk. The luminosity ratio LH2O/LTIR = 1.4 × 10⁻⁵ is consistent with line excitation by dust-reprocessed star formation in the interstellar medium of the host galaxy.
Key words: quasars: individual: SDSS J231038.88+185519.7 / galaxies: high-redshift / galaxies: active / galaxies: ISM / techniques: interferometric
© R. Tripodi et al. 2022
 Open Access article, published by EDP Sciences, under the terms of the Creative Commons Attribution License (https://creativecommons.org/licenses/by/4.0), which permits unrestricted use, distribution, and reproduction in any medium, provided the original work is properly cited.
This article is published in open access under the Subscribe-to-Open model. This email address is being protected from spambots. You need JavaScript enabled to view it. to support open access publication.
1. Introduction
Luminous quasi-stellar objects (QSOs), powered by accretion onto supermassive black holes (SMBHs), already exist at the epoch of reionisation, when the Universe was only 0.5–1 Gyr old. Their BH masses are not lower than those of hyper-luminous QSOs at lower redshift, meaning that BH growth had to be a fast process, and that the process had to stop with a similar high efficiency after the rapid build-up. How huge BHs formed and grew in such a short time is indeed highly debated (Volonteri 2010; Johnson & Haardt 2016), particularly as they lie above the local MBH − Mdyn correlation and thus follow the BH-dominance growth path (Volonteri 2012). Once started, it is unknown what slowed the BH growth down and when this process occurred, leading towards the symbiotic growth with the host galaxy observed in the local Universe. Candidate processes are inefficient gas accretion and/or feedback through BH winds. At the same time, the host galaxies of high-z QSOs are likely growing rapidly. Therefore, the onset of significant BH feedback hampering BH growth would mark the transition from a phase of BH dominance to a phase of symbiotic growth of the BH and the galaxy. Cosmological hydrodynamic simulations of early BH and galaxy evolution support this scenario by identifying z ∼ 6–7 as the transition epoch during which QSO feedback increases in strength and starts to significantly slow down BH growth. Moreover, the QSO host galaxies provide a unique opportunity to characterize both the physical properties of the interstellar medium (ISM) in such extreme conditions (e.g., Bertoldi et al. 2003a,b; Decarli et al. 2018; Venemans et al. 2020; Neeleman et al. 2021; Pensabene et al. 2021) and to study the formation and build-up of massive galaxies in the early Universe in detail.
In the past few decades, Herschel, the Northern Extended Millimeter Array (NOEMA), the Very Large Array (VLA), and particularly the Atacama Large Millimeter/sub-millimeter Array (ALMA) have been able to probe and give insights into the properties of the gas and dust inside the QSO host galaxies, allowing us to derive the dynamical masses, star formation activity, and ISM properties. Observations using, for instance, the instruments on Herschel, NOEMA, and ALMA have detected the dust continuum in the host galaxies of many z ∼ 6 QSOs, with far-IR (FIR) luminosities of 1011 − 13 L⊙ and dust masses of about 107 − 9 M⊙ (Decarli et al. 2018; Carniani et al. 2019; Shao et al. 2019). The rest-frame FIR continuum emission in these sources originates from dust heated by the ultraviolet (UV) radiation from young and massive stars in the host galaxies and the QSO radiation field. It is often hard to determine the temperature and mass of the dust precisely since they are both highly degenerate and the FIR spectral energy distribution (SED) is sparsely probed, often relying on single-frequency continuum detection. However, if multi-frequency ALMA observations are available in the FIR, it is possible to constrain the dust temperature and mass with statistical uncertainties < 10% (see e.g., Carniani et al. 2019), implying a high accuracy in the determination of the star formation rate (SFR). An accurate estimate of the dust mass would also allow us to derive the molecular gas mass of the host galaxy through the gas-to-dust ratio (GDR). Although it is possible to directly probe the molecular reservoirs of the QSO host galaxies using the rotational transitions of the carbon monoxide (CO; e.g., Vallini et al. 2018; Madden et al. 2020), very few high-z QSOs are observed in CO because this emission line is typically very faint at high z. The GDR indeed has often been assumed in order to compute the gas mass, implying an high degree of uncertainty in its estimate. Studies of z ∼ 2.4 − 4.7 hyper-luminous QSOs show that the GDR spans a broad range of values, [100–300], with an average GDR ∼ 180 (Bischetti et al. 2021), consistent with the results found for sub-millimetre galaxies out to z ∼ 3 − 5 with GDR ∼ 150 − 250 (e.g., Saintonge et al. 2013; Miettinen et al. 2017). In low-z galaxies, a GDR ∼ 100 is typically observed (Draine et al. 2007; Leroy et al. 2011), implying that the GDR increases with redshift. However, if we are able to derive a reliable estimate of the gas mass from CO, this could be used, together with the accurate estimate for the dust mass, to determine the GDR instead of assuming it, and to use it for other high-z QSOs.
The ISM of the QSO host galaxies has compact sizes of a few kiloparsec (e.g., Wang et al. 2013; Shao et al. 2017; Venemans et al. 2020; Neeleman et al. 2021) and shows massive gas reservoirs (Feruglio et al. 2018). The [CII] λ158 μm is the dominant cooling line of the ISM and the brightest emission line, almost unaffected by attenuation. Therefore, it is the preferred tracer for studying the ISM and provides valuable information about cold, warm neutral and mildly ionised ISM (Cormier et al. 2015; Olsen et al. 2018). Its 158 μm transition predominantly arises from photodissociation regions (PDRs; Hollenbach & Tielens 1999) at the interface of the atomic and molecular media in the outskirts of molecular clouds in galaxy star-forming regions. Through kinematical studies of [CII], dynamical masses have been derived of < 1011 M⊙ (e.g., Shao et al. 2017; Pensabene et al. 2021; Izumi et al. 2021a; Neeleman et al. 2021), which place most of the z ∼ 6 QSOs above the MBH − Mdyn relation by a factor of ∼3 − 10. This in turn allows us to distinguish among the different growth paths of the SMBHs and their host galaxies (BH dominance, symbiotic growth, or BH adjustment, see Volonteri 2012).
In the past decade, the strong coupling between the ISM (and also the circum-galactic medium, CGM) and the SMBH energy output has been observed and was modelled theoretically. It occurs as mechanical and radiative QSO-driven feedback processes, and it affects the evolution of the whole galaxy. In particular, very powerful mechanisms that efficiently deposit energy and momentum into the surrounding gas are found to be QSO-driven outflows (Faucher-Giguère & Quataert 2012; Zubovas & King 2012). They have been extensively studied and detected from the local Universe back to the epoch of reionisation in all gas phases, at all spacial scales, from sub-parsec to several kiloparsecs, even with high kinetic power (up to a few percent of the bolometric luminosity) and with mass outflow rates exceeding the star formation rate (Feruglio et al. 2010; Maiolino et al. 2012; Cicone et al. 2015; Aalto et al. 2015; Fiore et al. 2017; Bischetti et al. 2019b). Because of observational limitations, we unfortunately have very few detections of outflows in high-z QSOs (Maiolino et al. 2005; Bischetti et al. 2019a; Izumi et al. 2021a,b), but a precise determination of their masses, extension, and occurrence would give us valuable insights into the onset of the active galactic nucleus (AGN) feedback in the first QSOs.
Finally, the broad-band coverage of ALMA allows the serendipitous detection of additional emission lines arising from the galaxy ISM, such as H2O, which can be used to provide additional constraints on the ISM properties. Water vapour emission lines have been detected from z > 3 galaxies and QSOs (e.g., van der Werf et al. 2011; Combes et al. 2012; Omont et al. 2013; Riechers et al. 2013), but they are still rare and unresolved, if detected, at z ≳ 6 (e.g., Yang et al. 2019; Pensabene et al. 2021 and references therein). Although little information is still available at high-z, a correlation between LH2O and the total infrared luminosity has been found and studied, suggesting that the water vapour lines would be excited by an IR-pumping mechanism from the ISM UV radiation field (Yang et al. 2019; Pensabene et al. 2021).
We present new high-resolution ALMA observation of the [CII], the H2O emission lines, and the sub-millimeter (sub-mm) continuum of QSO SDSS J231038.88+185519.7 (hereafter J2310+1855 or J2310). J2310, first discovered in SDSS (Jiang et al. 2006; Wang et al. 2013), is one of the most FIR-luminous QSOs and one of the brightest optical QSOs known at z ∼ 6, with Lbol = 9.3 × 10¹³ L⊙. The redshift measured with the QSO rest-frame UV line emission is z = 6.00 ± 0.03 (Wang et al. 2013). Feruglio et al. (2018) detected and analysed the CO(6-5) and [CII] emission lines and the sub-millimetre continuum of J2310, deriving a size of the dense molecular gas of 2.9 ± 0.5 kpc and of 1.4 ± 0.2 kpc for the 91.5 GHz dust continuum and a molecular gas mass of M(H2) = (3.2 ± 0.2)×1010 M⊙. They estimated a dynamical mass of  , measuring a disk inclination of i ∼ 50 deg. They also inferred the BH mass from the CIV emission line, measured in the X-shooter/VLT spectrum of the QSO, obtaining MBH = (1.8 ± 0.5) × 109 M⊙. Recently, Shao et al. (2019) presented a detailed analysis of the FIR and sub-mm SED and derived a dust temperature of T ∼ 40 K, a dust mass of Mdust = 1.6 × 10⁹ M⊙, a FIR luminosity
  , and an SFR = 2400 − 2700 M⊙ yr−1. D’Odorico et al. (2018) detected a very metal-poor, proximate damped Lyman α system (DLA) located at z = 5.938646 ± 0.000007 in the X-shooter/VLT spectrum of J2310, which was associated with a CO emitting source at z = 5.939. This source, called Serenity-18, was detected through its CO(6-5) emission line at [RA, Dec] = 23:10:38.44, 18:55:21.95.
The paper is organised as follows. The observations are described in Sect. 2; in Sect. 3 we show the results for the continuum emission, the [CII], and the H2O v = 0 3(2, 2) − 3(1, 3) emission lines. In Sect. 4 we report on the analysis of the SED of J2310+1855, the [CII], H2O distributions and kinematics, and the environment of the QSO. A discussion and summary are presented in Sect. 5, and the conclusions are reported in Sect. 6.
We adopted a ΛCDM cosmology from Planck Collaboration XIII (2016): H0 = 67.7 km s−1 Mpc−1, Ωm = 0.308 and ΩΛ = 0.7. Thus, the angular scale is 5.84 kpc arcsec−1 at z = 6.
2. Observations
We analysed the dataset 2019.1.00661.S from the ALMA 12 m array towards the QSO SDSS J2310+1855. This observation was pointed towards [RA, Dec] = 23:10:38.44, 18:55:21.95 with a central frequency of 264.695 GHz. The primary beam of the observation includes QSO J2310+1855, the frequency setup covers the [CII] 2P3/2−2P1/2 emission line from the QSO and the adjacent continuum, and the [CII] emission from a DLA located on the QSO sightline at z = 5.938646. This observation, with a total integration time of 4.3 h and a maximum baseline of 2517 m, was primarily designed to detect [CII] emission towards Serenity-18 (D’Odorico et al. 2018), at the same time allowing high-resolution imaging of QSO J2310.
The calibration of visibilities was performed for all datasets through the Common Astronomy Software Applications pipeline (CASA; McMullin et al. 2007), version 5.1.1-5. To image the QSO, we applied phasecenter within tclean to place the QSO at phase tracking centre. We imaged the data using both natural and Briggs weighting with a robust parameter equal to 0.5, the latter in order to maximise the angular resolution, and we applied a 3σ cleaning threshold. We imaged the continuum by collapsing all line-free channels1, selected by inspecting the visibilities in all spectral windows. We used the CASA task uvcontsub to fit the continuum visibilities in the line-free channels and obtained continuum-subtracted cubes with spectral channels of width 8.5 km s−1. To obtain continuum-subtracted data cubes, we fitted the continuum in upper and lower side band (USB and LSB) with a first-order polynomial, since the continuum shows a non-negligible slope. The clean beams we obtained are (0.26 × 0.21) arcsec2 for natural and (0.17 × 0.15) arcsec2 for Briggs weighting. The maximum spatial resolution we reached is about 0.9 kpc at the rest frame of the QSO and is obtained in the Briggs data cube. The r.m.s. noise reached is 8.8 μJy beam−1 in the continuum and 0.23 mJy beam−1 per 8.5 km s−1 channel for the natural weighted maps (Table 1). The high resolution and sensitivity of this observation enabled us to perform a detailed analysis of the [CII] disk through dynamical modelling, which was not possible before. We retrieved a new precise estimate for the dynamical mass (see Sect. 4.2). Moreover, we were able to spatially resolve the water vapour emission detected at ∼274 GHz (see Sect. 4.3) for the first time.
Summary of the ALMA observations and their properties.
We also analysed an additional dataset (II) from the ALMA archive (project 2019.1.01721.S). This has a maximum baseline of 313 m and central frequency of 365.54 GHz, and it also covers the [CII] emission line from both QSO J2310+1855 and the DLA at z = 5.938646. We imaged dataset II using the same method as described above, and applied only natural weighting. We obtained a clean beam of (1.6 × 1.3) arcsec2. The rms noise is 56 μJy beam−1 in the continuum and 0.4 mJy beam−1 per 8.5 km s−1 channel in the data cube. Combination of the two datasets was performed but did not produce gain in sensitivity or image quality because the angular resolutions of the two datasets are very different. We therefore did not use it in the following analysis.
We analysed the datasets, centred on J2310+1855, present in the ALMA archive and more recent than 2011 in order to derive the continuum flux densities at different frequencies for QSO J2310+1855. For all datasets, calibration and imaging were performed as outlined above, and natural weighting was applied everywhere with a detection threshold of 3σ.
3. Results
3.1. QSO continuum emission
Figure 1 shows the 260 GHz dust continuum map obtained through natural weighting. The continuum shows resolved emission with an approximate size of 1.5 arcsec across, corresponding to 8.7 kpc at the rest frame. Using a 2D Gaussian fit, we derived a flux density of 6.43 ± 0.16 mJy, 30% lower than the value reported by Shao et al. (2019) from lower-resolution data, and a FWHM size of 0.22 × 0.19 arcsec2 (Table 2). We note, however, that the Gaussian 2D fitting procedure fails to fit the surface brightness distribution and shows strong residual flux. Integrating the flux in the map over the region with > 2σ, we derived a flux density of 7.12 ± 0.2 mJy. This flux density is still lower than that reported previously by Shao et al. (2019), meaning that the high-resolution data miss about 25% of the flux. Measurement of the flux density from dataset II, that is, at lower resolution, with a 2D Gaussian fit, indeed led to a value of 8.81 ± 0.13 mJy, which is in agreement with the measurement reported by Shao et al. (2019). To be conservative, we therefore used the flux density from dataset II to study the dust continuum SED (see Sect. 4.1). Table 3 reports the continuum data from a reanalysis of ALMA archival data and Herschel data from Shao et al. (2019).
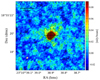 |
Fig. 1. 260 GHz dust continuum map of QSO J2310+1855 (levels −4, −3, −2, 2, 3, 5, 10, 25, and 50σ, σ = 9.15 μJy beam−1). The clean beam (0.26 × 0.21 arcsec2) is indicated in the lower left corner of the diagram. The cross indicates the position of the continuum peak. |
Measurements and derived quantities for the emission lines and dust continuum in SDSS J231038.88+185519.7.
3.2. [CII] and H2O emission
We used the continuum-subtracted data cube to study the [CII] line emission of the QSO. In order to study the [CII] kinematics, we adopted the Briggs cleaned data cube that enhances the angular resolution. Figure 2 (top panels) shows the moment-0, -1, and -2 maps of the [CII] emission and the spectrum, obtained by applying a 3σ threshold to the Briggs clean cube. The [CII] distribution is spatially resolved with a size of (0.449 × 0.325) ± (0.028 × 0.021) arcsec2 estimated from a 2D Gaussian fit on the velocity-integrated map (see Table 2), and it shows a velocity gradient oriented north-east to south-west with Δv = 400 km s−1. The moment-2 map shows a range of the velocity dispersion between 20 and 140 km s−1, where the maximum value towards the nucleus is affected by beam smearing (Davies et al. 2011).
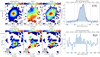 |
Fig. 2. Moment maps of the [CII] emission line (top panels) and of the emission line detected at 274.084 GHz (bottom panels), identified as the H2O v = 03(2, 2)−3(1, 3). From left to right: integrated flux, mean velocity map, and velocity dispersion map, continuum-subtracted spectra of [CII] (top right) and H2O (bottom right). The clean beam is plotted in the lower right or left corner of the moment maps. The cross indicates the peak position of the integrated flux for each line. The spectra have been extracted from the region included within ≥2σ in the velocity integrated map. In the [CII] spectrum, the vertical blue and red lines highlight the spectral regions in which the flux is higher than in the Gaussian fit (solid purple line). The H2O spectrum has been rebinned to 40 km s−1. |
Figure 2 (top right panel) shows the continuum-subtracted [CII] line profile, which peaks at a frequency of 271.382 GHz, corresponding to z = 6.0031 ± 0.0001, consistent with previous determinations (e.g., Wang et al. 2013; Shao et al. 2019, see Table 2). The FWHM of the line is 422 ± 15 km s−1, derived from the fit with a single Gaussian. Because the [CII] line shows two peaks, the value of the integrated flux would be ∼10% overestimated using a single Gaussian. Therefore, we fitted the line profile with two Gaussian functions and derived an integrated flux of [5.2 ± 0.01] Jy km s−1. This is 40% lower than the flux reported by Feruglio et al. (2018), obtained using a dataset with a clean beam of about 0.9 arcsec. This suggests that these higher-resolution observations filter out part of the flux. The [CII] profile shows excess emission with respect to the best fit at the red and blue sides of the line, which would require additional Gaussian components. We discuss these high-velocity emissions in Sect. 4.2.
We detected an emission line at a sky frequency of 274.074 GHz towards the QSO position with a statistical significance of 10σ and an integrated flux of Sνdv = 0.36 ± 0.01 mJy km s−1 (Table 2). The line width is 340 ± 88 km s−1, consistent with the [CII] width. We identified this line as the transition of water vapour H2O v = 03(2, 2) − 3(1, 3) with Frest = 1919.359 GHz, and derive a zH2O = 6.0031 ± 0.0006, consistent with the [CII] redshift of the QSO. Figure 2 (bottom panels) shows the moment maps of this emission line, obtained through natural weighting to maximise sensitivity, and the line profile. The emission appears to be spatially resolved with size of 1.94 × 1.12 kpc2 (Table 2). A velocity gradient is detected along a position angle (PA) that appears to be consistent with that detected in the [CII] line.
We scanned the data cubes in each of the four spectral windows with the aim of searching for any additional line emitters within the ALMA beam. To do this, we used a detection threshold of S/N > 3 per spectral channel, and we required S/N > 3 at the peak position of each detected structure over at least 20 adjacent channels (i.e. Δv ≳ 150 km s−1). We did not detect any sources other than those described above.
One continuum emitter was detected at the 4σ significance level at position (RA, Dec) = (23:10:38.57, +18:55:23.55) (Fig. 3) after we had downgraded the resolution of our observation applying uvtaper = [0.5 arcsec] within tclean. We obtained a clean beam of 0.65 × 0.62 arcsec2 for the continuum map. The distribution of this structure is spatially resolved with a size of (0.918 × 0.125)±(0.194 × 0.111) arcsec2 and a flux of 0.137 ± 0.015 mJy, estimated from a 2D Gaussian fit. Another scan of the data cube yielded no additional continuum or line emitters in the field above the detection threshold of S/N > 1 per channel.
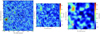 |
Fig. 3. Dust continuum maps of the QSO field with different resolutions. Left panel: dust continuum map of the QSO field centred on the phase-tracking centre of the observation. Levels are −3, −2, 2, 3, and 4σ, σ = 8.8 μJy beam−1. The cross indicates the phase centre. In this map the QSO is located at offset [6, −2] arcsec. Central panel: zoomed view towards the phase centre. The clean beam is plotted in the lower left corner. Right panel: 260 GHz dust continuum uv-tapered map of Serenity-18 (levels −4, −3, −2, 2, 4, and 5σ, σ = 15 μJy beam−1). The imaging has been performed with uvtaper = [0.5 arcsec]. The clean beam is indicated in the lower left corner. The black cross indicates the position of the phase-tracking centre, which coincides with the expected position of the CO-emitter Serenity-18 (D’Odorico et al. 2018). The white cross indicates the continuum emitter detected in the beam (see text). |
4. Analysis
4.1. Dust properties
In Fig. 4 we show the mm to FIR SED of J2310+1855 starting from a rest frame wavelength of 10 μm derived from the measurements in Table 3. In this wavelength range, two main components contribute to the QSO emission: the large-scale dust in the ISM, and the dusty torus. Following Carniani et al. (2019), we modelled the SED of the dust emission with a modified black-body (MBB) function given by
, \end{aligned} $$](/articles/aa/full_html/2022/09/aa43920-22/aa43920-22-eq5.gif) (1)
(1)
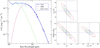 |
Fig. 4. Results of the SED fitting of J2310+1855. Left panel: SED of J2310+1855 using ALMA and Herschel data reported in Table 3, fitted with an MBB function (for the dust emission) and the a = 0.0002, τ = 3, p = 0, q = 1.5, oa = 80, R = 30, and i = 20 deg dusty torus model from the SED library SKIRTOR (Stalevski et al. 2016). Dark blue diamonds are computed based on ALMA observations and light blue diamonds based on Herschel observations, as listed in Table 3. Right panel: confidence ellipses for the MBB free parameters Tdust, Mdust, and β computed at 68.27%,95.45%, and 99.99% confidence levels. The dotted blue lines indicate the best-fit parameters. |
Continuum.
where  is the solid angle with Agal, and DL is the surface area and luminosity distance of the galaxy, respectively. The dust optical depth is
 (2)
(2)
with β the emissivity index and k0 = 0.45 cm2 g−1 the mass absorption coefficient (Beelen et al. 2006). The solid angle is estimated using the continuum emission mean size of the ALMA observations in Table 3. The effect of the CMB on the dust temperature is given by
![Mathematical equation: $$ \begin{aligned} T_{\rm dust}(z)=((T_{\rm dust})^{4+\beta }+T_0^{4+\beta }[(1+z)^{4+\beta }-1])^{\frac{1}{4+\beta }}, \end{aligned} $$](/articles/aa/full_html/2022/09/aa43920-22/aa43920-22-eq8.gif) (3)
(3)
with T0 = 2.73 K. We also considered the contribution of the CMB emission given by Bν(TCMB(z) = T0(1 + z)) (da Cunha et al. 2013). Applying Eq. (1), we performed a fit of ALMA data using a non-linear least-squares fit. We set Tdust, log(Mdust/M⊙),β as free parameters, varying in the intervals 20 K ≲ Tdust ≲ 300 K, 6 ≲ log(Mdust/M⊙)≲10, and 1 ≲ β ≲ 2 because these are reasonable ranges for high-z QSOs. The best-fit model has β = 1.86 ± 0.11, a dust temperature Tdust = 72 ± 4 K, and a dust mass of Mdust = (4.4 ± 0.5)×108 M⊙.
The flux excess with respect to the MBB that is probed by Herschel photometric points requires a warmer dust component, which we modelled with a dusty torus component. We used SKIRTOR, a library of SED templates to model the AGN dusty torus, calculated with SKIRT, a custom radiative transfer code based on Monte Carlo techniques (Stalevski et al. 2016). This library is made of 19 200 templates with different values of the optical depth τ at 9.7 μm, of the power-law exponent that sets the radial gradient of dust density (p), of the index for dust density gradient with polar angle (q), eight different half-opening angle OAs between the equatorial plane and the edge of the torus, ten inclinations i, from face-on (0 deg, for typical unobscured type I AGN) to edge-on (90 deg, obscured type II AGN) view, and three values for the ratio R of the outer to inner radius of the torus.
Thus, we used Eq. (1) of the MBB and the torus templates to fit the flux continuum densities measured with ALMA and Herschel. We set the Tdust, log(Mdust/M⊙), β, and a (the normalisation of the torus template) as free parameters and explored the parameter space using a non-linear least-squares fit. We forced Tdust, log(Mdust/M⊙), β as before, and 10−5 ≲ a ≲ 1.
Figure 4 shows the results of the SED modelling with a combination of a dusty torus and an MBB, and the χ2 confidence contours for Tdust, log(Mdust/M⊙), β. Table 4 reports the best-fitting results. The best-fitting parameters for the MBB are β = 1.86 ± 0.12, a dust temperature Tdust = 71 ± 4 K, and a dust mass of Mdust = (4.4 ± 0.7)×108 M⊙. These values are consistent with those obtained from the fit with the MBB alone, implying that the warmer dusty torus component has little impact on the cool dust component from the host galaxy. Our best-fit Tdust is a factor of ∼2 higher than that derived by Shao et al. (2019) (T = 39 K), and Mdust is a factor of ∼4 smaller than their estimate. This also implies a higher gas to dust mass ratio compared to their estimates. We find GDR = 101 ± 20 based on our Mdust estimate and the molecular mass M(H2) = (4.4 ± 0.2)×1010 M⊙, measured from CO(2-1) and CO(6-5) by Li et al. (2020) and Feruglio et al. (2018), using the commonly adopted conversion factor for QSO host galaxies αCO = 0.8 M⊙ (K km s−1 pc2)−1 (Downes & Solomon 1998; Carilli & Walter 2013).
Results of the SED fitting with MBB and dusty torus models.
We note that the photometric data at λrest < 15 μm can be equivalently well fitted by a broad range of SKIRTOR templates (that differ by Δχ2 = 0.01 at most), depending on the combination of the torus parameters. In particular the torus inclination, i, is a great source of degeneracy: when the other torus parameters are fixed to the best-fitting values, the variation in i yields a set of equivalent templates, with Δχ2 = 0.01. The inclination of the torus can be properly determined by observations in the wavelength regime λrest < 10 μm, which is not covered by our dataset. Although the contribution of the dusty torus, clearly seen in the flux excess at λrest < 15 μm, should be considered in the fitting procedure to properly characterize the physics of the QSO and its host galaxy, we were not able to uniquely determine the structural and physical properties of the dusty torus with this dataset. Nonetheless, we were able to use the best-fitting function MBB+template to compute the total infrared (TIR) luminosity from 8 to 1000 μm rest-frame, retrieving a value of  (see Table 4).
We also estimated the TIR luminosity for the best-fit MBB model by integrating from 8 to 1000 μm rest-frame, and we obtained  (Duras et al. 2017). Several observations and radiative transfer simulations suggested that the radiative output of luminous QSOs substantially contributes to dust heating on kpc scale (Duras et al. 2017; Di Mascia et al. 2021; Bischetti et al. 2021; Walter et al. 2022). In particular, Duras et al. (2017) showed that about 50% of the total IR luminosity in AGN with Lbol > 1047 erg s−1 is due to dust heated by QSOs. Applying this correction and adopting a Chabrier initial mass function (IMF; Chabrier 2003) would imply a
  and a ΣSFR = 521 M⊙ yr−1 kpc−2, within the dust half-light radius (0.87 kpc, see Sect. 4.2 for the detailed derivation of the half-light radius).
4.2. [CII] distribution and kinematics
We measured a total line luminosity of L[CII] = 5.1 ± 0.1 × 10⁹ L⊙ and derived an L[CII]/LTIR, MBB + Torus = 6 × 10⁻⁵. This value is at the lower end of the distribution found for QSOs at this redshift (Walter et al. 2022; Decarli et al. 2018; Shao et al. 2019). The neutral gas mass in the disk, based on [CII] emission, can be derived with the relation from Hailey-Dunsheath et al. (2010; see also Bischetti et al. 2019b),
![Mathematical equation: $$ \begin{aligned} \dfrac{M_{\rm HI}}{M_{\odot }} = 0.77\biggl (\dfrac{0.7L_{\rm [CII]}}{L_{\odot }}\biggr )\biggl (\dfrac{1.4\times 10^{-4}}{X_{C^+}}\biggr )\times \dfrac{1+2e^{-91\mathrm{K}/T}+n_{\rm crit}/n}{2e^{-91\mathrm{K}/T}} ,\end{aligned} $$](/articles/aa/full_html/2022/09/aa43920-22/aa43920-22-eq14.gif) (4)
(4)
where XC+ is the [CII] fraction per hydrogen atom, T is the gas temperature, n is the gas density, and ncrit ∼ 3 × 103 cm−3 is the [CII]λ158 μm critical density for collisions with neutral hydrogen that frequently occur in photo-dissociation regions (PDRs; Wolfire et al. 2022; Hollenbach & Tielens 1999). We estimated the lower limit for the molecular mass in the regime n ≫ ncrit (Maiolino et al. 2005; Aalto et al. 2012, 2015), and we considered a XC+ ∼ 10−4 and a gas temperature of 200 K, both typical of PDRs (Maiolino et al. 2005; Hailey-Dunsheath et al. 2010; Cicone et al. 2015; Bischetti et al. 2019a). We found MHI = 6.6 × 10⁹ M⊙, significantly lower than the molecular mass obtained through molecular tracers (Feruglio et al. 2018; Shao et al. 2019).
In Fig. 5 we show the observed surface brightness profiles of the [CII], dust continuum emission, and molecular gas traced by CO(6-5) (the latter taken from Feruglio et al. 2018). To compute the profiles, we used natural weighted maps and defined concentric annular regions centred at the QSO continuum position peak (RA, Dec = 23:10:38.90, 18:55:19.8). The first point for the surface brightness was taken at the peak pixel, and the next annuli are 0.1 arcsec thick for the [CII] and dust continuum, and 0.25 arcsec thick for the CO(6-5). To compute the surface brightness at each annulus, we averaged the flux within each annulus and divided it by the area of each annulus. The error bars associated with the surface brightness at each annulus (plotted in Fig. 5) mark the 16th and 84th percentiles inside each annulus, which corresponds to ∼68% of the surface brightness distribution centred on the mean value (i.e. ±1σ for a Gaussian distribution). To determine the rms level, we associated a Poisson error with each region that we obtained as follows. We computed the rms per beam over a 10 × 20 arcsec2 background, target-free area, and divided it by the square root of the number of beams in each annulus. To compare the [CII], CO, and continuum profiles, which have different rms levels, we subtracted the rms from each respective profile, so that the three distributions approached zero at high radii. All profiles are more extended than their respective synthetic beam, shown as dashed lines in Fig. 5. The [CII] and dust emission show consistent profiles for radii r ≳ 1.5 kpc. In the inner region of the source, we found that the continuum is more peaked at the centre than [CII] (and CO). The half-light radii are 0.87 kpc for the dust, 1.08 kpc for [CII], showing that the [CII] emission is more extended than the continuum emission (e.g., Li et al. 2022), and 1.5 kpc for the CO emission. These results are also consistent with values that are commonly measured in QSOs at this redshift (Decarli et al. 2018; Carniani et al. 2019; Venemans et al. 2020). A similar behaviour of reduced [CII] emissivity close to the QSO was observed in the z ∼ 7 QSO J2348−3054 (Walter et al. 2022) and in the z = 6.6 QSO J0305–3150 (Li et al. 2022). This is likely due to the contribution of the QSO to the dust heating, which reduces the L[CII]/LFIR ratio in the nuclear region. We estimated the total gas surface density, including the contribution of HI from [CII] and H2 from CO within the half-light radius r[CII],HI ∼ 1.08 kpc. We find Σgas(HI + H2) = 13809 M⊙ pc−2. However, the gas traced by [CII] reaches a (azimuthally averaged) maximum size2 of r[CII] ∼ 5 kpc, and the dust emission reaches an even larger radius of rdust = 6.7 kpc, probably owing to the better sensitivity reached in the aggregated bandwidth. The molecular gas traced by CO(6-5) shows a smoother profile and reaches a size similar to the [CII], rCO ∼ 4.7 kpc.
 |
Fig. 5. Natural weighting surface brightness for [CII] (red), CO(6-5) (green), and continuum (blue) of J2310, normalised to the respective rms level, as a function of the radius from the peak position of the source. The lower and upper error bars are the 16th and 84th percentiles, respectively. The shadowed regions connect the uncertainties given by the percentiles. The coloured dashed lines show the synthetic beams for each observation. The dashed black lines mark the 0 level of surface brightness. The inset shows a zoomed view at large radii. The CO(6-5) data are taken from Feruglio et al. (2018) and have a clean beam of 0.6 × 0.4 arcsec2. |
We modelled the [CII] line-of-sight (LOS) velocity distribution with an inclined-disk model, using the 3D-based analysis of rotating objects from line observations (3DBarolo), a software package for the fitting of 3D tilted-ring models to emission line observations from high-resolution to very low resolution data cubes (Di Teodoro & Fraternali 2015). 3DBarolo builds a number of models in the form of artificial 3D observations and compares them with the input cube, finding the set of geometrical and kinematical parameters that better describes the data, correcting for beam-smearing effects. Fixed parameters of the fit are the centre of the disk, set to the continuum peak (Table 2), and the position angle PA = 200 deg. The rotational velocity vrot and velocity dispersion σgas are free parameters with initial-guess values of 50 km s−1 and 70 km s−1, respectively. Since even in the case of high-resolution data the inclination, i, is the strongest source of uncertainty in determining the rotation curve and the dynamical mass, we performed a first run with i set as a free parameter, retrieving a value of i ∼ 25 deg for the best-fitting disk model. In the second run, we fixed the inclination to i = 25 deg, with all the other parameters as before. The sampling was initially performed with seven radii, spaced by 0.045 arcsec, starting from a galactocentric radius of 0.023 arcsec. This produced a rotation curve with an average vrot ≃ 354 km s−1 and a flat profile, while we would expect a decreasing trend towards the galactic centre. The excess velocity in the central part of the rotation curve could be due to a residual beam-smearing effect or to an additional kinematic component in the centre. In order to avoid the systematics induced by the inclusion of innermost region and to obtain a reliable modelling of the disk, we excluded the central beam (radius ∼0.08 arcsec) from the fit, and performed a sampling with 5 radii, spaced by 0.045 arcsec, starting from 0.113 arcsec. The top and bottom left panels of Fig. 6 show the position-velocity (PV) diagrams of the disk along the major and minor kinematic axes with contours of the disk model as dashed orange lines and the modelled LOS velocities as orange stars. Exploring the vrot − i parameter space with the task SPACEVAR of 3DBarolo, we found that models with i in the range [20, 45] deg give similar results in modelling the PV diagram and the velocity dispersion profile. The vrot is most affected by the variation of i because vrot = vLOS/sin(i), and in this case, models with i < 20 lead to unreasonably high values for the velocity rotation (vrot ≳ 500 − 1000 km s−1). In the top and bottom right panels of Fig. 6, the velocity rotation and velocity dispersion curves are presented, where the error bars arise from the lower and upper limit inclination (i = 20, 45 deg). The intrinsic (i.e. beam-smearing corrected) rotational velocity vrot shows a rather flat rotation curve, and the velocity dispersion σgas is boosted at r ∼ 0.1 arcsec, reaching ∼80 km s−1, while it decreases to 50 km s−1 at larger radii. We found vrot ≃ 347 km s−1 and σgas ≃ 60 km s−1 on average within r < 1.5 kpc (values corrected for beam smearing). We derive vrot/σgas ∼ 6, indicating a disk that is rotationally supported.
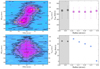 |
Fig. 6. Results of the 3DBarolo dynamical modelling of the [CII] emission line. Top and bottom left: PV diagrams of the [CII] emission line along the line of nodes (PA = 200 deg) and orthogonal to it (PA = 290 deg), performed with 3DBarolo. Contours are at 2, 3, 6, and 12σ, with σ = 0.22 mJy, for the data (solid black lines) and the best-fit model (dashed orange lines). Sampling is performed with five radii, spaced by 0.045 arcsec. Yellow stars show the disk model. Top and bottom right: rotational velocity, vrot, and gas velocity dispersion, σgas, as a function of radius for the best-fit disk model. To compute the top and bottom error bars for the rotational velocity, we performed the modelling by varying the disk inclination i = 20 and 45 deg, respectively. The grey shaded area marks the central beam (rbeam ∼ 0.08 arcsec), and grey points are those computed including the central beam. |
The total dynamical mass enclosed within a radius r = 1.7 kpc (∼0.3 arcsec) is 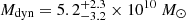 , consistent with that derived from CO(6-5) in approximately the same region (Feruglio et al. 2018) and from previous [CII] lower-resolution observations (Wang et al. 2013). The uncertainties on Mdyn were obtained by propagating the error for vrot at R = 1.7 kpc. Since the gas mass measured from CO is MH2 = 4.2 × 10¹⁰ M⊙ (see Sect. 4.2), dynamical models with i > 30 deg, which imply Mdyn ≲ 4 × 10¹⁰ M⊙, can be ruled out. This restricts the range of possible values for the inclination to [20, 30] deg, supporting the choice of i = 25 deg in the dynamical modelling of the disk.
The Toomre parameter, spatially averaged across the entire emission within r < 1.5 kpc, is  for a flat rotation curve, where Σgas is the gas surface density derived from [CII] within the radius r. Considering also the Toomre parameter for the stellar component, the global Q would be lower than this value (Aumer et al. 2010). In Fig. 7 we show the radial profile of Qgas, where we computed the molecular gas surface mass density, taken in the same annuli as defined for the dynamical modelling (see Fig. 6), and we propagated the uncertainties of vrot and Σgas. The vrot and σv are those derived by the model of 3DBarolo at different radii (see top and bottom right panels of Fig. 6). The grey shaded area, as before, marks the region of the central beam, and the grey points are computed using the vrot and σv of the 3DBarolo model including the central beam. Qgas is in the range 3–13 in at r < 0.4 kpc, reflecting the flat rotation curve and high value of vrot at the centre. For r > 0.8 kpc, Qgas ≈ 1 − 5 is close to the critical value commonly adopted for the gas component (Genzel et al. 2014; Leroy et al. 2008), indicating that the disk is unstable against gravitational collapse, can fragment, and may eventually lead to star formation. Qgas ∼ 1 was reported for QSO J234833.34–305410.0 at z ∼ 7 (Walter et al. 2022).
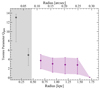 |
Fig. 7. Gas Toomre parameter Qgas as a function of the radius from the centre position of the [CII] emission, computed for the annuli used in the 3DBarolo [CII] modelling (see Sect. 4.2 and Fig. 6). The grey shaded area marks the region of the central beam (rbeam ∼ 0.08 arcsec), and grey points are computed using the vrot and σv of the 3DBarolo model including the central beam. |
In Fig. 8, the velocity-integrated contour maps of the blue and red wings, obtained by collapsing the spectral channels within the regions marked with blue and red lines in the [CII] spectrum of Fig. 2, are shown overplotted on the 3DBarolo residuals of the [CII] velocity and velocity dispersion maps. The contour maps contain a contribution from the disk because the disk model is not subtracted from the data cube and from the corresponding maps, from which we extracted the contours. To evaluate the disk contribution to the wings, we used the [CII] spectrum and the double-Gaussian fit in Fig. 2. After subtracting the double-Gaussian components from the [CII] spectrum, we found that the integrated fluxes for the red and blue wings are Fred = 118 mJy km s−1 and Fblue = 144 mJy km s−1, respectively, evaluated by integrating the flux in the spectral regions marked by the vertical blue and red lines in the [CII] spectrum of Fig. 2. Comparing these integrated fluxes with the total integrated flux in the same velocity range, we obtained that Fred/Ftot ∼ 65% and Fblue/Ftot ∼ 80%. This implies that for the blue wing, the contribution of the disk is modest in the contours of Fig. 8; for the red wing, the disk has a greater impact, but the contribution of the wing is still dominant. The dashed yellow line is the kinematic major axis, and the stars mark the peak positions of the emission of the blue and red wings. These high-velocity emission regions are seen up to 3σ in the PV diagrams taken along the major and minor axes, within the offset r ∼ 0.1 arcsec, and with an LOS velocity about ±300 km s−1 on the blue and red sides of the line. Along the minor kinematic axis, the disk dynamical model (orange contours) is not able to reproduce this excess emission, indicating that the latter is not produced by the beam-smearing effect, but is rather due to a different kinematic component.
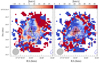 |
Fig. 8. 3DBarolo residuals of mean velocity map (left panel) and velocity dispersion map (right panel) of the [CII] emission line. The contours of red and blue wings are overplotted. Levels are 2.5, 3, 4, 5, and 6σ, with σ = 39 μJy for the red wing and σ = 43 μJy for the blue wing. The red and blue wings have been selected from the [CII] spectrum as shown in Fig. 2. The dashed yellow line is the kinematic major axis of the [CII] line, at PA = 200 deg. The clean beam is indicated in the lower left corner. The excesses at the border of the source should not be considered because they are due to the poor subtraction of the noise. |
These high-velocity blue- and redshifted emissions located in the nuclear region do not follow the rotation curve of the main disk and may be due either to an unresolved circumnuclear disk tilted with respect to the main one, or to an outflow. The high excess in LOS velocity between these components and the best-fit disk (vLOS, disk ∼ 100 km s−1) suggests that these blue- and redshifted emissions are due to an outflow and not to a tilted, unresolved nuclear disk. We derived the flux density SνΔv of these two components by subtracting the double-Gaussian fit from the total [CII] spectrum, and integrating in the respective velocity ranges (see Fig. 2). We computed the luminosity of the wings straightforwardly by applying Eq. (1) from Solomon & Vanden Bout (2005) and their outflow mass using Eq. (4). We obtained an outflow mass of Mout = 1.9 × 10⁸ M⊙ and Mout = 1.6 × 10⁸ M⊙ for the blue and red wings, respectively. Assuming the scenario of time-averaged expelled shells or clumps (Rupke et al. 2005), we computed the mass outflow rate for the blue and red wings,
 (5)
(5)
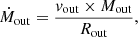
where vout is the projected outflow velocity defined as the velocity at which the integrated flux of each wing is 98% of their total integrated flux with respect to the systemic velocity. We estimated vout, blue = −490 km s−1 and vout, red = 535 km s−1 from the line profile in Fig. 2. We defined as outflow radius, Rout, the projected separation between the peaks of the red and blue wings and the [CII] peak position, that is, Rout, blue = 0.6 kpc and Rout, red = 0.3 kpc. We then obtain an upper limit Ṁout ≲ 4500 M⊙ yr−1 by adding the red and blue components, and adopting as outflow radius the maximum Rout(=0.6 kpc). However, depending on the LOS inclination, the intrinsic Rout may be larger than our estimate. Because these data do not allow resolving the kinematics of the outflow, an estimate of the lower limit for the mass outflow rate can be derived assuming an outflow size equal to the clean beam, Rout ∼ 1 kpc. This implies that a lower-limit outflow rate would be Ṁout ≳ 1800 M⊙ yr−1.
We computed the kinetic power associated with the outflow as 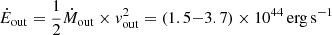 , and the wind momentum load
 (6)
(6)
where ṖAGN is the AGN radiation momentum rate. We adopted a bolometric luminosity of Lbol = 3.13 × 1047 erg s−1, derived from the rest-frame continuum at 3000 Å(Bischetti et al., in prep.) and the bolometric correction from Runnoe et al. (2012). This yields Ėout/Lbol ∼ 0.0005 − 0.001 and 0.6 ≲ Ṗout/ṖAGN ≲ 1.4.
4.3. H2O resolved emission
We identified the emission line detected at 274.074 GHz as the H2O v = 03(2, 2) − 3(1, 3) transition at rest frequency 1919.359 GHz. The emission line is detected with a 10σ statistical significance, and the velocity gradient and PA are consistent with those derived for [CII]. Water vapour emission traces the molecular warm dense phase of the interstellar medium (Liu et al. 2017), and is detected in only a few QSOs at z > 6 (Pensabene et al. 2021; Lehnert et al. 2020; Yang et al. 2019). This is the first time that the emission is spatially resolved and consistent with a rotating water vapour disk. We estimated a first-order dynamical mass using H2O. Adopting the same inclination as for the [CII] disk, i = 25 deg, we derived Mdyn, H2O = 1.16 × 10⁵(0.75 × FWHMH2O)2 × D/sin2(i) = 6.4 × 10¹⁰ M⊙, with FWHMH2O = 340 km s−1 and D = 1.5 kpc (averaged source size in kiloparsecs, Table 2).
An alternative scenario for the identification of this line would be the [CII] line from the DLA J2310+1855 located at z = 5.938646 (D’Odorico et al. 2018, see Sect. 4.4). If the DLA had a line-emitting counterpart on the QSO sightline, its [CII] emission would happen at 273.906 GHz, which is also consistent with the observed line frequency. However, because the velocity gradient, the FWHM of the line, and the dynamical mass are consistent with those derived from [CII] for the QSO host galaxy, we discard this scenario and conclude that this line is due to H2O from the ISM of the QSO host galaxy and not to [CII] from the proximate DLA.
In Fig. 9 we compare the H2O 322 − 313 line luminosity with the total IR luminosity of J2310+1855 obtained through the fit of the dust SED (MBB component only, see Sect. 4.1), together with a compilation of z ∼ 2.5 − 3.5 Hy/ULIRGs from Yang et al. (2016), APM 08279+5255 at z ≃ 3.9 (van der Werf et al. 2011), the z ≃ 6.34 SMG HFLS 3 (Riechers et al. 2013), the QSO host galaxy J0439+1634 at z ≃ 6.5 (Yang et al. 2019), QSO BR1202–0725 at z = 4.695 (Lehnert et al. 2020), and two QSO host galaxies at z > 6 PJ231-20 and PJ308-21 (Pensabene et al. 2021), which all have a H2O 321 − 312 detection, except for the one of Lehnert et al. (2020), which has H2O 220 − 211. We also show the best power-law fit found by Yang et al. (2013) with 1σ confidence limits, 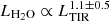 . Our result for J2310 agrees very well with the increasing trend of the data and the linear relation of Yang et al. (2013). We note that when the contribution of the hot dust heated by the QSO is implied, it would imply LTIR = 8.4 × 10¹³ L⊙, and would move J2310+1855 well below the correlation. These data suggest that the H2O line is mainly excited by IR-pumping mechanism of the dust-reprocessed UV radiation field in the ISM of the host galaxy (Yang et al. 2013, 2016; Pensabene et al. 2021).
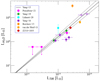 |
Fig. 9. LH2O − LTIR relation for QSO J2310+1855 and a compilation of high-redshift QSOs and SMGs with H2O detection. The solid black line traces the best power-law fit from Yang et al. (2013). The dashed lines are the 1σ confidence limit. |
4.4. Environment of the QSO
First, we studied the field at the position of the line emitter presented in D’Odorico et al. (2018), called Serenity-18. Serenity-18 is a candidate CO(6-5) emitter at a redshift z = 5.9386, associated with a proximate DLA system located at z = 5.938646 ± 0.000007 on the QSO sightline. The frequency setup of this observation covers the [CII] emission line, expected at 273.9 GHz, and the sub-mm continuum of Serenity-18 (Fig. 3). At the position of Serenity-18 (RA, Dec = [23:10:38.44, 18:55:21.95]), we derived a 3σ upper limit on the 265 GHz dust continuum of S265.4 GHz < 0.026 mJy. Assuming a dust temperature of 40 K, an emissivity β = 1.5 (Sommovigo et al. 2021), and a source size equal to the clean beam size, this translates into an upper limit on the dust mass of Mdust < 6 × 10⁶ M⊙. For the [CII] emission line, we derived a 3σ upper limit of Sdv[CII] < 28.2 mJy km s−1, assuming a line width of 200 km s−1 (equal to the FWHM reported in D’Odorico et al. 2018). This implied an upper limit on the luminosity of the [CII] line of L[CII] < 2.7 × 10⁷ L⊙. Adopting the SFR − L[CII] correlation from Carniani et al. (2018), this yielded an upper-limit star formation rate of SFR < 2.5 M⊙ yr−1. By applying the SFR − L[CII] correlation found by Herrera-Camus et al. (2018) for star-forming main-sequence galaxies with normal star formation efficiency, we found a consistent upper limit of SFR < 3 M⊙ yr−1. This upper limit on the SFR, together with the luminosity ratio of CO(6-5) and [CII], RCO − [CII] > 15, makes it unlikely that DLA J2310+1855 has a [CII]-emitting counterpart, suggesting that the line emitter Serenity-18 is most likely a foreground source at lower redshift, as discussed in D’Odorico et al. (2018).
Another scan of the data cube did not reveal any line emitter at any position down to a luminosity L[CII] = 2.7 × 10⁷ L⊙, assuming a typical line width of 200 km s−1. One continuum emitter was detected (Fig. 3, Sect. 3.2). We conclude that this QSO is isolated. It does not show close companions or signatures of an ongoing merger.
5. Discussion and summary
We reported results from a deep ALMA observation of the sub-mm continuum, [CII], and H2O emission lines with 900 pc resolution, complemented by multiple ALMA archival datasets probing the infrared continuum emission of the z ∼ 6 QSO J2310+1855. The 900 pc resolution of this dataset allowed us to perform a detailed study of dust properties and cold gas kinematics and dynamics.
The accurate sampling of the QSO SED, especially at lower wavelengths (λ ∼ 10 − 100 μm), allowed us to constrain the dust temperature, Tdust = 71 ± 4 K, dust mass, Mdust = (4.4 ± 0.7)×108 M⊙, and emissivity index, β = 1.86 ± 0.12 with high accuracy. We modelled the large-scale dust in the ISM and dusty torus emission with an MBB and dusty torus templates. The values of dust temperature and dust mass are about two times higher and about four times lower, respectively, than those derived by Shao et al. (2019). One likely cause of discrepancy can be the different treatment of the dusty torus contribution in the SED. While we used a library of SED templates, SKIRTOR, Shao et al. (2019) used the cumpy AGN tori in a 3D geometry (CAT 3D) model (Hönig & Kishimoto 2017) to represent the near-infrared and mid-infrared contributions from the AGN dust torus. Different modelling of the AGN torus can in principle affect the determination of the parameters related to the large-scale dust emission that is modelled with an MBB. In our analysis, we showed that our prescription for the torus does not influence our results for the MBB, but this may not be the case for the modelling presented in Shao et al. (2019). Moreover, the discrepancy for Mdust can be partially explained by the fact that Shao et al. (2019) fixed the dust emissivity index, β, at 1.6, while we left it as a free parameter, obtaining a value of the emissivity of β = 1.86 ± 0.12 (see Table 4). Given that all parameters are strongly correlated, the dust mass increases when β decreases at a fixed dust temperature (see Fig. 4). We derived an  , accounting for the QSO contribution to dust heating and adopting a Chabrier IMF. Assuming a Salpeter IMF, as in Shao et al. (2019), would imply an SFR higher by factor of 1.7 (i.e. SFR ∼ 2108 ± 500 M⊙ yr−1). We obtained a GDR = 101 ± 20, using our estimate of Mdust, and MH2 = 4.4 ± 0.2 × 10¹⁰ M⊙ (Li et al. 2020; Feruglio et al. 2018). This GDR is a factor of 5 larger than the one derived by Shao et al. (2019), who reported a very low GDR = 26 ± 6. Our value of GDR is consistent with the value normally assumed for high-z QSO (GDR = 100, e.g., Walter et al. 2020; Wang et al. 2019) and measured for a few of them (GDR = 100 − 300, Bischetti et al. 2021).
Our analysis of the [CII] kinematics and dynamics, based on the 3DBarolo dynamical model, indicates a disk that is inclined at i ∼ 25 deg, which is rotationally supported with vrot/σgas ∼ 6. The gas Toomre parameter is in the range Q ∼ 1 − 5 out to r = 1.7 kpc, which indicates a marginally unstable disk. The high resolution and high S/N of the [CII] observation allowed us to retrieve the best estimate for the dynamical mass Mdyn = 5.2 × 10¹⁰ M⊙ within r = 1.7 kpc. This enabled us to derive a rough estimate of the stellar mass of the QSO host galaxy, M* = Mdyn − MH2 − MBH ∼ 3 × 10⁹ M⊙, using MBH = 5 × 10⁹ M⊙ derived from the MgII emission line profile (Mazzucchelli in prep). This stellar mass, together with the AGN-corrected SFR, place the QSO host galaxy well above the main sequence for star-forming galaxies at z ∼ 6 (see e.g., Mancuso et al. 2016; Pearson et al. 2018), indicating a strongly star-bursting host galaxy.
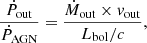
The star formation efficiency of the host galaxy, defined as SFR/MH2 ≃ SFR/Mdyn, is indeed 2.4 × 10⁻⁸ yr−1, bearing in mind that we used a spatially integrated dust-reprocessed SFR. On the other hand, we derive a BH growth efficiency3, ṀBH/MBH = 1.1 × 10⁻⁸ yr−1, where we used the BH mass derived from MgII (MBH = 5 × 10⁹ M⊙, Mazzucchelli in prep.), and assumed ϵ = 0.1 (e.g., Marconi et al. 2004; Martínez-Sansigre et al. 2009; Fernandes et al. 2015). In Fig. 10 we show the MBH and Mdyn for SDSS J2310+1855 and a compilation of QSOs at different redshifts, comparing them with the local MBH − Mdyn relation found by Jiang et al. (2011)4. The majority of QSOs, including J2310+1855, are above the local relation in the BH dominance regime (Volonteri 2012). For J2310+1855, we found ṀBH/MBH < SFR/Mdyn, suggesting that AGN feedback is effectively slowing down the accretion onto the SMBH, while the host galaxy is growing fast (Volonteri 2012). In particular, the BH growth efficiency is ∼50% lower than that of the QSO host galaxy, as represented by the the slope of the red arrow in Fig. 10 (a slope of 45 deg corresponds to the case of SFR/Mdyn = ṀBH/MBH). The shadowed red region arises from the uncertainties on MBH and Mdyn. It is important to bear in mind that the slope of the arrow corresponds to the specific case of (1) Mdyn ≳ Mgas, which is plausible at high z, (2) an SFR that is computed assuming, conservatively, that the FIR luminosity from SFR is about half of the total FIR luminosity, and (3) a BH radiation efficiency of 10%, since a precise determination of this parameter would require a dedicated study of the growth and accretion history of this SMBH, which is beyond the scope of this work. Therefore, a BH growth rate that is lower or similar to that of its host galaxy can be considered a bona fide result. One of the likely causes of the slow-down of the SMBH accretion are radiatively driven AGN winds that impact on the accreting matter, providing enough momentum to stop further accretion, and which can further propagate outwards on the scale of the host galaxy. In SDSS J2310+1855, the SMBH accretion may be limited by the ionised wind traced by a C IV broad absorption line (BAL) system with velocity vBAL = 26 900 km s−1 and balnicity index BI = 600 (Bischetti et al. 2022).
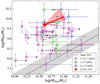 |
Fig. 10. BH mass as a function of the dynamical mass for J2310+1855 (red star), compared with WISSH QSOs at z ∼ 2 − 4 (blue diamonds, from Bischetti et al. 2021), and luminous z ∼ 4 − 7 QSOs (green dots and violet squares, from Venemans et al. 2016, 2017; Willott et al. 2013, 2015, 2017; Kimball et al. 2015; Trakhtenbrot et al. 2017; Feruglio et al. 2018; Mortlock et al. 2011; De Rosa et al. 2014; Kashikawa et al. 2015; Neeleman et al. 2021). Jiang et al. (2011) used bulge masses, while all the other dynamical masses refer to the gas disk component. For J2310, the slope of the red arrow, with its uncertainty (shadowed red region), indicates how much the growth efficiency of the SMBH is slowing down with respect to the growth of the host galaxy. |
SDSS J2310+18655 also shows evidence of a [CII] outflow approximately located in the central kpc, with an outflow mass Mout = 3.5 × 10⁸ M⊙. This is about 5% of the neutral gas mass in the disk, consistent with expectations of recent zoom-in hydrodynamical simulations presented by Valentini et al. (2021). We estimated the mass outflow rate in the range Ṁout = 1800 − 4500 M⊙ yr−1, which also agrees well with the results of zoom-in cosmological hydrodynamical simulations of the z ∼ 6 luminous QSO analysed in Barai et al. (2018), who found ∼ 2000 − 3000 M⊙ yr−1 within 1 kpc. Individual detections of cold gas outflows in very high redshift QSOs are still relatively rare. Currently known cold outflows in z ∼ 6 QSOs are SDSS J114816.64+525150.3 (z = 6.4) by Maiolino et al. (2012), whose outflow rate (Ṁout ≳ 3500 M⊙ yr−1) is broadly consistent with our range, while [CII] outflows in QSO HSC J124353.93+010038.5 (z = 7.07) and HSC J120505.09–000027.9 (z = 6.72, Izumi et al. 2021a,b) have lower-limit outflow rates of about ≳ 100 M⊙ yr−1. A stacking analysis of a large sample of z > 4 QSOs suggests average outflow rates of ∼ 100 M⊙ yr−1 (Bischetti et al. 2019b). We estimated Ėout ∼ 0.0005 − 0.001 Lbol and Ṗout/ṖAGN ∼ 0.6 − 1.4. Comparing these results with the scaling relations derived by Fiore et al. (2017), we note that Ėout/Lbol is consistent with the scaling for ionised winds, and Ṗout/ṖAGN agrees with expectations for momentum-conserving winds. The BAL is only detected through the C IV absorption trough (Bischetti et al. 2022). Its outflow mass and energetics therefore cannot be reliably estimated (Borguet et al. 2013; Byun et al. 2022). This means that current data do not allow us to compare the energetics of these two wind phases.
Although [CII] probes mildly ionised gas, it has recently been proposed as a possible molecular gas tracer. Zanella et al. (2018) derived a L[CII]-to-H2 conversion factor of α[CII] ∼ 22 M⊙/L⊙ for star-forming galaxies at z ∼ 2. Applying this conversion to J2310+1855 would imply a molecular mass of MH2 ∼ 1.1 × 10¹¹ M⊙. In addition to being a factor of 4 larger than the molecular mass derived from CO (Feruglio et al. 2018), this is also about three times higher than the dynamical mass derived from [CII]. This suggests that the empirical correlation between [CII] luminosity and molecular mass (e.g., Zanella et al. 2018) does not apply to high-z hyper-luminous QSOs. We estimated the neutral gas mass of the disk based on [CII] emission, MHI = 6.6 × 10⁹ M⊙, which is significantly lower than the molecular mass based on CO lines (Feruglio et al. 2018; Shao et al. 2019). The total gas surface density Σ(HI+H2) (= 13809 M⊙ pc−2) within the [CII] half-light radius, together with the AGN-corrected SFR surface density ΣSFR = (521 M⊙ yr−1 kpc−2), shows that the host galaxy lies above the region of the local Kennicutt-Schmidt (KS) relation that is usually occupied by starbursting galaxies (e.g., Bigiel et al. 2008). Recent zoom-in high-resolution simulations (Pallottini et al. 2022) and semi-analytical models (Vallini et al. 2021) found burstiness parameters, ks, in the range ∼3 − 100 for z ≳ 6 galaxies. For our QSO, we find ks ∼ 5, implying a starbursting host galaxy.
Comparing the surface brightness profiles of the continuum, [CII] and CO(6-5), we found that the dust (r ∼ 6.7 kpc) is more extended than [CII] (r ∼ 5 kpc) and CO (r ∼ 4.7 kpc), whereas it is more peaked at the centre. A similar behaviour with a steeper dust continuum distribution is seen in other high z QSOs (e.g., Walter et al. 2022) and has been attributed to the contribution of the QSO to the dust heating. The ratio of integrated [CII] to TIR luminosity over the whole source is L[CII]/LTIR ∼ 6 × 10⁻⁵. This [CII] deficit is also predicted for high-z galaxies by semi-analytical models of galaxy evolution (e.g., Lagache et al. 2018), where the [CII] deficit arises from the high intensity of the interstellar radiation field. Our estimate of L[CII]/LTIR agrees well with their results at z ∼ 6 when we extrapolate their predictions at higher LTIR. Carniani et al. (2018) studied the L[CII] − SFR relation for high-z galaxies and reported that the local relation for star-forming galaxies (see De Looze et al. 2014) is still valid at high z, but with a twice higher dispersion than observed locally. Our results agree very well (< 1σ) with the correlation of Carniani et al. (2018), with the relation for local star-forming galaxy of Herrera-Camus et al. (2018), and with the results for high-z galaxies of Lagache et al. (2018).
For the first time, we were able to map a spatially resolved H2O v = 03(2, 2) − 3(1, 3) emission line at νobs = 274.074 GHz at a statistical significance of 10σ. Its emission is consistent with a water vapour disk whose kinematics agrees with the [CII] disk. From the observed H2O velocity gradient and adopting i = 25 deg, we estimated Mdyn, H2O = 6.4 × 10¹⁰ M⊙ within a diameter of D = 1.5 kpc. The luminosity ratio LH2O/LTIR, MBB = 1.4 × 10⁻⁵ is consistent with line excitation by dust-reprocessed star formation in the ISM of the host galaxy. However, the faintness of this emission line makes it unsuitable for more detailed dynamical studies.
Finally, we studied the environment of J2310+1855, scanning the data cube for line emitters. No line emitter was detected down to a 3σ upper limit of L[CII] < 2.7 × 10⁷ L⊙, or SFR < 2.5 M⊙ yr−1. We also note that the proximate DLA J2310+1855 did not show any line-emitting counterpart down to this limit, and therefore, the line emitter reported in D’Odorico et al. (2018), called Serenity-18, is most likely a lower-z interloper. In the continuum data, we found a low-significance (4σ) continuum emitter located 4 arcsec offset from the QSO position, whose physical association with the QSO remains to be confirmed. This led us to conclude that the QSO J2310 does not show any evidence of companions, interaction, or merger at least on scales of ∼50 kpc. Other observations suggested that 20–50% of QSOs show mergers or close companions, independent of their luminosity (Decarli et al. 2018; Venemans et al. 2020; Neeleman et al. 2021). In a recent cosmological simulation of a z ∼ 6 QSO, Zana et al. (2022) computed the number of companions associated with a QSO. Based on their results, we would expect to detect three companions with L[CII] ∼ 108 L⊙ within 250 kpc from the QSO, and seven companions with L[CII] = 2.7 × 10⁷ L⊙ in approximately the same region.
6. Conclusions
The picture that finally arises is that of an isolated QSO, without evidence of ongoing mergers, that is characterised by a rotationally supported disk with a Toomre parameter Qgas ∼ 3 out to a radius of 1.5 kpc. The gas kinematics shows evidence of a gaseous outflow within the central kpc, as also supported by the flat rotation curve and the rather high velocity dispersion at the nucleus. To better constrain the nuclear gas kinematics and spatially resolve the outflow, observations with a resolution of ∼0.03 arcsec are required. Moreover, the fact that SFR/Mdyn > ṀBH/MBH suggests that the SMBH accretion is slowing down in this QSO, probably owing to the BAL wind seen in CIV, while the stellar mass assembly takes place vigorously in the host galaxy. Our study may suggest that this z ∼ 6 QSO is witnessing the fall of the black-hole dominance phase. In order to test whether this conclusion can be generalised to the entire population of z ≳ 6 QSOs, we aim to complement this study through the analysis of other QSOs at high z in order to confirm or rule out a particular evolutionary scenario. In particular, to allow precise constraints on the BH and host-galaxy evolutionary paths for a larger sample of high-z QSOs, it is essential to obtain a reliable and accurate determination of the SFR in the host galaxies. The uncertainty on the SFR strongly depends on the accuracy in the estimates of Tdust and Mdust, based on the SED analysis. Therefore, we highlight the need for observations with ALMA bands 8–10 to probe near the peak of the cold dust SED, enabling us to achieve high precision in the determination of the SFR.
Lines were detected in channel ranges 107 ∼ 185 for spw0 (H2O) and 72 ∼ 168 ([CII]) for spw1.
The maximum size coincides with the radius at which the brightness profile reaches the zero level, within the error bars. It is shown more clearly in the zoomed panel of Fig. 5.
ṀBH = Lbol/(ϵ c2), where ϵ is the radiative efficiency, and c is the speed of light.
We note that Jiang et al. (2011) used bulge dynamical masses, while for all the other QSOs, the dynamical mass refers to the gas disk component.
Acknowledgments
We thank the anonymous referee for her or his careful review of the paper and insightful suggestions. This paper makes use of the following ALMA data: ADS/JAO.ALMA#2019.1.00661.S, ADS/JAO.ALMA#2019.1.01721.S, ADS/JAO.ALMA#2015.1.00584.S, ADS/JAO.ALMA#2015.1.01265.S, ADS/JAO.ALMA#2018.1.00597.S, ADS/JAO.ALMA#2013.1.00462.S, ADS/JAO.ALMA#2017.1.01195.S. ALMA is a partnership of ESO (representing its member states), NFS (USA) and NINS (Japan), together with NRC (Canada), MOST and ASIAA (Taiwan) and KASI (Republic of Korea), in cooperation with the Republic of Chile. The Joint ALMA Observatory is operated by ESO, AUI/NRAO and NAOJ. R.T. acknowledges financial support from the University of Trieste. Authors acknowledge support from PRIN MIUR project “Black Hole winds and the Baryon Life Cycle of Galaxies: the stone-guest at the galaxy evolution supper”, contract #2017PH3WAT. R.M. acknowledges ERC Advanced Grant 695671 QUENCH, and support from the UK Science and Technology Facilities Council (STFC). R.M. also acknowledges funding from a research professorship from the Royal Society. S.Ca, A.P. and L.V. acknowledge support from the ERC Advanced Grant INTERSTELLAR H2020/740120 (PI: Ferrara). This paper makes extensive use of python packages, libraries and routines, such as numpy, scipy and astropy. Facilities: ALMA, Herschel. Software: CASA (v5.1.1-5, McMullin et al. 2007).
References
- Aalto, S., Garcia-Burillo, S., Muller, S., et al. 2012, A&A, 537, A44 [NASA ADS] [CrossRef] [EDP Sciences] [Google Scholar]
- Aalto, S., Garcia-Burillo, S., Muller, S., et al. 2015, A&A, 574, A85 [NASA ADS] [CrossRef] [EDP Sciences] [Google Scholar]
- Aumer, M., Burkert, A., Johansson, P. H., & Genzel, R. 2010, ApJ, 719, 1230 [NASA ADS] [CrossRef] [Google Scholar]
- Barai, P., Gallerani, S., Pallottini, A., et al. 2018, MNRAS, 473, 4003 [NASA ADS] [CrossRef] [Google Scholar]
- Beelen, A., Cox, P., Benford, D. J., et al. 2006, ApJ, 642, 694 [NASA ADS] [CrossRef] [Google Scholar]
- Bertoldi, F., Carilli, C. L., Cox, P., et al. 2003a, A&A, 406, L55 [NASA ADS] [CrossRef] [EDP Sciences] [Google Scholar]
- Bertoldi, F., Cox, P., Neri, R., et al. 2003b, A&A, 409, L47 [NASA ADS] [CrossRef] [EDP Sciences] [Google Scholar]
- Bigiel, F., Leroy, A., Walter, F., et al. 2008, AJ, 136, 2846 [NASA ADS] [CrossRef] [Google Scholar]
- Bischetti, M., Piconcelli, E., Feruglio, C., et al. 2019a, A&A, 628, A118 [NASA ADS] [CrossRef] [EDP Sciences] [Google Scholar]
- Bischetti, M., Maiolino, R., Carniani, S., et al. 2019b, A&A, 630, A59 [NASA ADS] [CrossRef] [EDP Sciences] [Google Scholar]
- Bischetti, M., Feruglio, C., Piconcelli, E., et al. 2021, A&A, 645, A33 [NASA ADS] [CrossRef] [EDP Sciences] [Google Scholar]
- Bischetti, M., Feruglio, C., D’Odorico, V., et al. 2022, Nature, 605, 244 [NASA ADS] [CrossRef] [Google Scholar]
- Borguet, B. C. J., Arav, N., Edmonds, D., Chamberlain, C., & Benn, C. 2013, ApJ, 762, 49 [NASA ADS] [CrossRef] [Google Scholar]
- Byun, D., Arav, N., & Hall, P. B. 2022, ApJ, 927, 176 [NASA ADS] [CrossRef] [Google Scholar]
- Carilli, C. L., & Walter, F. 2013, ARA&A, 51, 105 [NASA ADS] [CrossRef] [Google Scholar]
- Carniani, S., Maiolino, R., Amorin, R., et al. 2018, MNRAS, 478, 1170 [NASA ADS] [CrossRef] [Google Scholar]
- Carniani, S., Gallerani, S., Vallini, L., et al. 2019, MNRAS, 489, 3939 [NASA ADS] [Google Scholar]
- Chabrier, G. 2003, PASP, 115, 763 [Google Scholar]
- Cicone, C., Maiolino, R., Gallerani, S., et al. 2015, A&A, 574, A14 [NASA ADS] [CrossRef] [EDP Sciences] [Google Scholar]
- Combes, F., Rex, M., Rawle, T. D., et al. 2012, A&A, 538, L4 [NASA ADS] [CrossRef] [EDP Sciences] [Google Scholar]
- Cormier, D., Madden, S. C., Lebouteiller, V., et al. 2015, A&A, 578, A53 [CrossRef] [EDP Sciences] [Google Scholar]
- da Cunha, E., Groves, B., Walter, F., et al. 2013, ApJ, 766, 13 [Google Scholar]
- Davies, R., Förster Schreiber, N. M., Cresci, G., et al. 2011, ApJ, 741, 69 [NASA ADS] [CrossRef] [Google Scholar]
- Decarli, R., Walter, F., Venemans, B. P., et al. 2018, ApJ, 854, 97 [Google Scholar]
- De Looze, I., Cormier, D., Lebouteiller, V., et al. 2014, A&A, 568, A62 [NASA ADS] [CrossRef] [EDP Sciences] [Google Scholar]
- De Rosa, G., Venemans, B. P., Decarli, R., et al. 2014, ApJ, 790, 145 [Google Scholar]
- Di Mascia, F., Gallerani, S., Behrens, C., et al. 2021, MNRAS, 503, 2349 [NASA ADS] [CrossRef] [Google Scholar]
- Di Teodoro, E. M., & Fraternali, F. 2015, MNRAS, 451, 3021 [Google Scholar]
- D’Odorico, V., Feruglio, C., Ferrara, A., et al. 2018, ApJ, 863, L29 [Google Scholar]
- Downes, D., & Solomon, P. M. 1998, ApJ, 507, 615 [NASA ADS] [CrossRef] [Google Scholar]
- Draine, B. T., Dale, D. A., Bendo, G., et al. 2007, ApJ, 663, 866 [NASA ADS] [CrossRef] [Google Scholar]
- Duras, F., Bongiorno, A., Piconcelli, E., et al. 2017, A&A, 604, A67 [NASA ADS] [CrossRef] [EDP Sciences] [Google Scholar]
- Faucher-Giguère, C.-A., & Quataert, E. 2012, MNRAS, 425, 605 [Google Scholar]
- Fernandes, C. A. C., Jarvis, M. J., Martínez-Sansigre, A., et al. 2015, MNRAS, 447, 1184 [Google Scholar]
- Feruglio, C., Maiolino, R., Piconcelli, E., et al. 2010, A&A, 518, L155 [NASA ADS] [CrossRef] [EDP Sciences] [Google Scholar]
- Feruglio, C., Fiore, F., Carniani, S., et al. 2018, A&A, 619, A39 [NASA ADS] [CrossRef] [EDP Sciences] [Google Scholar]
- Fiore, F., Feruglio, C., Shankar, F., et al. 2017, A&A, 601, A143 [NASA ADS] [CrossRef] [EDP Sciences] [Google Scholar]
- Genzel, R., Förster Schreiber, N. M., Lang, P., et al. 2014, ApJ, 785, 75 [NASA ADS] [CrossRef] [Google Scholar]
- Hailey-Dunsheath, S., Nikola, T., Stacey, G. J., et al. 2010, ApJ, 714, L162 [Google Scholar]
- Hashimoto, T., Inoue, A. K., Tamura, Y., et al. 2019, PASJ, 71, 109 [NASA ADS] [CrossRef] [Google Scholar]
- Herrera-Camus, R., Sturm, E., Graciá-Carpio, J., et al. 2018, ApJ, 861, 95 [Google Scholar]
- Hollenbach, D. J., & Tielens, A. G. G. M. 1999, Rev. Mod. Phys., 71, 173 [Google Scholar]
- Hönig, S. F., & Kishimoto, M. 2017, ApJ, 838, L20 [Google Scholar]
- Izumi, T., Matsuoka, Y., Fujimoto, S., et al. 2021a, ApJ, 914, 36 [CrossRef] [Google Scholar]
- Izumi, T., Onoue, M., Matsuoka, Y., et al. 2021b, ApJ, 908, 235 [NASA ADS] [CrossRef] [Google Scholar]
- Jiang, L., Fan, X., Hines, D. C., et al. 2006, AJ, 132, 2127 [NASA ADS] [CrossRef] [Google Scholar]
- Jiang, Y.-F., Greene, J. E., & Ho, L. C. 2011, ApJ, 737, L45 [NASA ADS] [CrossRef] [Google Scholar]
- Johnson, J. L., & Haardt, F. 2016, PASA, 33, e007 [NASA ADS] [CrossRef] [Google Scholar]
- Kashikawa, N., Ishizaki, Y., Willott, C. J., et al. 2015, ApJ, 798, 28 [Google Scholar]
- Kimball, A. E., Lacy, M., Lonsdale, C. J., & Macquart, J. P. 2015, MNRAS, 452, 88 [NASA ADS] [CrossRef] [Google Scholar]
- Lagache, G., Cousin, M., & Chatzikos, M. 2018, A&A, 609, A130 [NASA ADS] [CrossRef] [EDP Sciences] [Google Scholar]
- Lehnert, M. D., Yang, C., Emonts, B. H. C., et al. 2020, A&A, 641, A124 [NASA ADS] [CrossRef] [EDP Sciences] [Google Scholar]
- Leroy, A. K., Walter, F., Brinks, E., et al. 2008, AJ, 136, 2782 [Google Scholar]
- Leroy, A. K., Bolatto, A., Gordon, K., et al. 2011, ApJ, 737, 12 [Google Scholar]
- Li, J., Wang, R., Riechers, D., et al. 2020, ApJ, 889, 162 [NASA ADS] [CrossRef] [Google Scholar]
- Li, J., Venemans, B. P., Walter, F., et al. 2022, ApJ, 930, 27 [NASA ADS] [CrossRef] [Google Scholar]
- Liu, L., Weiß, A., Perez-Beaupuits, J. P., et al. 2017, ApJ, 846, 5 [Google Scholar]
- Madden, S. C., Cormier, D., Hony, S., et al. 2020, A&A, 643, A141 [NASA ADS] [CrossRef] [EDP Sciences] [Google Scholar]
- Maiolino, R., Cox, P., Caselli, P., et al. 2005, A&A, 440, L51 [NASA ADS] [CrossRef] [EDP Sciences] [Google Scholar]
- Maiolino, R., Gallerani, S., Neri, R., et al. 2012, MNRAS, 425, L66 [Google Scholar]
- Mancuso, C., Lapi, A., Shi, J., et al. 2016, ApJ, 833, 152 [NASA ADS] [CrossRef] [Google Scholar]
- Marconi, A., Risaliti, G., Gilli, R., et al. 2004, MNRAS, 351, 169 [Google Scholar]
- Martínez-Sansigre, A., Karim, A., Schinnerer, E., et al. 2009, ApJ, 706, 184 [CrossRef] [Google Scholar]
- McMullin, J. P., Waters, B., Schiebel, D., Young, W., & Golap, K. 2007, in Astronomical Data Analysis Software and Systems XVI, eds. R. A. Shaw, F. Hill, & D. J. Bell, ASP Conf. Ser., 376, 127 [Google Scholar]
- Miettinen, O., Delvecchio, I., Smolčić, V., et al. 2017, A&A, 606, A17 [NASA ADS] [CrossRef] [EDP Sciences] [Google Scholar]
- Mortlock, D. J., Warren, S. J., Venemans, B. P., et al. 2011, Nature, 474, 616 [Google Scholar]
- Neeleman, M., Novak, M., Venemans, B. P., et al. 2021, ApJ, 911, 141 [NASA ADS] [CrossRef] [Google Scholar]
- Olsen, K., Pallottini, A., Wofford, A., et al. 2018, Galaxies, 6, 100 [NASA ADS] [CrossRef] [Google Scholar]
- Omont, A., Yang, C., Cox, P., et al. 2013, A&A, 551, A115 [NASA ADS] [CrossRef] [EDP Sciences] [Google Scholar]
- Pallottini, A., Ferrara, A., Gallerani, S., et al. 2022, MNRAS, 513, 5621 [NASA ADS] [Google Scholar]
- Pearson, W. J., Wang, L., Hurley, P. D., et al. 2018, A&A, 615, A146 [NASA ADS] [CrossRef] [EDP Sciences] [Google Scholar]
- Pensabene, A., Decarli, R., Bañados, E., et al. 2021, A&A, 652, A66 [NASA ADS] [CrossRef] [EDP Sciences] [Google Scholar]
- Planck Collaboration XIII. 2016, A&A, 594, A13 [NASA ADS] [CrossRef] [EDP Sciences] [Google Scholar]
- Riechers, D. A., Bradford, C. M., Clements, D. L., et al. 2013, Nature, 496, 329 [Google Scholar]
- Runnoe, J. C., Brotherton, M. S., & Shang, Z. 2012, MNRAS, 422, 478 [Google Scholar]
- Rupke, D. S., Veilleux, S., & Sanders, D. B. 2005, ApJS, 160, 115 [Google Scholar]
- Saintonge, A., Lutz, D., Genzel, R., et al. 2013, ApJ, 778, 2 [Google Scholar]
- Shao, Y., Wang, R., Jones, G. C., et al. 2017, ApJ, 845, 138 [NASA ADS] [CrossRef] [Google Scholar]
- Shao, Y., Wang, R., Carilli, C. L., et al. 2019, ApJ, 876, 99 [NASA ADS] [CrossRef] [Google Scholar]
- Solomon, P. M., & Vanden Bout, P. A. 2005, ARA&A, 43, 677 [NASA ADS] [CrossRef] [Google Scholar]
- Sommovigo, L., Ferrara, A., Carniani, S., et al. 2021, MNRAS, 503, 4878 [NASA ADS] [CrossRef] [Google Scholar]
- Stalevski, M., Ricci, C., Ueda, Y., et al. 2016, MNRAS, 458, 2288 [Google Scholar]
- Trakhtenbrot, B., Lira, P., Netzer, H., et al. 2017, ApJ, 836, 8 [NASA ADS] [CrossRef] [Google Scholar]
- Valentini, M., Gallerani, S., & Ferrara, A. 2021, MNRAS, 507, 1 [NASA ADS] [CrossRef] [Google Scholar]
- Vallini, L., Pallottini, A., Ferrara, A., et al. 2018, MNRAS, 473, 271 [NASA ADS] [CrossRef] [Google Scholar]
- Vallini, L., Ferrara, A., Pallottini, A., Carniani, S., & Gallerani, S. 2021, MNRAS, 505, 5543 [NASA ADS] [CrossRef] [Google Scholar]
- van der Werf, P. P., Berciano Alba, A., Spaans, M., et al. 2011, ApJ, 741, L38 [Google Scholar]
- Venemans, B. P., Walter, F., Zschaechner, L., et al. 2016, ApJ, 816, 37 [Google Scholar]
- Venemans, B. P., Walter, F., Decarli, R., et al. 2017, ApJ, 837, 146 [NASA ADS] [CrossRef] [Google Scholar]
- Venemans, B. P., Walter, F., Neeleman, M., et al. 2020, ApJ, 904, 130 [Google Scholar]
- Volonteri, M. 2010, A&ARv, 18, 279 [Google Scholar]
- Volonteri, M. 2012, Science, 337, 544 [NASA ADS] [CrossRef] [Google Scholar]
- Walter, F., Carilli, C., Neeleman, M., et al. 2020, ApJ, 902, 111 [Google Scholar]
- Walter, F., Neeleman, M., Decarli, R., et al. 2022, ApJ, 927, 21 [NASA ADS] [CrossRef] [Google Scholar]
- Wang, R., Wagg, J., Carilli, C. L., et al. 2013, ApJ, 773, 44 [Google Scholar]
- Wang, F., Wang, R., Fan, X., et al. 2019, ApJ, 880, 2 [NASA ADS] [CrossRef] [Google Scholar]
- Willott, C. J., Omont, A., & Bergeron, J. 2013, ApJ, 770, 13 [NASA ADS] [CrossRef] [Google Scholar]
- Willott, C. J., Bergeron, J., & Omont, A. 2015, ApJ, 801, 123 [NASA ADS] [CrossRef] [Google Scholar]
- Willott, C. J., Bergeron, J., & Omont, A. 2017, ApJ, 850, 108 [Google Scholar]
- Wolfire, M. G., Vallini, L., & Chevance, M. 2022, ARA&A, submitted [arXiv:2202.05867] [Google Scholar]
- Yang, C., Gao, Y., Omont, A., et al. 2013, ApJ, 771, L24 [NASA ADS] [CrossRef] [Google Scholar]
- Yang, C., Omont, A., Beelen, A., et al. 2016, A&A, 595, A80 [NASA ADS] [CrossRef] [EDP Sciences] [Google Scholar]
- Yang, J., Venemans, B., Wang, F., et al. 2019, ApJ, 880, 153 [NASA ADS] [CrossRef] [Google Scholar]
- Zana, T., Gallerani, S., Carniani, S., et al. 2022, MNRAS, 513, 2118 [NASA ADS] [CrossRef] [Google Scholar]
- Zanella, A., Daddi, E., Magdis, G., et al. 2018, MNRAS, 481, 1976 [Google Scholar]
- Zubovas, K., & King, A. 2012, ApJ, 745, L34 [Google Scholar]
All Tables
Measurements and derived quantities for the emission lines and dust continuum in SDSS J231038.88+185519.7.
All Figures
|
Fig. 1. 260 GHz dust continuum map of QSO J2310+1855 (levels −4, −3, −2, 2, 3, 5, 10, 25, and 50σ, σ = 9.15 μJy beam−1). The clean beam (0.26 × 0.21 arcsec2) is indicated in the lower left corner of the diagram. The cross indicates the position of the continuum peak. |
| In the text | |
|
Fig. 2. Moment maps of the [CII] emission line (top panels) and of the emission line detected at 274.084 GHz (bottom panels), identified as the H2O v = 03(2, 2)−3(1, 3). From left to right: integrated flux, mean velocity map, and velocity dispersion map, continuum-subtracted spectra of [CII] (top right) and H2O (bottom right). The clean beam is plotted in the lower right or left corner of the moment maps. The cross indicates the peak position of the integrated flux for each line. The spectra have been extracted from the region included within ≥2σ in the velocity integrated map. In the [CII] spectrum, the vertical blue and red lines highlight the spectral regions in which the flux is higher than in the Gaussian fit (solid purple line). The H2O spectrum has been rebinned to 40 km s−1. |
| In the text | |
|
Fig. 3. Dust continuum maps of the QSO field with different resolutions. Left panel: dust continuum map of the QSO field centred on the phase-tracking centre of the observation. Levels are −3, −2, 2, 3, and 4σ, σ = 8.8 μJy beam−1. The cross indicates the phase centre. In this map the QSO is located at offset [6, −2] arcsec. Central panel: zoomed view towards the phase centre. The clean beam is plotted in the lower left corner. Right panel: 260 GHz dust continuum uv-tapered map of Serenity-18 (levels −4, −3, −2, 2, 4, and 5σ, σ = 15 μJy beam−1). The imaging has been performed with uvtaper = [0.5 arcsec]. The clean beam is indicated in the lower left corner. The black cross indicates the position of the phase-tracking centre, which coincides with the expected position of the CO-emitter Serenity-18 (D’Odorico et al. 2018). The white cross indicates the continuum emitter detected in the beam (see text). |
| In the text | |
|
Fig. 4. Results of the SED fitting of J2310+1855. Left panel: SED of J2310+1855 using ALMA and Herschel data reported in Table 3, fitted with an MBB function (for the dust emission) and the a = 0.0002, τ = 3, p = 0, q = 1.5, oa = 80, R = 30, and i = 20 deg dusty torus model from the SED library SKIRTOR (Stalevski et al. 2016). Dark blue diamonds are computed based on ALMA observations and light blue diamonds based on Herschel observations, as listed in Table 3. Right panel: confidence ellipses for the MBB free parameters Tdust, Mdust, and β computed at 68.27%,95.45%, and 99.99% confidence levels. The dotted blue lines indicate the best-fit parameters. |
| In the text | |
|
Fig. 5. Natural weighting surface brightness for [CII] (red), CO(6-5) (green), and continuum (blue) of J2310, normalised to the respective rms level, as a function of the radius from the peak position of the source. The lower and upper error bars are the 16th and 84th percentiles, respectively. The shadowed regions connect the uncertainties given by the percentiles. The coloured dashed lines show the synthetic beams for each observation. The dashed black lines mark the 0 level of surface brightness. The inset shows a zoomed view at large radii. The CO(6-5) data are taken from Feruglio et al. (2018) and have a clean beam of 0.6 × 0.4 arcsec2. |
| In the text | |
|
Fig. 6. Results of the 3DBarolo dynamical modelling of the [CII] emission line. Top and bottom left: PV diagrams of the [CII] emission line along the line of nodes (PA = 200 deg) and orthogonal to it (PA = 290 deg), performed with 3DBarolo. Contours are at 2, 3, 6, and 12σ, with σ = 0.22 mJy, for the data (solid black lines) and the best-fit model (dashed orange lines). Sampling is performed with five radii, spaced by 0.045 arcsec. Yellow stars show the disk model. Top and bottom right: rotational velocity, vrot, and gas velocity dispersion, σgas, as a function of radius for the best-fit disk model. To compute the top and bottom error bars for the rotational velocity, we performed the modelling by varying the disk inclination i = 20 and 45 deg, respectively. The grey shaded area marks the central beam (rbeam ∼ 0.08 arcsec), and grey points are those computed including the central beam. |
| In the text | |
|
Fig. 7. Gas Toomre parameter Qgas as a function of the radius from the centre position of the [CII] emission, computed for the annuli used in the 3DBarolo [CII] modelling (see Sect. 4.2 and Fig. 6). The grey shaded area marks the region of the central beam (rbeam ∼ 0.08 arcsec), and grey points are computed using the vrot and σv of the 3DBarolo model including the central beam. |
| In the text | |
|
Fig. 8. 3DBarolo residuals of mean velocity map (left panel) and velocity dispersion map (right panel) of the [CII] emission line. The contours of red and blue wings are overplotted. Levels are 2.5, 3, 4, 5, and 6σ, with σ = 39 μJy for the red wing and σ = 43 μJy for the blue wing. The red and blue wings have been selected from the [CII] spectrum as shown in Fig. 2. The dashed yellow line is the kinematic major axis of the [CII] line, at PA = 200 deg. The clean beam is indicated in the lower left corner. The excesses at the border of the source should not be considered because they are due to the poor subtraction of the noise. |
| In the text | |
|
Fig. 9. LH2O − LTIR relation for QSO J2310+1855 and a compilation of high-redshift QSOs and SMGs with H2O detection. The solid black line traces the best power-law fit from Yang et al. (2013). The dashed lines are the 1σ confidence limit. |
| In the text | |
|
Fig. 10. BH mass as a function of the dynamical mass for J2310+1855 (red star), compared with WISSH QSOs at z ∼ 2 − 4 (blue diamonds, from Bischetti et al. 2021), and luminous z ∼ 4 − 7 QSOs (green dots and violet squares, from Venemans et al. 2016, 2017; Willott et al. 2013, 2015, 2017; Kimball et al. 2015; Trakhtenbrot et al. 2017; Feruglio et al. 2018; Mortlock et al. 2011; De Rosa et al. 2014; Kashikawa et al. 2015; Neeleman et al. 2021). Jiang et al. (2011) used bulge masses, while all the other dynamical masses refer to the gas disk component. For J2310, the slope of the red arrow, with its uncertainty (shadowed red region), indicates how much the growth efficiency of the SMBH is slowing down with respect to the growth of the host galaxy. |
| In the text | |
Current usage metrics show cumulative count of Article Views (full-text article views including HTML views, PDF and ePub downloads, according to the available data) and Abstracts Views on Vision4Press platform.
Data correspond to usage on the plateform after 2015. The current usage metrics is available 48-96 hours after online publication and is updated daily on week days.
Initial download of the metrics may take a while.