Fig. 6.
Download original image
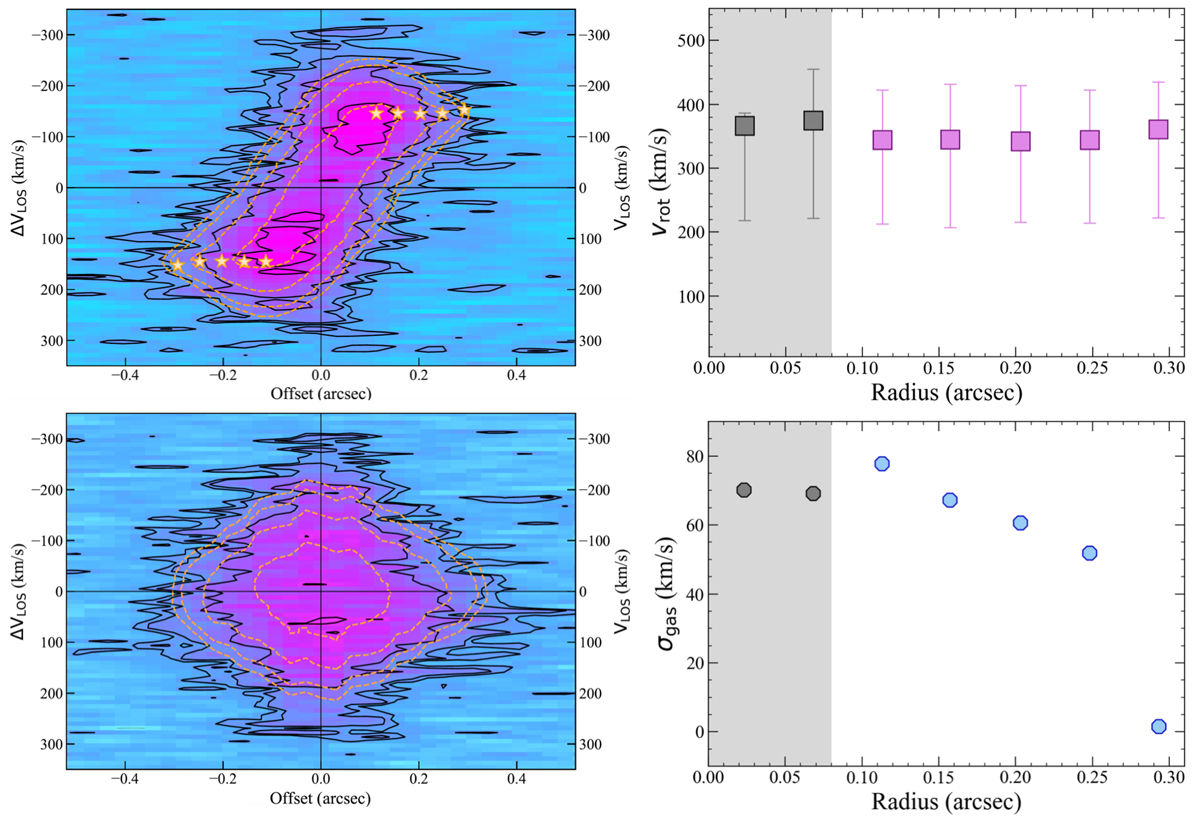
Results of the 3DBarolo dynamical modelling of the [CII] emission line. Top and bottom left: PV diagrams of the [CII] emission line along the line of nodes (PA = 200 deg) and orthogonal to it (PA = 290 deg), performed with 3DBarolo. Contours are at 2, 3, 6, and 12σ, with σ = 0.22 mJy, for the data (solid black lines) and the best-fit model (dashed orange lines). Sampling is performed with five radii, spaced by 0.045 arcsec. Yellow stars show the disk model. Top and bottom right: rotational velocity, vrot, and gas velocity dispersion, σgas, as a function of radius for the best-fit disk model. To compute the top and bottom error bars for the rotational velocity, we performed the modelling by varying the disk inclination i = 20 and 45 deg, respectively. The grey shaded area marks the central beam (rbeam ∼ 0.08 arcsec), and grey points are those computed including the central beam.
Current usage metrics show cumulative count of Article Views (full-text article views including HTML views, PDF and ePub downloads, according to the available data) and Abstracts Views on Vision4Press platform.
Data correspond to usage on the plateform after 2015. The current usage metrics is available 48-96 hours after online publication and is updated daily on week days.
Initial download of the metrics may take a while.