| Issue |
A&A
Volume 695, March 2025
|
|
|---|---|---|
| Article Number | A201 | |
| Number of page(s) | 13 | |
| Section | Extragalactic astronomy | |
| DOI | https://doi.org/10.1051/0004-6361/202452374 | |
| Published online | 20 March 2025 | |
The [NII] 205 μm line emission from high-z submillimeter galaxies and quasar host galaxies
1
INAF – Osservatorio di Astrofisica e Scienza dello Spazio di Bologna, via Gobetti 93/3, I-40129 Bologna, Italy
2
Indian Institute of Science Education and Research, Govt. ITI Building Engg. School Junction, Brahmapur, Odisha 760010, India
3
Institut de Radioastronomie Millimétrique (IRAM), 300 rue de la Piscine, 38400 Saint-Martin-d’Hères, France
4
Sorbonne Université, CNRS UMR 7095, Institut d’Astrophysique de Paris, 98bis bvd Arago, 75014 Paris, France
5
Department of Physics, Winona State University, Winona, MN 55987, USA
6
Argelander-Institute for Astronomy, University of Bonn, Auf dem Hügel 71, D-53121 Bonn, Germany
7
Max-Planck-Institut für Radioastronomie, Auf dem Hügel 69, D-53121 Bonn, Germany
8
Leiden Observatory, Leiden University, Niels Bohrweg 2, NL-2333 CA Leiden, Netherlands
9
I. Physikalisches Institut, Universitát zu Köln, Zülpicher Strasse 77, 50937 Köln, Germany
10
Gemini Observatory, NSF’s NOIRLab, 670 N A’ohoku Place, Hilo, Hawai’i 96720, USA
11
Max-Planck Institut für Astronomie, Königstuhl 17, D-69117 Heidelberg, Germany
⋆ Corresponding author; This email address is being protected from spambots. You need JavaScript enabled to view it.
Received:
26
September
2024
Accepted:
31
January
2025
Abstract
We present [NII] 205 μm fine structure line observations of three submillimeter galaxies (SMGs) and three quasar host galaxies (QSOs) at 4 ≲ z ≲ 6 using the Institut de radioastronomie millimétrique (IRAM) interferometer. The [NII] emission is detected in three sources, and we report detections of the underlying dust continuum emission in all sources. The observed [NII]-to-infrared luminosity ratio spans at least 0.5 dex for our sources. Comparing our estimates with sources detected in the [NII] 205 μm at similar redshifts shows that the overall [NII]-to-IR luminosity ratio spans over 1 dex in magnitude from L[NII]/LIR ∼ 10−4–10−5 and follows the trend of the so-called [NII] fine structure line deficit observed in (ultra)-luminous IR galaxies in the local Universe. The [CII]-to-[NII] luminosity ratio is greater than ten for most of our sources, indicating that the bulk of the [CII] 158 μm line emission (f([CII]PDR) > 75%) arises from the neutral medium. From our analysis, we do not find significant differences in the [NII] 205 μm emission and the respective ratios between SMGs and QSOs, suggesting a negligible contribution to the boosting of [NII] 205 μm emission due to the active galactic nucleus (AGN) photoionization. Future investigations involving other fine structure lines and optical diagnostics will provide further insight into a suite of ionized medium properties and reveal the diversity between AGN and non-AGN environments.
Key words: galaxies: high-redshift / galaxies: ISM / quasars: emission lines / submillimeter: galaxies / submillimeter: ISM
© The Authors 2025
 Open Access article, published by EDP Sciences, under the terms of the Creative Commons Attribution License (https://creativecommons.org/licenses/by/4.0), which permits unrestricted use, distribution, and reproduction in any medium, provided the original work is properly cited.
This article is published in open access under the Subscribe to Open model. This email address is being protected from spambots. You need JavaScript enabled to view it. to support open access publication.
1. Introduction
Investigating the physical properties of the interstellar medium (ISM), such as its amount of molecular gas, dust opacity, electron density, hardness of radiation fields, and metal enrichment, can shed light on vital processes, including the baryon cycle and the impact of the active galactic nucleus (AGN) in galaxies. In local galaxies, these physical properties are typically estimated using rest frame optical/UV line diagnostics, for example, Hα, Hβ, [OII] 3727 Å, [OIII] 5007 Å, and [NII] 6584 Å (e.g., Baldwin et al. 1981; Veilleux & Osterbrock 1987; Keenan et al. 1996; Izotov et al. 2006). However, these lines are either generally faint or inaccessible by ground-based telescopes at high redshift, as they are shifted to wavelengths where the atmosphere is opaque and can only be targeted by sensitive space telescopes such as the James Webb Space Telescope (JWST, Cameron et al. 2023; Katz et al. 2023; Sanders et al. 2023). Excitingly, JWST has been successful in securing key optical diagnostics, such as the Hα and [OIII] lines, from the very first galaxies at z ≥ 10 (Álvarez-Márquez et al. 2024; Hsiao et al. 2024; Zavala et al. 2025).
Prior to the historic launch of JWST, however, such properties of high-redshift galaxies were studied by observing molecular or atomic tracers whose emission lines are shifted in the millimeter and submillimeter wavelength ranges and hence are accessible by ground-based telescopes, with an additional advantage of not being too affected by dust obscuration. In particular, rotational molecular transitions, associated with molecules such as CO and H2O, and forbidden atomic fine structure lines emitted in the infrared from carbon, oxygen, nitrogen, and their ions (e.g., [CI] 370 μm, [CII] 158 μm, [OIII] 88 μm, [NII] 122 μm) have been detected in numerous high-redshift galaxies in the past few years (e.g., Bertoldi et al. 2003; Walter et al. 2012; Carilli & Walter 2013; Valentino et al. 2018; Vishwas et al. 2018; Riechers et al. 2019; Rybak et al. 2020; Harikane et al. 2020; Pensabene et al. 2021; Decarli et al. 2012, 2014, 2022; Yang et al. 2023). A combination of these emission line diagnostics and their luminosity ratios can shed light on the various phases of the ISM and its properties, for example, opacity, electron density, star formation rates (SFRs), gas mass, metallicity, radiation field intensity, ionization strength, and excitation mechanisms (De Looze et al. 2014; Herrera-Camus et al. 2015; Madden et al. 2020; Lamarche et al. 2022; Vizgan et al. 2022; Decarli et al. 2012, 2023).
While the [CII] 158 μm is the dominant and best-studied cooling line of the ISM (Carilli & Walter 2015; Neeleman et al. 2017, 2019; Decarli et al. 2018; Lagache et al. 2018; Béthermin et al. 2020; Khusanova et al. 2022), another vital fine structure line that studies have been increasingly focusing on is the [NII] 205 μm emission line (Walter et al. 2009; Decarli et al. 2012, 2014; Pavesi et al. 2016; Zhao et al. 2013, 2016). Arising from the 3P1 → 3p0 forbidden transition, this line is of particular interest for the following reasons: 1) With an ionization potential of 14.53 eV, it traces the bulk of the warm ionized medium. 2) In combination with other fine structure lines, for example, the [CII] 158 μm and the [NII] 122 μm lines, it enables constraints on key physical properties, such as the fraction of the [CII] 158 μm arising from the ionized medium, metal enrichment, and electron density (e.g., Cunningham et al. 2020; Doherty et al. 2020; Tadaki et al. 2022). 3) It can be used as an indicator for SFRs, as both computation models (Orsi et al. 2014) and observations (Farrah et al. 2013; Zhao et al. 2013, 2016) have shown a linear correlation between the [NII] 205 μm line luminosity and SFR in local star-forming and ultra luminous infrared galaxies (ULIRGs) and a good correlation with the SFR surface density (Herrera-Camus et al. 2016). While these studies show a good correlation between star formation and the [NII] 205 μm luminosity, the scatter is, however, plagued by issues such as the [NII] 205 fine structure line deficit. The choice of SFR-[NII] scaling relation depends on prior knowledge of different factors, for instance, the far-infrared (FIR) color (Zhao et al. 2016), or physical parameters such as electron density, nitrogen abundance, and ionization parameter (Herrera-Camus et al. 2016). A suitable sample has been produced for statistical analysis on local galaxies thanks to the advent of the Herschel Space Observatory (e.g., Zhao et al. 2016), but only a few sources have been detected at high redshifts. However, with the unparalleled sensitivities reached by the Institut de RadioAstronomie Millimétrique (IRAM) NOrthern Extended Millimetre Array (NOEMA) and the Atacama Large Millimeter/submillimeter Array (ALMA), the number of galaxies detected in [NII] 205 μm has been increasing over the years (e.g., Béthermin et al. 2016; Lu et al. 2018; Doherty et al. 2020; Schreiber et al. 2021; Meyer et al. 2022).
In this paper, we present [NII] 205 μm fine structure line observations of three submillimeter galaxies (SMGs; GN20, ID141, HDF850.1) and three quasar host galaxies (QSOs1; PSSJ2322+1944, SDSS J2054-0005, SDSS J2310+1855) at 4 ≲ z ≲ 6 that were carried out over a decade using the IRAM interferometer (both the Plateau de Bure Interferometer (PdBI) and, later, NOEMA). The paper is structured as follows: In Sect. 2, we introduce the selected sources and summarize the observations and the data reduction. In Sect. 3, we present and discuss the results, focusing on the [NII]-to-IR and [CII]-to-[NII] ratios. Finally, in Sect. 4, we outline the main conclusions of this study. Throughout this paper, we assume a concordance cosmology with H0 = 70 km s−1 Mpc−1, ΩM = 0.3, and ΩΛ = 1-ΩM = 0.7.
2. Sample, observations, and data reduction
2.1. The sample
The selected sources for this study consist of three SMGs and three QSOs at 4 ≲ z ≲ 6 that were observed using the IRAM interferometer. We give a brief description of our sources below.
GN20 is one of the brightest and most well-studied SMGs identified in the Great Observatories Origins Deep Survey (GOODS) Northern field (Pope et al. 2006) at the redshift z = 4.055. It lies in a massive proto-cluster environment with, most notably, two companion galaxies, GN20.2a and GN20.2b, and a Lyman break galaxy, dubbed BD29079, which are all separated within a radius of 25″ (corresponding to a projected separation of ∼180 kpc at z = 4.05) centered at GN20 (Daddi et al. 2009). CO(2-1) maps reveal a clumpy, extended gas disk with a diameter of 14 ± 4 kpc (Hodge et al. 2012). GN20 has a high infrared luminosity and displays signatures of an extreme starburst with a large specific SFR (sSFR) excess (∼6×) compared to typical galaxies at the same epoch (Tan et al. 2014; Colina et al. 2023). The source, however, has not been observed for the [CII] 158 μm emission line2.
ID141 is a highly luminous lensed source observed in the Herschel Astrophysical Terahertz Large Area Survey (H-ATLAS) project (Eales et al. 2010). It has an extreme intrinsic brightness and a high intrinsic SFR of ∼2000 M⊙ yr−1. Being one of the brightest SMGs in the sky, it has been subjected to numerous submillimeter scans (Cox et al. 2011; Dye et al. 2022 and references therein). Additionally, high spatial resolution ALMA observations of this source mapping CO(7-6) and H2O(21, 1–20, 2) emission lines have revealed kinematics consistent with a rotating disk system and display evidence of a nearby perturbed component, suggesting the source is either a rotating disk galaxy with a prominent outer ring or a merging system with two or more close components (Dye et al. 2022).
HDF850.1 is the brightest SMG in the confusion-limited James Clerk Maxwell Telescope (JCMT)/Submillimetre Common-User Bolometer Array (SCUBA) survey of the northern Hubble Deep Field (Hughes et al. 1998). Its redshift, z = 5.183, was measured from the CO(5-4) and (6-5) transitions and confirmed by the detection of the [CII] 158 μm emission line, all of which were observed using PdBI (Walter et al. 2012). Inspection of the redshift distribution of galaxies around HDF850.1 revealed that HDF850.1 lies in an overdense environment (Walter et al. 2012), and higher resolution [CII] 158 μm observations revealed a galaxy merger at play (Neri et al. 2014). Furthermore, recent JWST NIRCam observations have detected an Hα emission line at a very high significance (Herard-Demanche et al. 2023) and resolved the UV–optical counterpart (Sun et al. 2024) from this highly obscured source.
PSSJ2322+1944 is a strongly lensed hyperluminous quasar at z = 4.12 that appears as an Einstein ring in CO(2-1) maps (Carilli et al. 2003). Identified in a spectroscopic follow-up of the Palomar Sky Survey (Djorgovski et al. 2000), it is one of the brightest known sources at z ∼ 4 both in CO and infrared luminosity and has been detected in multiple CO transitions (Cox et al. 2002; Carilli et al. 2002). However, only upper limits were reached on the [CII] 158 μm line (Pety et al. 2004).
J2054-0005 and J2310+1855 are z ∼ 6 quasars first discovered from the Sloan Digital Sky Survey (SDSS; Jiang et al. 2009, 2016). With a black hole mass of 0.9 × 10⁹ M⊙ (2.3 × 10⁹ M⊙) and absolute magnitude M1450 of −26.1 (−27.8) for J2054-0005 (J2310+1855), they are some of the most extensively studied quasars at cosmic dawn and were detected in multiple submillimeter transitions, including [CII] 158 μm, [CI] 369 μm, [OIII] 88 μm, OH 119, 163 μm, and multiple CO and H2O lines (Wang et al. 2013; Decarli et al. 2018; Hashimoto et al. 2019; Li et al. 2020; Pensabene et al. 2021; Tripodi et al. 2022).
2.2. Observations and data reduction
The observations were performed during the winter semesters of 2011, 2012, and 2016 using the IRAM interferometer with six (and seven) antennas in the compact C or D configurations. The quasars J2054-0005 and J2310+1855 were observed as part of the project W16EF (PIs: Ferkinhoff & Decarli) with NOEMA, while the remaining four sources, included in the projects V0B2 and W0B7, were observed with PdBI (PI: Decarli). The WideX Band 3 and 4 receivers were used for all the observations, covering the 1 and 0.8 mm atmospheric windows to detect the redshifted [NII] 205 μm emission line and the underlying dust continuum emission. All data were processed with the clic software within the GILDAS suite and imaged with the mapping package.
The QSO PSSJ2322+1944 was observed on 2011 December 26 and 28, 2012 December 12, and 2013 May 14, 26, and 27. The blazar 3C454.3 was used for phase and amplitude calibration, while the radio star MWC349 was used for absolute flux calibration. The first track was observed under unfavorable weather conditions: precipitable water vapor (pwv) of 2–4 mm, and a system temperature, Tsys, of 350–450 K. The second and third tracks were secured under much better weather (pwv = 0.7–2.0 mm, Tsys = 160–250 K). We reached 5.17 h of integration on-source time.
The SMG HDF850.1 was observed on 2012 January 10 and 11. The radio-loud source 1150+497 was observed as a phase and amplitude calibrator, while 3C279 and MWC349 were observed for pointing and flux calibration. The weather conditions were good (pwv = 1–2, Tsys = 150–250 K on January 10; pwv = 2–3 mm, Tsys = 160–230 K). We reached an integration time of 2.45 h on source.
The SMG GN20 was observed on 2012 January 15 using 1044+719 and 1300+580 as phase and amplitude calibrators, and 3C345 and 2200+420 as flux and pointing calibrators. The weather conditions were good (pwv = 1.0–1.8 mm, Tsys = 200–250 K). These observations resulted in an on-source time of 2.62 h.
The SMG ID141 was observed on 2012 January 16. The calibrators 1502+106 and 1402+044 served as phase and amplitude reference, and various sources, including MWC349, 1502+036, and 1055+018, were used to set the flux scale. The weather conditions were nominal (pwv = 1.5–2.0 mm, Tsys = 180–250 K). The integration time reached on the source is 2.23 h.
The two z ∼ 6 QSOs J2054-0005 and J2310+1855 were observed on 2016 December 1 and 3 and 2016 November 17, 19, and 26, respectively, when the array had seven antennas. The blazar 3C454.3 served as a bandpass, amplitude, and phase calibrator for both sources, while MWC349 was used for the absolute flux calibration. The system temperature was Tsys = 150–250 K throughout the observations. The on-source time for J2054-0005 and J2310+1855 was 3.34 and 3.45 hours (equivalent six-antenna integration time), respectively.
The cubes were generated using 30 MHz channels, resulting in velocity channels with widths varying with frequency. The corresponding integration time, spatial resolution (obtained using natural visibility weights), and the observational sensitivities achieved for each source are mentioned in Table 2.
3. Results and discussion
In the following section, we present the results of the [NII] 205 μm observations and estimate two key ratios for our sample, namely, the [NII]-to-IR and [CII]-to-[NII] ratios. We summarize the [NII] 205 μm emission line properties obtained for each source in Sect. 3.1. In Sects. 3.2 and 3.3, we estimate the [NII]-to-IR as well as the [CII]-to-[NII] line ratio for our sources, respectively, and place them into context with other sources detected in the [NII] 205 μm emission both at low and high redshifts.
3.1. [NII] 205 μm line emission
Most of the sources are spatially unresolved in our observations, with the exception of ID141, but their continuum was detected with high significance. Figure 1 shows the spectra extracted from an aperture enclosing the 1σ region in the [NII] 205 μm integrated line maps. For non-detections, the 1σ region is taken from the continuum maps. We simultaneously fitted the emission lines with a Gaussian profile and the underlying continuum and converted the integrated fluxes into line luminosity using the following equation:
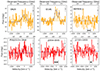 |
Fig. 1. Observed [NII] 205 μm spectra of the sources in our sample. The orange histogram represents the 1D spectra of submillimeter galaxies, while the red histogram represents the spectra of quasar hosts. The best Gaussian plus continuum fit is shown in solid blue. The dashed blue line represents the mean dust continuum flux for sources undetected in the [NII] 205 μm emission. The gray bar represents the mean error (RMS) of the spectrum, while the black bar represents the width of the [CII] 158 μm line used to estimate the upper limit on the integrated line flux for the non-detections (see Sect. 3.1). The zero velocity is with respect to the reference redshift in Table 1. |
![Mathematical equation: $$ \begin{aligned} L_{\rm [NII]} = 1.04 \times 10^{-3} \times F_{\rm line} D_L^2 \nu _{\rm obs} \mathrm{L} _{\odot }, \end{aligned} $$](/articles/aa/full_html/2025/03/aa52374-24/aa52374-24-eq1.gif) (1)
(1)
where Fline is the integrated flux of the line in Jy km s−1, DL is the luminosity distance in megaparsec, and νobs is the observed frequency of the line in gigahertz (see, e.g., Carilli & Walter 2013). The luminosities and derived fit parameters are listed in Table 3.
Sample of this study.
Observation parameters.
[NII] 205 μm line properties and luminosity ratios.
GN20. The [NII] 205 μm emission line is clearly detected in this SMG, displaying a single Gaussian line with a line flux of Fline = 2.3 ± 0.7 km s−1 and a large line width of 710 ± 170 km s−1. We detected the underlying continuum with a flux density of 16.2 ± 2.5 mJy. The line width is comparable to the width measured from CO emission lines (Carilli et al. 2010, 2011; Hodge et al. 2012).
ID141. The [NII] 205 μm emission line is also well detected for ID141, displaying a clear double peak profile. We, therefore, fit the spectrum with a double Gaussian to obtain the line parameters. We estimated an integrated flux of 7.6 ± 0.8 Jy km s−1 – full width half maximum (FWHM) = 470 ± 60 km s−1 – and 1.8 ± 0.4 Jy km s−1 – FWHM = 160 ± 40 km s−1 – from the fit and a continuum flux density of 57.0 ± 0.8 mJy. Our measurement of the total integrated flux, Fline = 9.4 ± 2.0 Jy km s−1, is consistent with the value derived by Cheng et al. (2020; Fline = 7.9 ± 1.9 Jy km s−1) observed using ALMA, while the FWHM of the total [NII] line emission is consistent, within the uncertainties, with the FWHM measurements from Cheng et al. (2020) as well as [CII] 158 μm and CO lines from Cox et al. (2011).
PSSJ2322+1944. The [NII] 205 μm emission line is well detected, displaying a single Gaussian line with an integrated line flux of Fline = 1.7 ± 0.7 Jy km s−1 and an FWHM of 330 ± 110 km s−1, which aligns well with the widths observed in CO emission lines (Cox et al. 2002). The underlying continuum is detected with a flux density of 17.4 ± 2.6 mJy.
Non-detections. The [NII] 205 μm emission is undetected for HDF850.1, J2054-0005, and J2310+1855 from our observations. To provide an upper limit to the integrated line flux of the sources with undetected [NII] 205 μm emission, we integrated the spectrum within the FWHM of the [CII] 158 μm line for the same redshift. The continuum flux density, upper limits on the integrated flux, and the corresponding [NII] 205 μm luminosities are mentioned in Table 3.
3.2. Line deficit
In Fig. 2, we compare the [NII] and IR luminosities of our sources. We computed the infrared luminosities by integrating the dust emission model across the 8–1000 μm wavelength range. Appendix B contains more details on the modeling of the dust spectral energy distribution (SED). In the figure, we plot the [NII]-to-IR values against the IR luminosity for our sources and compare them with other SMGs and QSOs detected in the [NII] 205 μm at 3 < z < 6 (Decarli et al. 2014; Béthermin et al. 2016; Pavesi et al. 2016; Lu et al. 2017b, 2018; Tadaki et al. 2019; Doherty et al. 2020; Schreiber et al. 2021) as well as with galaxies in the local Universe (Malhotra et al. 2001; Díaz-Santos et al. 2017; Lu et al. 2017a). We also include a set of normal galaxies between z = 5–6 taken from Pavesi et al. (2018, 2019). We converted the [NII] 122 μm values from Malhotra et al. (2001) and Díaz-Santos et al. (2017) into [NII] 205 luminosities using a L[NII]122/L[NII]205 ratio of approximately five (see, e.g., Beirão et al. 2010; Decarli et al. 2012).
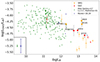 |
Fig. 2. [NII]-to-IR ratio as a function of IR luminosity for the sources in our sample. Our sample is illustrated as stars, following the same color scheme in Fig. 1. We also compile sources from the local Universe (green triangles) as well as at high redshifts (orange and red squares and blue triangles) that have been detected in [NII] 205 μm emission. The green and blue bars represent the mean error bars for their respective data points. All luminosities have been corrected for gravitational magnification. Our new measurements further populate the sparser high end of the infrared luminosity regime of such sources. |
We observed a decrease in the [NII]-to-IR ratio by an order of magnitude, both in local galaxies and high-z sources, when moving towards the brighter end of the dust continuum luminosity. This trend has been referred to as the [NII] fine structure line deficit (Graciá-Carpio et al. 2011; Farrah et al. 2013; Díaz-Santos et al. 2017; Zhao et al. 2013, 2016). While the exact causes of the deficit are still under debate, we explored a few possible physical mechanisms responsible for the observed trend, and they are outlined in the following.
1) High ionization parameter: Using the radiative transfer code CLOUDY (Ferland et al. 1998) and an isobaric planar slab geometry, Abel et al. (2009) showed that a higher ionization parameter (ionizing radiation to particle density ratio) leads to a larger fraction of ionizing photons absorbed by dust within the HII region and thereby to less heating and line cooling (We recommend the reader refer to Section 1. in Abel et al. 2009 for a physical explanation of this phenomenon). A larger ionization parameter could therefore explain the smaller line-to-continuum flux ratio observed in local ULIRGs compared to less luminous IR-bright galaxies. Similarly, Graciá-Carpio et al. (2011) observed a drop in the [CII] 158 μm as well as other fine structure lines to FIR continuum ratios (see Fig. 2 of Graciá-Carpio et al. 2011) by a factor of ten for galaxies with a high LFIR/MH2 ratio in a sample of 44 sources ranging from local starbursts, Seyfert galaxies, and IR luminous galaxies both at low and intermediate redshifts in the Herschel-PACS SHINING survey3. This drop seems to be a universal feature of galaxies irrespective of their redshift and optical activity. To explain this deficit, Graciá-Carpio et al. extended Abel’s analysis to include the other fine structure lines observed in the PACS survey. From the model, they were able to reproduce the deficit in the [CII] 158 μm, [NII] 122 μm, and [OI] 63, 145 μm lines for galaxies with LFIR/MH2 > 80 L⊙/M⊙. Since to first order, the ionization parameter is proportional to LFIR/MH2, by increasing the ionization parameter by at least an order of magnitude from the typical value (U ∼ 10−3), which explains the average line to FIR ratios measured in galaxies with low LFIR/MH2, the model was able to reproduce the deficits consistent with the observed trend. With LFIR/MH2 ratios > 80 L⊙/M⊙ for our sources (see Table 1), a higher ionization parameter could be one of the main contributors to the observed deficit.
2) Thermalization: The [CII] deficit has been found to be stronger in the ionized medium than in the neutral medium (Sutter et al. 2019). Sutter et al. (2021) observed that in the ionized ISM, the [CII]/IR ratio plummets when the electron number density is close to the [CII] critical density, indicating that thermalization could be a contributing factor to the line deficit. This scenario may also be extended to the [NII] 205 μm deficit since it arises solely in the ionized phase of the ISM. While thermalization is very likely to contribute in high density environments since the critical density of [NII] 205 μm is ∼50 cm−3, the exact extent to which it plays a role in the observed [NII] 205 μm line deficit can only be explored once a significant sample of high-z galaxies has been observed in the [NII] 205 μm emission line and constraints on the electron number density4 of the ISM become available.
3) Dusty HII regions: Another possible explanation is a higher abundance of dust in HII regions found in IR-bright galaxies (Farrah et al. 2013; Díaz-Santos et al. 2017; Herrera-Camus et al. 2018). In this case, a higher fraction of UV photons produced by young massive stars is absorbed by dust, which increases the IR emission and thus suppresses the fraction of ionizing photons that photoionize hydrogen in the HII regions, thereby decreasing the line emission relative to the IR luminosity.
While a combination of the aforementioned physical mechanisms may be responsible for the observed deficit, it should be noted that such a line deficit is expected, as explained in Walter et al. (2022), since the infrared luminosity scales proportional to the dust temperature with a power law exceeding the Stefan–Boltzmann law (Ldust ∼ T4.6). In contrast, the line emission typically scales linearly (Lline ∼ T), and no known excitation mechanism could allow the line flux to keep up with the strong temperature dependence of the dust luminosity. Furthermore, when we split the sources in our sample and those detected between z = 3–6 into QSOs and SMGs, we find that the observed [NII]-to-IR ratios are indistinguishable, suggesting that the AGN has little impact on the [NII] 205 μm emission in these sources.
3.3. The [CII]-to-[NII] ratio
The [CII]-to-[NII] ratio is a powerful diagnostic that provides information on the metal enrichment of the ISM and probes the abundance of the C+ in the ionized medium. Studies have used the [CII]-to-[NII] line ratio to investigate the different properties of the ISM in high-z sources, ranging from Lyα emitters (LAEs) to SMGs and QSOs (Decarli et al. 2014; Lu et al. 2017b; Cunningham et al. 2020; Pensabene et al. 2021). The estimates on this line ratio expose the diversity in global properties and conditions of the ISM in various galaxies. In Fig. 3, we plot the [CII]-to-[NII] ratio as a function of IR luminosity for our sources together with SMGs and QSOs at 3 < z < 6 that have been detected both in [CII] 158 μm and [NII] 205 μm (Wagg et al. 2010; Pavesi et al. 2016; Béthermin et al. 2016; Lu et al. 2017b; Schreiber et al. 2018; Tadaki et al. 2019) and local galaxies. Due to the lack of information on the [CII] 158 μm emission for GN20, we excluded it from the analysis. We find that for all of our sources, the [CII]/[NII] value is greater than ten, corresponding to the X-ray dominated– (XDRs), photon-dominated regions (PDRs), and shock models determined by Decarli et al. (2014) and consistent with the measurements of IR–bright sources (Decarli et al. 2014; Pavesi et al. 2016; Cunningham et al. 2020). For comparison, a [CII]/[NII] value of approximately two to four is expected in HII regions (Decarli et al. 2014). The observed values imply that the neutral medium is the dominant source of the [CII] emission for the sources mentioned here. We therefore estimated the fraction of the [CII] 158 μm emission arising from the PDRs by assuming [CII] /[NII]205 μm approximately three, a value that is typically observed in HII regions:
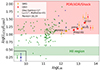 |
Fig. 3. [CII]-to-[NII] ratio as a function of IR luminosity for the sources in our sample as well as for galaxies taken from the literature that are detected in both [CII] 158 μm and [NII] 205 μm, assuming the commonly adopted [CII] |

![Mathematical equation: $$ \begin{aligned} f{([\mathrm{CII} ]^\mathrm{PDR})} \approx 1{-}3 \frac{[\mathrm{NII} ]_{205\, \upmu \mathrm m}}{[\mathrm{CII} ]_{158\, \upmu \mathrm m}} \end{aligned} $$](/articles/aa/full_html/2025/03/aa52374-24/aa52374-24-eq5.gif) (2)
(2)
We found that the [CII]PDR fraction ranges from 76% to more than 87% for our sample. However, more recent estimates give a higher [CII] /[NII]205 μm ratio of approximately nine (Decarli et al. 2023). Adopting this value, the estimated [CII]PDR fractions lower to 27%–62% for our sources. The estimated fractions for each source is mentioned in Table 3. Similar to the [NII]-to-IR ratios, we find no notable difference in the [CII]/[NII] values between the two galaxy populations, further strengthening the argument that the AGN has a negligible influence on the [NII] 205 μm emission line.
4. Conclusions
In this study, we have presented [NII] 205 μm fine structure line observations in three submillimeter galaxies and three quasar host galaxies at 4 ≲ z ≲ 6. Three out of the six sources (GN20, ID141, PSSJ2322+1944) are detected in the [NII] 205 μm emission. While all of our sources are detected in the underlying continuum, for the non-detections in the [NII] 205 μm emission line, we have placed upper limits on the integrated line flux and, hence, the line luminosity. The [NII]/IR ratios are consistent with other high-z sources and follow the trend of the so-called [NII] 205 μm line deficit, that is, the decrease of the line-to-continuum ratio with increasing dust continuum luminosity. While the line deficit is expected to be observed for warmer sources due to the strong dependence of the dust temperature on the infrared luminosity compared to the line luminosity, other mechanisms such as high ionization parameter, thermalization, and dusty HII regions could also be responsible for the apparent drop in the [NII]/IR ratio. We also find that the [CII]-to-[NII] ratio for our sources lies in the XDR, PDR, and shock regions, which is consistent with values of other IR-bright sources, indicating that the neutral medium is the dominant source of the [CII] 158 μm emission for such galaxies. Finally, we find no significant differences in the [NII]-to-IR and the [CII]-to-[NII] ratio estimates between SMGs and QSOs, suggesting that there is a negligible contribution to the boosting of [NII] 205 μm emission due to AGN photoionization.
Studies of the [NII] 205 μm emission have shown it to be a powerful diagnostic for studying the ionized medium of high-redshift galaxies. Future works involving the [NII] 122 μm, [OIII] 88 μm fine structure lines and optical diagnostics as observed with JWST will provide further insight into a suite of properties of the ionized medium and also reveal the diverse properties between AGN and non-AGN environments.
Note: The abbreviation ‘QSOs’ generally refers to quasars and does not accord with ‘quasar host galaxy.’ However, we adopt this term to refer to quasar host galaxies for brevity since our discussion will focus solely on galactic scales throughout the paper.
The [CII] emission line for GN20 corresponds to an observed frequency (νobs) of ∼377 GHz. This frequency coincides with a significant atmospheric feature centered around 380 GHz, which precludes coverage by the IRAM receiver. Additionally, the source’s declination of +62° places it outside the observable range of ALMA.
The Survey with Herschel of the ISM in Nearby INfrared Galaxies (SHINING) survey was a comprehensive FIR spectroscopic and photometric survey of bright IR galaxies and AGNs at local and intermediate redshifts conducted using the Herschel Photodetector Array Camera and Spectrometer (PACS) and the Spectral and Photometric Imaging Receiver (SPIRE) instruments.
The electron density of high-z galaxies can be estimated using optical tracers such as [OII] (3729Å/3727Å) and [SII] (6718Å/6732Å) or with the [NII] 122 μm line in combination with the [NII] 205 μm emission line.
Acknowledgments
We are grateful to the anonymous A&A referee for their constructive feedback on the manuscript. This work is based on observations carried out under project numbers V0B2 and W0B7, observed with the IRAM Plateau de Bure interferometer, and W16EF, observed with the Northern Extended Millimeter Array. IRAM is supported by INSU/CNRS (France), MPG (Germany), and IGN (Spain). RD acknowledges support from the INAF GO 2022 grant “The birth of the giants: JWST sheds light on the build-up of quasars at cosmic dawn” and from the Italian PRIN 2022 2022935STW – “Black hole formation mechanisms and their impact on high-redshift quasar host properties.” This research made use of Astropy (http://www.astropy.org), a community-developed core Python package for Astronomy (Astropy Collaboration 2013, 2018), lmfit (https://lmfit.github.io//lmfit-py/), a python library that provides tools for non-linear least-squares minimization and curve fitting, emcee (Foreman-Mackey et al. 2013), interferopy (Boogaard et al. 2021), and Matplotlib (Hunter 2007).
References
- Abel, N. P., Dudley, C., Fischer, J., et al. 2009, ApJ, 701, 1147 [Google Scholar]
- Astropy Collaboration (Robitaille, T. P., et al.) 2013, A&A, 558, A33 [NASA ADS] [CrossRef] [EDP Sciences] [Google Scholar]
- Astropy Collaboration (Price-Whelan, A. M., et al.) 2018, AJ, 156, 123 [Google Scholar]
- Álvarez-Márquez, J., Colina, L., Crespo Gómez, A., et al. 2024, A&A, 686, A85 [NASA ADS] [CrossRef] [EDP Sciences] [Google Scholar]
- Baldwin, J. A., Phillips, M. M., & Terlevich, R. 1981, PASP, 93, 5 [Google Scholar]
- Beelen, A., Cox, P., Benford, D. J., et al. 2006, ApJ, 642, 694 [NASA ADS] [CrossRef] [Google Scholar]
- Beirão, P., Armus, L., Appleton, P. N., et al. 2010, A&A, 518, L60 [NASA ADS] [CrossRef] [EDP Sciences] [Google Scholar]
- Bertoldi, F., Cox, P., Neri, R., et al. 2003, A&A, 409, L47 [NASA ADS] [CrossRef] [EDP Sciences] [Google Scholar]
- Béthermin, M., De Breuck, C., Gullberg, B., et al. 2016, A&A, 586, L7 [NASA ADS] [CrossRef] [EDP Sciences] [Google Scholar]
- Béthermin, M., Fudamoto, Y., Ginolfi, M., et al. 2020, A&A, 643, A2 [Google Scholar]
- Boogaard, L., Meyer, R. A., & Novak, M., 2021, Astrophysics Source Code Library [record ascl:2112.005] [Google Scholar]
- Butler, K. M., van der Werf, P. P., Topkaras, T., et al. 2023, ApJ, 944, 134 [NASA ADS] [CrossRef] [Google Scholar]
- Cameron, A. J., Saxena, A., Bunker, A. J., et al. 2023, A&A, 677, A115 [NASA ADS] [CrossRef] [EDP Sciences] [Google Scholar]
- Carilli, C. L., & Walter, F. 2013, ARA&A, 51, 105 [NASA ADS] [CrossRef] [Google Scholar]
- Carilli, C., & Walter, F. 2015, IAUGA, 29, 2247830 [NASA ADS] [Google Scholar]
- Carilli, C. L., Bertoldi, F., Omont, A., et al. 2001, AJ, 122, 1679 [Google Scholar]
- Carilli, C. L., Cox, P., Bertoldi, F., et al. 2002, ApJ, 575, 145 [Google Scholar]
- Carilli, C. L., Lewis, G. F., Djorgovski, S. G., et al. 2003, Science, 300, 773 [Google Scholar]
- Carilli, C. L., Daddi, E., Riechers, D., et al. 2010, ApJ, 714, 1407 [NASA ADS] [CrossRef] [Google Scholar]
- Carilli, C. L., Hodge, J., Walter, F., et al. 2011, ApJ, 739, L33 [NASA ADS] [CrossRef] [Google Scholar]
- Chapin, E. L., Pope, A., Scott, D., et al. 2009, MNRAS, 398, 1793 [NASA ADS] [CrossRef] [Google Scholar]
- Cheng, C., Cao, X., Lu, N., et al. 2020, ApJ, 898, 33 [NASA ADS] [CrossRef] [Google Scholar]
- Colina, L., Crespo Gómez, A., Álvarez-Márquez, J., et al. 2023, A&A, 673, L6 [NASA ADS] [CrossRef] [EDP Sciences] [Google Scholar]
- Cortzen, I., Magdis, G. E., Valentino, F., et al. 2020, A&A, 634, L14 [EDP Sciences] [Google Scholar]
- Cowie, L. L., Barger, A. J., Hsu, L.-Y., et al. 2017, ApJ, 837, 139 [Google Scholar]
- Cox, P., Omont, A., Djorgovski, S. G., et al. 2002, A&A, 387, 406 [NASA ADS] [CrossRef] [EDP Sciences] [Google Scholar]
- Cox, P., Krips, M., Neri, R., et al. 2011, ApJ, 740, 63 [NASA ADS] [CrossRef] [Google Scholar]
- Cunningham, D. J. M., Chapman, S. C., Aravena, M., et al. 2020, MNRAS, 494, 4090 [NASA ADS] [CrossRef] [Google Scholar]
- Daddi, E., Dannerbauer, H., Stern, D., et al. 2009, ApJ, 694, 1517 [Google Scholar]
- Dannerbauer, H., Daddi, E., Riechers, D. A., et al. 2009, ApJ, 698, L178 [NASA ADS] [CrossRef] [Google Scholar]
- Decarli, R., Walter, F., Neri, R., et al. 2012, ApJ, 752, 2 [NASA ADS] [CrossRef] [Google Scholar]
- Decarli, R., Walter, F., Carilli, C., et al. 2014, ApJ, 782, L17 [NASA ADS] [CrossRef] [Google Scholar]
- Decarli, R., Walter, F., Venemans, B. P., et al. 2018, ApJ, 854, 97 [Google Scholar]
- Decarli, R., Pensabene, A., Venemans, B., et al. 2022, A&A, 662, A60 [NASA ADS] [CrossRef] [EDP Sciences] [Google Scholar]
- Decarli, R., Pensabene, A., Diaz-Santos, T., et al. 2023, A&A, 673, A157 [NASA ADS] [CrossRef] [EDP Sciences] [Google Scholar]
- De Looze, I., Cormier, D., Lebouteiller, V., et al. 2014, A&A, 568, A62 [NASA ADS] [CrossRef] [EDP Sciences] [Google Scholar]
- Díaz-Santos, T., Armus, L., Charmandaris, V., et al. 2017, ApJ, 846, 32 [Google Scholar]
- Djorgovski, S. G., Gal, R. R., Mahabal, A., et al. 2000, AAS, 197, 116.07 [NASA ADS] [Google Scholar]
- Doherty, M. J., Geach, J. E., Ivison, R. J., et al. 2020, ApJ, 905, 152 [NASA ADS] [CrossRef] [Google Scholar]
- Downes, D., Neri, R., Greve, A., et al. 1999, A&A, 347, 809 [NASA ADS] [Google Scholar]
- Dye, S., Eales, S. A., Gomez, H. L., et al. 2022, MNRAS, 510, 3734 [NASA ADS] [CrossRef] [Google Scholar]
- Eales, S., Dunne, L., Clements, D., et al. 2010, PASP, 122, 499 [NASA ADS] [CrossRef] [Google Scholar]
- Farrah, D., Lebouteiller, V., Spoon, H. W. W., et al. 2013, ApJ, 776, 38 [Google Scholar]
- Ferland, G. J., Korista, K. T., Verner, D. A., et al. 1998, PASP, 110, 761 [Google Scholar]
- Foreman-Mackey, D., Hogg, D. W., Lang, D., et al. 2013, PASP, 125, 306 [NASA ADS] [CrossRef] [Google Scholar]
- Graciá-Carpio, J., Sturm, E., Hailey-Dunsheath, S., et al. 2011, ApJ, 728, L7 [Google Scholar]
- Harikane, Y., Ouchi, M., Inoue, A. K., et al. 2020, ApJ, 896, 93 [Google Scholar]
- Hashimoto, T., Inoue, A. K., Tamura, Y., et al. 2019, PASJ, 71, 109 [NASA ADS] [CrossRef] [Google Scholar]
- Herard-Demanche, T., Bouwens, R. J., Oesch, P. A., et al. 2023, MNRAS, submitted [arXiv:2309.04525] [Google Scholar]
- Herrera-Camus, R., Bolatto, A. D., Wolfire, M. G., et al. 2015, ApJ, 800, 1 [Google Scholar]
- Herrera-Camus, R., Bolatto, A., Smith, J. D., et al. 2016, ApJ, 826, 175 [Google Scholar]
- Herrera-Camus, R., Sturm, E., Graciá-Carpio, J., et al. 2018, ApJ, 861, 95 [Google Scholar]
- Hodge, J. A., Carilli, C. L., Walter, F., et al. 2012, ApJ, 760, 11 [Google Scholar]
- Hodge, J. A., Riechers, D., Decarli, R., et al. 2015, ApJ, 798, L18 [Google Scholar]
- Hsiao, T. Y.-Y., Álvarez-Márquez, J., Coe, D., et al. 2024, ApJ, 973, 81 [NASA ADS] [CrossRef] [Google Scholar]
- Hughes, D. H., Serjeant, S., Dunlop, J., et al. 1998, Nature, 394, 241 [Google Scholar]
- Hunter, J. D. 2007, CSE, 9, 90 [Google Scholar]
- Ishii, N., Hashimoto, T., Ferkinhoff, C., et al. 2025, PASJ, 77, 139 [NASA ADS] [CrossRef] [Google Scholar]
- Izotov, Y. I., Stasińska, G., Meynet, G., et al. 2006, A&A, 448, 955 [CrossRef] [EDP Sciences] [Google Scholar]
- Jiang, L., Fan, X., Bian, F., et al. 2009, AJ, 138, 305 [NASA ADS] [CrossRef] [Google Scholar]
- Jiang, L., McGreer, I. D., Fan, X., et al. 2016, ApJ, 833, 222 [Google Scholar]
- Katz, H., Saxena, A., Cameron, A. J., et al. 2023, MNRAS, 518, 592 [Google Scholar]
- Keenan, F. P., Aller, L. H., Bell, K. L., et al. 1996, MNRAS, 281, 1073 [NASA ADS] [Google Scholar]
- Khusanova, Y., Bañados, E., Mazzucchelli, C., et al. 2022, A&A, 664, A39 [NASA ADS] [CrossRef] [EDP Sciences] [Google Scholar]
- Lagache, G., Cousin, M., & Chatzikos, M. 2018, A&A, 609, A130 [NASA ADS] [CrossRef] [EDP Sciences] [Google Scholar]
- Lamarche, C., Smith, J. D., Kreckel, K., et al. 2022, AAS, 54, 105.08 [NASA ADS] [Google Scholar]
- Li, J., Wang, R., Cox, P., et al. 2020, ApJ, 900, 131 [NASA ADS] [CrossRef] [Google Scholar]
- Lu, N., Zhao, Y., Díaz-Santos, T., et al. 2017a, ApJS, 230, 1 [Google Scholar]
- Lu, N., Zhao, Y., Díaz-Santos, T., et al. 2017b, ApJ, 842, L16 [NASA ADS] [CrossRef] [Google Scholar]
- Lu, N., Cao, T., Díaz-Santos, T., et al. 2018, ApJ, 864, 38 [NASA ADS] [CrossRef] [Google Scholar]
- Madden, S. C., Cormier, D., Hony, S., et al. 2020, A&A, 643, A141 [NASA ADS] [CrossRef] [EDP Sciences] [Google Scholar]
- Magdis, G. E., Daddi, E., Elbaz, D., et al. 2011, ApJ, 740, L15 [NASA ADS] [CrossRef] [Google Scholar]
- Malhotra, S., Kaufman, M. J., Hollenbach, D., et al. 2001, ApJ, 561, 766 [Google Scholar]
- Meyer, R. A., Walter, F., Cicone, C., et al. 2022, ApJ, 927, 152 [NASA ADS] [CrossRef] [Google Scholar]
- Neeleman, M., Kanekar, N., Prochaska, J. X., et al. 2017, Science, 355, 1285 [NASA ADS] [CrossRef] [Google Scholar]
- Neeleman, M., Kanekar, N., Prochaska, J. X., et al. 2019, ApJ, 870, L19 [NASA ADS] [CrossRef] [Google Scholar]
- Neri, R., Downes, D., Cox, P., et al. 2014, A&A, 562, A35 [NASA ADS] [CrossRef] [EDP Sciences] [Google Scholar]
- Novak, M., Bañados, E., Decarli, R., et al. 2019, ApJ, 881, 63 [NASA ADS] [CrossRef] [Google Scholar]
- Oberst, T. E., Parshley, S. C., Stacey, G. J., et al. 2006, ApJ, 652, L125 [Google Scholar]
- Omont, A., Cox, P., Bertoldi, F., et al. 2001, A&A, 374, 371 [NASA ADS] [CrossRef] [EDP Sciences] [Google Scholar]
- Orsi, Á., Padilla, N., Groves, B., et al. 2014, MNRAS, 443, 799 [Google Scholar]
- Pavesi, R., Riechers, D. A., Capak, P. L., et al. 2016, ApJ, 832, 151 [Google Scholar]
- Pavesi, R., Riechers, D. A., Sharon, C. E., et al. 2018, ApJ, 861, 43 [Google Scholar]
- Pavesi, R., Riechers, D. A., Faisst, A. L., et al. 2019, ApJ, 882, 168 [Google Scholar]
- Pensabene, A., Carniani, S., Perna, M., et al. 2020, A&A, 637, A84 [NASA ADS] [CrossRef] [EDP Sciences] [Google Scholar]
- Pensabene, A., Decarli, R., Bañados, E., et al. 2021, A&A, 652, A66 [NASA ADS] [CrossRef] [EDP Sciences] [Google Scholar]
- Perera, T. A., Chapin, E. L., Austermann, J. E., et al. 2008, MNRAS, 391, 1227 [NASA ADS] [CrossRef] [Google Scholar]
- Pety, J., Beelen, A., Cox, P., et al. 2004, A&A, 428, L21 [NASA ADS] [CrossRef] [EDP Sciences] [Google Scholar]
- Pope, A., Scott, D., Dickinson, M., et al. 2006, MNRAS, 370, 1185 [Google Scholar]
- Riechers, D. A., Pavesi, R., Sharon, C. E., et al. 2019, ApJ, 872, 7 [Google Scholar]
- Rybak, M., Zavala, J. A., Hodge, J. A., et al. 2020, ApJ, 889, L11 [NASA ADS] [CrossRef] [Google Scholar]
- Salak, D., Hashimoto, T., Inoue, A. K., et al. 2024, ApJ, 962, 1 [NASA ADS] [CrossRef] [Google Scholar]
- Sanders, R. L., Shapley, A. E., Topping, M. W., et al. 2023, ApJ, 955, 54 [NASA ADS] [CrossRef] [Google Scholar]
- Schreiber, C., Labbé, I., Glazebrook, K., et al. 2018, A&A, 611, A22 [NASA ADS] [CrossRef] [EDP Sciences] [Google Scholar]
- Schreiber, C., Glazebrook, K., Papovich, C., et al. 2021, A&A, 646, A68 [NASA ADS] [CrossRef] [EDP Sciences] [Google Scholar]
- Shao, Y., Wang, R., Carilli, C. L., et al. 2019, ApJ, 876, 99 [NASA ADS] [CrossRef] [Google Scholar]
- Solomon, P. M., & Vanden Bout, P. A. 2005, ARA&A, 43, 677 [NASA ADS] [CrossRef] [Google Scholar]
- Staguhn, J. G., Kovács, A., Arendt, R. G., et al. 2014, ApJ, 790, 77 [NASA ADS] [CrossRef] [Google Scholar]
- Sun, F., Helton, J. M., Egami, E., et al. 2024, ApJ, 961, 69 [NASA ADS] [CrossRef] [Google Scholar]
- Sutter, J., Dale, D. A., Croxall, K. V., et al. 2019, ApJ, 886, 60 [NASA ADS] [CrossRef] [Google Scholar]
- Sutter, J., Dale, D. A., Sandstrom, K., et al. 2021, MNRAS, 503, 911 [NASA ADS] [CrossRef] [Google Scholar]
- Tadaki, K. i., Iono, D., Hatsukade, B., et al. 2019, ApJ, 876, 1 [NASA ADS] [CrossRef] [Google Scholar]
- Tadaki, K.-i., Tsujita, A., Tamura, Y., et al. 2022, PASJ, 74, L9 [NASA ADS] [CrossRef] [Google Scholar]
- Tan, Q., Daddi, E., Magdis, G., et al. 2014, A&A, 569, A98 [NASA ADS] [CrossRef] [EDP Sciences] [Google Scholar]
- Tripodi, R., Feruglio, C., Fiore, F., et al. 2022, A&A, 665, A107 [NASA ADS] [CrossRef] [EDP Sciences] [Google Scholar]
- Tripodi, R., Feruglio, C., Fiore, F., et al. 2024, A&A, 689, A220 [NASA ADS] [CrossRef] [EDP Sciences] [Google Scholar]
- Valentino, F., Magdis, G. E., Daddi, E., et al. 2018, ApJ, 869, 27 [Google Scholar]
- Veilleux, S., & Osterbrock, D. E. 1987, ApJS, 63, 295 [Google Scholar]
- Venemans, B. P., Walter, F., Neeleman, M., et al. 2020, ApJ, 904, 130 [Google Scholar]
- Vishwas, A., Ferkinhoff, C., Nikola, T., et al. 2018, ApJ, 856, 174 [NASA ADS] [CrossRef] [Google Scholar]
- Vizgan, D., Heintz, K. E., Greve, T. R., et al. 2022, ApJ, 939, L1 [NASA ADS] [CrossRef] [Google Scholar]
- Wagg, J., Carilli, C. L., Wilner, D. J., et al. 2010, A&A, 519, L1 [NASA ADS] [CrossRef] [EDP Sciences] [Google Scholar]
- Walter, F., Weiß, A., Riechers, D. A., et al. 2009, ApJ, 691, L1 [NASA ADS] [CrossRef] [Google Scholar]
- Walter, F., Decarli, R., Carilli, C., et al. 2012, Nature, 486, 233 [Google Scholar]
- Walter, F., Neeleman, M., Decarli, R., et al. 2022, ApJ, 927, 21 [NASA ADS] [CrossRef] [Google Scholar]
- Wang, R., Carilli, C. L., Wagg, J., et al. 2008, ApJ, 687, 848 [NASA ADS] [CrossRef] [Google Scholar]
- Wang, R., Wagg, J., Carilli, C. L., et al. 2013, ApJ, 773, 44 [Google Scholar]
- Yang, C., Omont, A., Martín, S., et al. 2023, A&A, 680, A95 [NASA ADS] [CrossRef] [EDP Sciences] [Google Scholar]
- Zavala, J. A., Castellano, M., Akins, H. B., et al. 2025, Nat. Astron., 9, 155 [Google Scholar]
- Zhao, Y., Lu, N., Xu, C. K., et al. 2013, ApJ, 765, L13 [Google Scholar]
- Zhao, Y., Lu, N., Xu, C. K., et al. 2016, ApJ, 819, 69 [Google Scholar]
Appendix A: Line integrated and continuum maps
We present the [NII] 205 μm integrated emission line and continuum maps of the three submillimeter galaxies and three quasar host galaxies in our sample. The [NII] 205 maps were created by integrating over the line width centering at the redshifted reference frequency, while the continuum maps were created by integrating the cube along the line-free channels. The resulting maps are shown below.
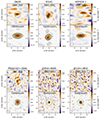 |
Fig. A.1. The [NII] 205 integrated line maps and the corresponding continuum maps of the submillimeter galaxies (upper panel) and the quasar hosts (lower panel) from our sample. The [NII] 205 maps were integrated over the width of their respective [NII] 205 μm FWHM (and over the [CII] 158 μm FWHM for sources undetected in the [NII] 205 μm emission). The full (dashed) contours represent the +(-) 2σ, 4σ, 6σ, 8σ, 16σ regions, where σ is the rms noise of the integrated maps. The respective synthesized beam sizes (if present) are shown in the lower left corner of each panel. To guide the eye, a green dotted circle is placed centering the measured continuum coordinates of the source. The respective continuum maps are shown below the [NII] 205 μm integrated maps. |
Appendix B: Dust spectral energy distributions
We reconstruct and fit the dust spectral energy distribution (SED) for our sources, incorporating our new continuum estimates (see Table 3). The continuum flux densities taken from the literature for each source are tabulated in Table B.2. We fit the SED by adopting a modified blackbody, following the formula given in Novak et al. (2019) (see Novak et al. 2019, eq. 1), and explored the parameter space using a Markov chain Monte Carlo (MCMC) algorithm. Additionally, the sizes of the continuum emitting regions are described in Tripodi et al. (2022) for J2310+1855, and in Wang et al. (2013), Hashimoto et al. (2019), Ishii et al. (2025), and Salak et al. (2024) for J2054-0005. Thus, we model the dust SED of the two quasars in an optically thick regime using a modified blackbody model based on Decarli et al. (2023) (see Decarli et al. 2023, eq. 3), where the mean size of the emitting region was fixed during the fits. For both models, we adopt the opacity model following Beelen et al. (2006), which specifies a mass absorption coefficient k0 = 0.45 cm2 g−1 and ν0 = 250 GHz.
The left panels of Fig. B.1. and B.2. display the best fit of the dust SEDs for submillimeter galaxies and quasar host galaxies, respectively. The red star in the plots represents the continuum flux density estimated in this work, while the black squares indicate the flux densities sourced from the literature. On the right of each SED plot, the corner plot shows the posterior probability distributions for the dust mass (Mdust), dust temperature (Tdust), and the dust spectral emissivity index (β). The dashed blue lines in each corner plot mark the 16th, 50th, and 84th percentiles for each parameter, which correspond to a 1σ deviation from the mean. The derived parameters from the fit, along with the estimated total infrared luminosity used in this study, are listed in Table B.1.
Results of the MCMC SED fitting
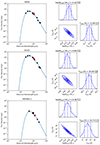 |
Fig. B.1. Dust SED fit for GN20, ID141, and HDF. See text for more information. |
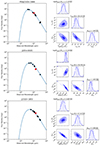 |
Fig. B.2. Dust SED fit for PSSJ2322+1944, J2054-0005, and J2310+1855. See text for more information. |
Continuum flux densities from literature used in the dust SED fit.
All Tables
All Figures
|
Fig. 1. Observed [NII] 205 μm spectra of the sources in our sample. The orange histogram represents the 1D spectra of submillimeter galaxies, while the red histogram represents the spectra of quasar hosts. The best Gaussian plus continuum fit is shown in solid blue. The dashed blue line represents the mean dust continuum flux for sources undetected in the [NII] 205 μm emission. The gray bar represents the mean error (RMS) of the spectrum, while the black bar represents the width of the [CII] 158 μm line used to estimate the upper limit on the integrated line flux for the non-detections (see Sect. 3.1). The zero velocity is with respect to the reference redshift in Table 1. |
| In the text | |
|
Fig. 2. [NII]-to-IR ratio as a function of IR luminosity for the sources in our sample. Our sample is illustrated as stars, following the same color scheme in Fig. 1. We also compile sources from the local Universe (green triangles) as well as at high redshifts (orange and red squares and blue triangles) that have been detected in [NII] 205 μm emission. The green and blue bars represent the mean error bars for their respective data points. All luminosities have been corrected for gravitational magnification. Our new measurements further populate the sparser high end of the infrared luminosity regime of such sources. |
| In the text | |
|
Fig. 3. [CII]-to-[NII] ratio as a function of IR luminosity for the sources in our sample as well as for galaxies taken from the literature that are detected in both [CII] 158 μm and [NII] 205 μm, assuming the commonly adopted [CII] |
| In the text | |
|
Fig. A.1. The [NII] 205 integrated line maps and the corresponding continuum maps of the submillimeter galaxies (upper panel) and the quasar hosts (lower panel) from our sample. The [NII] 205 maps were integrated over the width of their respective [NII] 205 μm FWHM (and over the [CII] 158 μm FWHM for sources undetected in the [NII] 205 μm emission). The full (dashed) contours represent the +(-) 2σ, 4σ, 6σ, 8σ, 16σ regions, where σ is the rms noise of the integrated maps. The respective synthesized beam sizes (if present) are shown in the lower left corner of each panel. To guide the eye, a green dotted circle is placed centering the measured continuum coordinates of the source. The respective continuum maps are shown below the [NII] 205 μm integrated maps. |
| In the text | |
|
Fig. B.1. Dust SED fit for GN20, ID141, and HDF. See text for more information. |
| In the text | |
|
Fig. B.2. Dust SED fit for PSSJ2322+1944, J2054-0005, and J2310+1855. See text for more information. |
| In the text | |
Current usage metrics show cumulative count of Article Views (full-text article views including HTML views, PDF and ePub downloads, according to the available data) and Abstracts Views on Vision4Press platform.
Data correspond to usage on the plateform after 2015. The current usage metrics is available 48-96 hours after online publication and is updated daily on week days.
Initial download of the metrics may take a while.