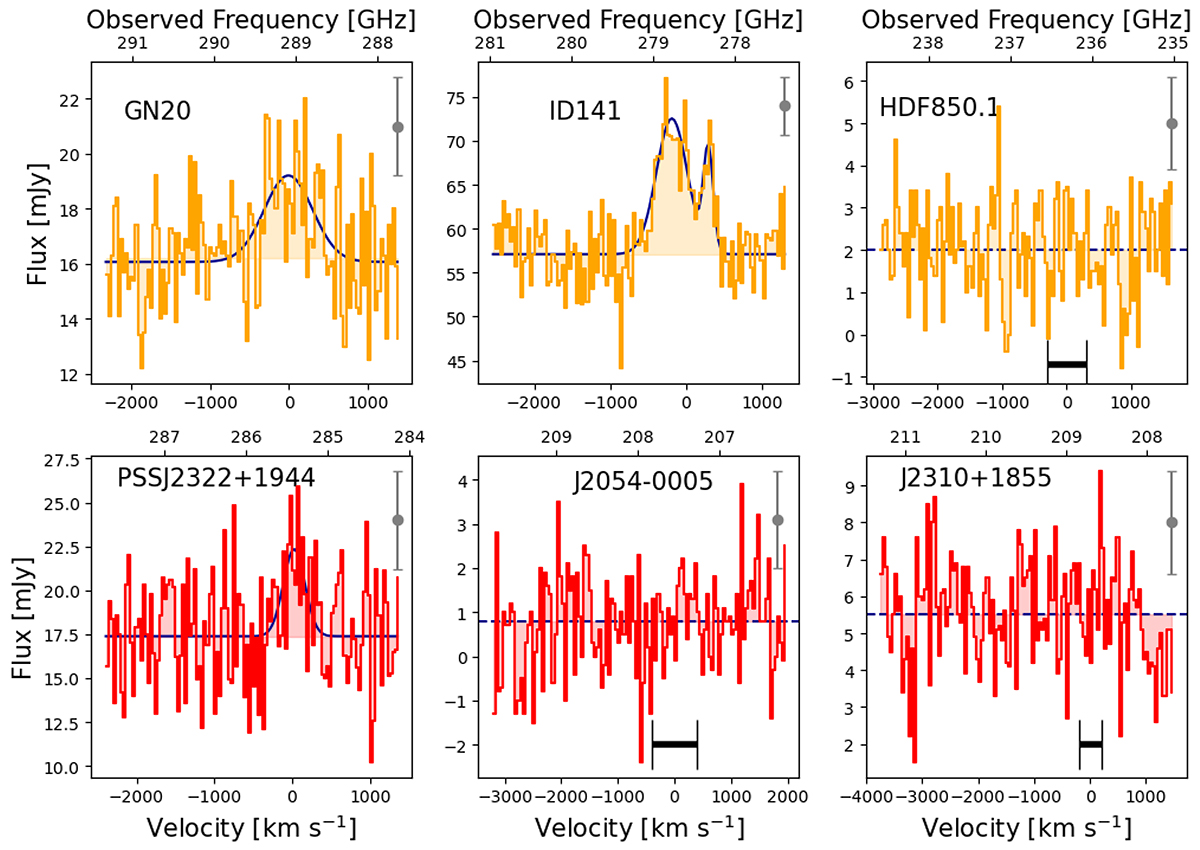
Fig. 1.
Download original image
Observed [NII] 205 μm spectra of the sources in our sample. The orange histogram represents the 1D spectra of submillimeter galaxies, while the red histogram represents the spectra of quasar hosts. The best Gaussian plus continuum fit is shown in solid blue. The dashed blue line represents the mean dust continuum flux for sources undetected in the [NII] 205 μm emission. The gray bar represents the mean error (RMS) of the spectrum, while the black bar represents the width of the [CII] 158 μm line used to estimate the upper limit on the integrated line flux for the non-detections (see Sect. 3.1). The zero velocity is with respect to the reference redshift in Table 1.
Current usage metrics show cumulative count of Article Views (full-text article views including HTML views, PDF and ePub downloads, according to the available data) and Abstracts Views on Vision4Press platform.
Data correspond to usage on the plateform after 2015. The current usage metrics is available 48-96 hours after online publication and is updated daily on week days.
Initial download of the metrics may take a while.