Fig. A.1.
Download original image
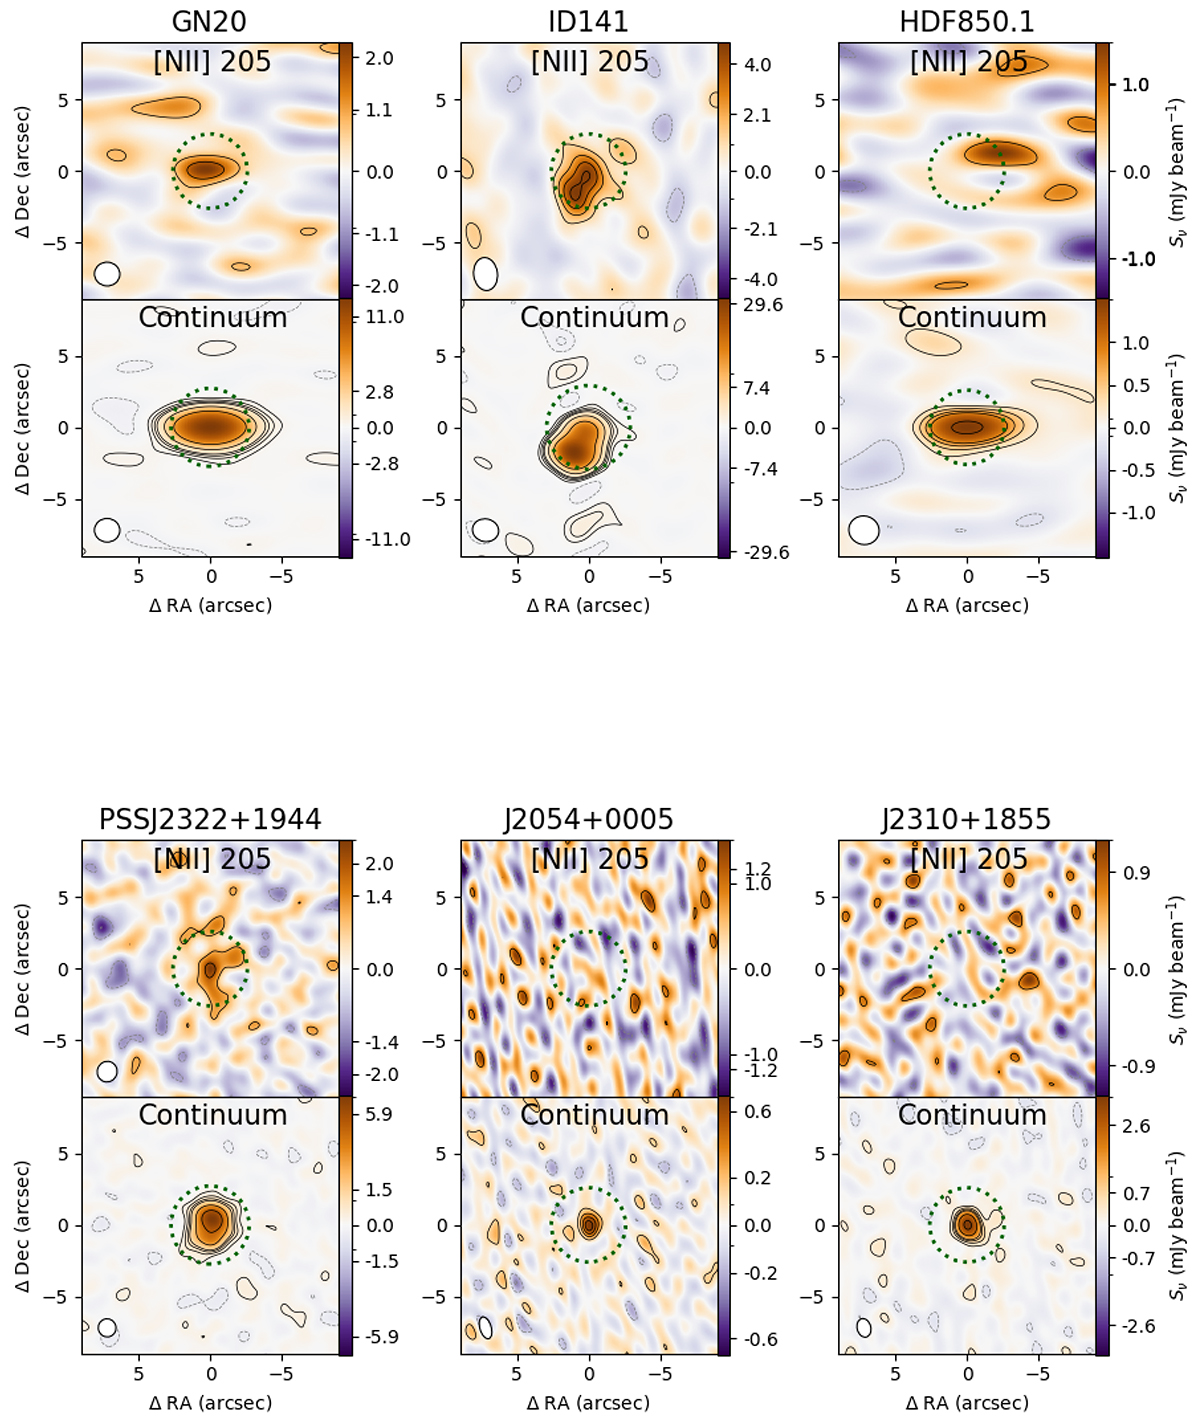
The [NII] 205 integrated line maps and the corresponding continuum maps of the submillimeter galaxies (upper panel) and the quasar hosts (lower panel) from our sample. The [NII] 205 maps were integrated over the width of their respective [NII] 205 μm FWHM (and over the [CII] 158 μm FWHM for sources undetected in the [NII] 205 μm emission). The full (dashed) contours represent the +(-) 2σ, 4σ, 6σ, 8σ, 16σ regions, where σ is the rms noise of the integrated maps. The respective synthesized beam sizes (if present) are shown in the lower left corner of each panel. To guide the eye, a green dotted circle is placed centering the measured continuum coordinates of the source. The respective continuum maps are shown below the [NII] 205 μm integrated maps.
Current usage metrics show cumulative count of Article Views (full-text article views including HTML views, PDF and ePub downloads, according to the available data) and Abstracts Views on Vision4Press platform.
Data correspond to usage on the plateform after 2015. The current usage metrics is available 48-96 hours after online publication and is updated daily on week days.
Initial download of the metrics may take a while.