Fig. 2.
Download original image
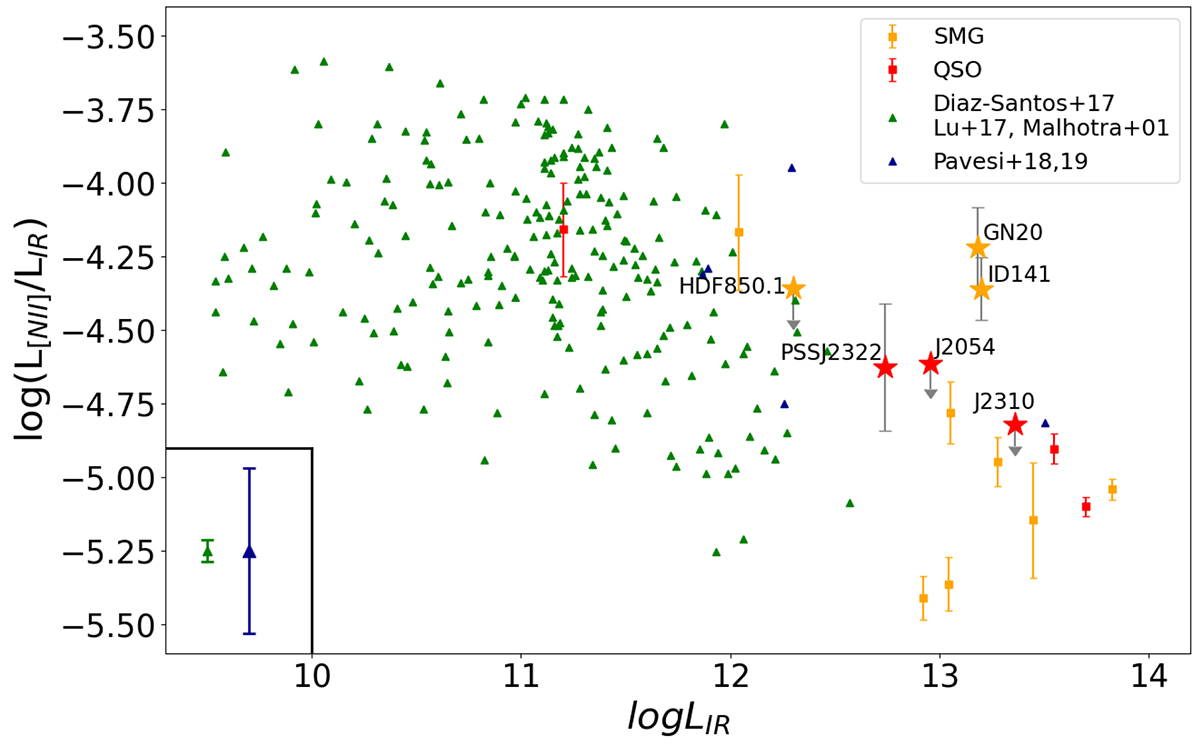
[NII]-to-IR ratio as a function of IR luminosity for the sources in our sample. Our sample is illustrated as stars, following the same color scheme in Fig. 1. We also compile sources from the local Universe (green triangles) as well as at high redshifts (orange and red squares and blue triangles) that have been detected in [NII] 205 μm emission. The green and blue bars represent the mean error bars for their respective data points. All luminosities have been corrected for gravitational magnification. Our new measurements further populate the sparser high end of the infrared luminosity regime of such sources.
Current usage metrics show cumulative count of Article Views (full-text article views including HTML views, PDF and ePub downloads, according to the available data) and Abstracts Views on Vision4Press platform.
Data correspond to usage on the plateform after 2015. The current usage metrics is available 48-96 hours after online publication and is updated daily on week days.
Initial download of the metrics may take a while.