Fig. 2.
Download original image
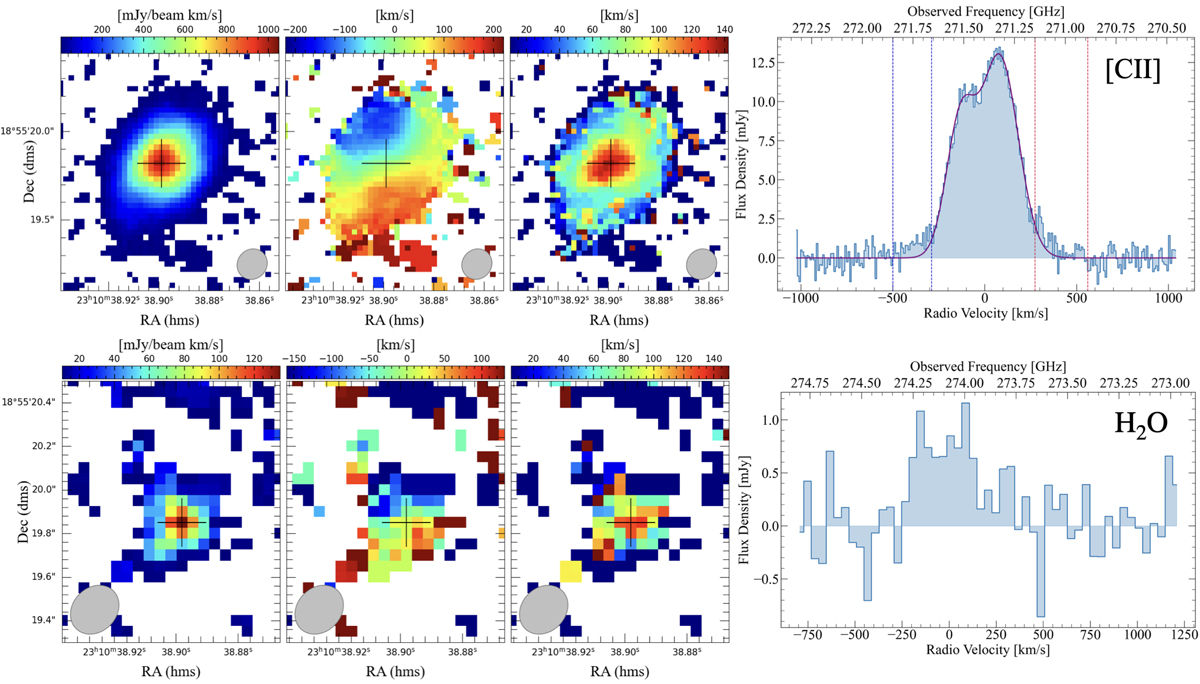
Moment maps of the [CII] emission line (top panels) and of the emission line detected at 274.084 GHz (bottom panels), identified as the H2O v = 03(2, 2)−3(1, 3). From left to right: integrated flux, mean velocity map, and velocity dispersion map, continuum-subtracted spectra of [CII] (top right) and H2O (bottom right). The clean beam is plotted in the lower right or left corner of the moment maps. The cross indicates the peak position of the integrated flux for each line. The spectra have been extracted from the region included within ≥2σ in the velocity integrated map. In the [CII] spectrum, the vertical blue and red lines highlight the spectral regions in which the flux is higher than in the Gaussian fit (solid purple line). The H2O spectrum has been rebinned to 40 km s−1.
Current usage metrics show cumulative count of Article Views (full-text article views including HTML views, PDF and ePub downloads, according to the available data) and Abstracts Views on Vision4Press platform.
Data correspond to usage on the plateform after 2015. The current usage metrics is available 48-96 hours after online publication and is updated daily on week days.
Initial download of the metrics may take a while.