Open Access
Fig. 1.
Download original image
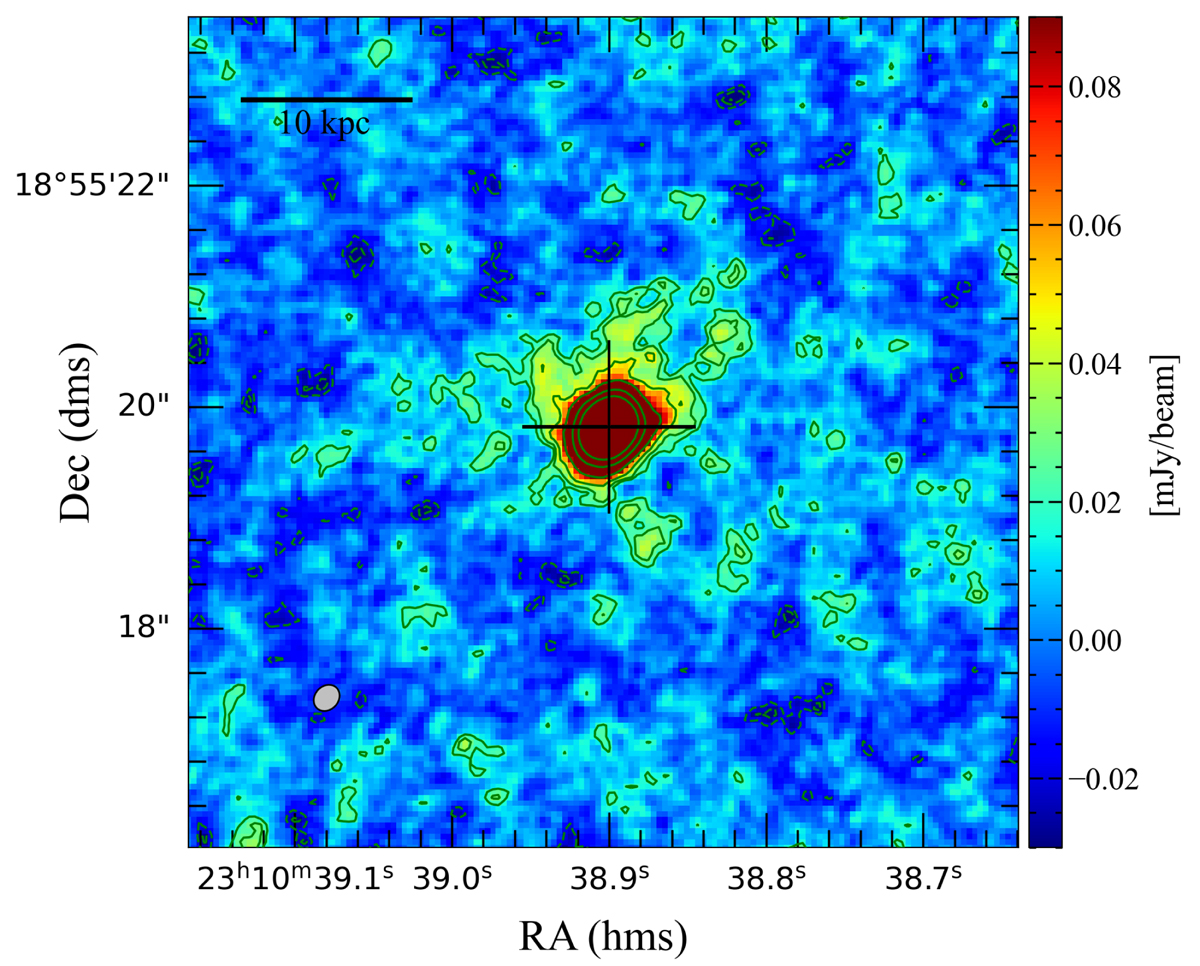
260 GHz dust continuum map of QSO J2310+1855 (levels −4, −3, −2, 2, 3, 5, 10, 25, and 50σ, σ = 9.15 μJy beam−1). The clean beam (0.26 × 0.21 arcsec2) is indicated in the lower left corner of the diagram. The cross indicates the position of the continuum peak.
Current usage metrics show cumulative count of Article Views (full-text article views including HTML views, PDF and ePub downloads, according to the available data) and Abstracts Views on Vision4Press platform.
Data correspond to usage on the plateform after 2015. The current usage metrics is available 48-96 hours after online publication and is updated daily on week days.
Initial download of the metrics may take a while.