Fig. 8.
Download original image
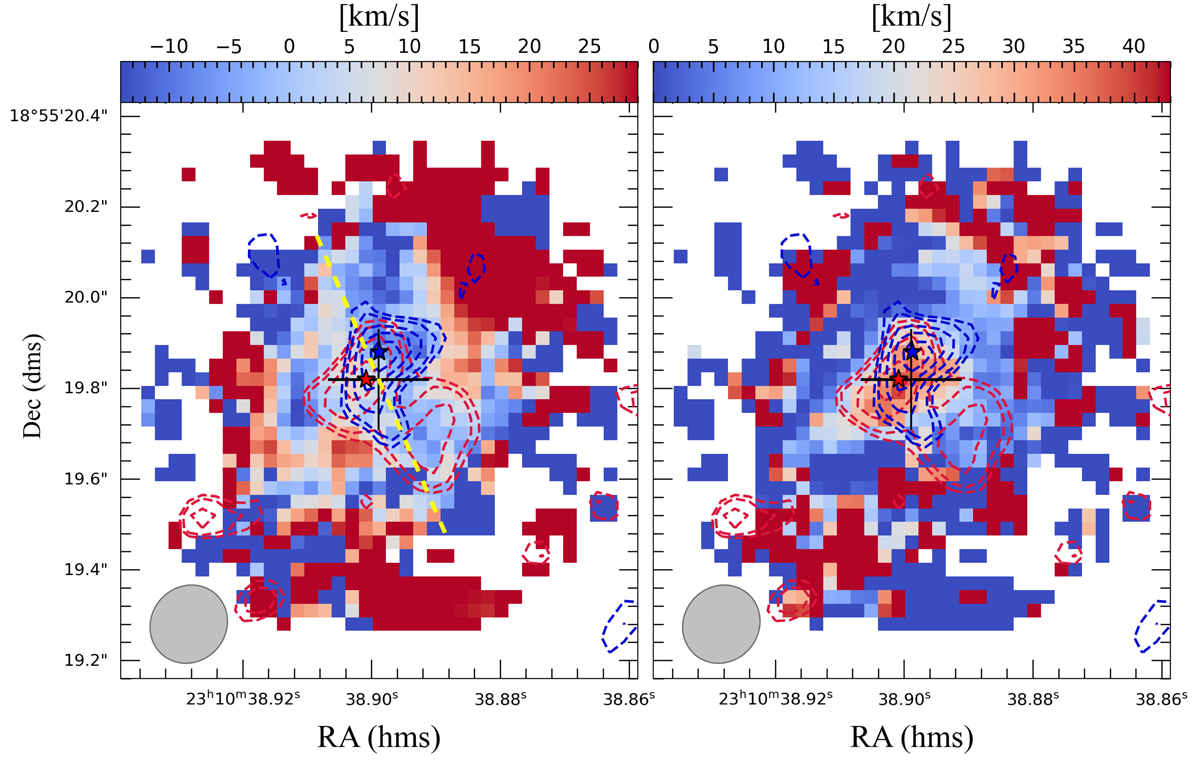
3DBarolo residuals of mean velocity map (left panel) and velocity dispersion map (right panel) of the [CII] emission line. The contours of red and blue wings are overplotted. Levels are 2.5, 3, 4, 5, and 6σ, with σ = 39 μJy for the red wing and σ = 43 μJy for the blue wing. The red and blue wings have been selected from the [CII] spectrum as shown in Fig. 2. The dashed yellow line is the kinematic major axis of the [CII] line, at PA = 200 deg. The clean beam is indicated in the lower left corner. The excesses at the border of the source should not be considered because they are due to the poor subtraction of the noise.
Current usage metrics show cumulative count of Article Views (full-text article views including HTML views, PDF and ePub downloads, according to the available data) and Abstracts Views on Vision4Press platform.
Data correspond to usage on the plateform after 2015. The current usage metrics is available 48-96 hours after online publication and is updated daily on week days.
Initial download of the metrics may take a while.