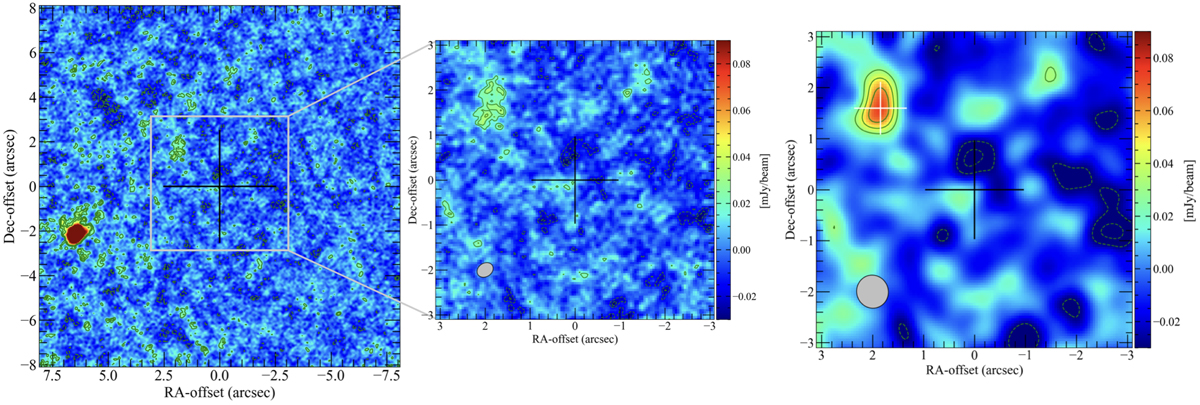
Fig. 3.
Download original image
Dust continuum maps of the QSO field with different resolutions. Left panel: dust continuum map of the QSO field centred on the phase-tracking centre of the observation. Levels are −3, −2, 2, 3, and 4σ, σ = 8.8 μJy beam−1. The cross indicates the phase centre. In this map the QSO is located at offset [6, −2] arcsec. Central panel: zoomed view towards the phase centre. The clean beam is plotted in the lower left corner. Right panel: 260 GHz dust continuum uv-tapered map of Serenity-18 (levels −4, −3, −2, 2, 4, and 5σ, σ = 15 μJy beam−1). The imaging has been performed with uvtaper = [0.5 arcsec]. The clean beam is indicated in the lower left corner. The black cross indicates the position of the phase-tracking centre, which coincides with the expected position of the CO-emitter Serenity-18 (D’Odorico et al. 2018). The white cross indicates the continuum emitter detected in the beam (see text).
Current usage metrics show cumulative count of Article Views (full-text article views including HTML views, PDF and ePub downloads, according to the available data) and Abstracts Views on Vision4Press platform.
Data correspond to usage on the plateform after 2015. The current usage metrics is available 48-96 hours after online publication and is updated daily on week days.
Initial download of the metrics may take a while.