| Issue |
A&A
Volume 663, July 2022
|
|
|---|---|---|
| Article Number | A64 | |
| Number of page(s) | 37 | |
| Section | Interstellar and circumstellar matter | |
| DOI | https://doi.org/10.1051/0004-6361/202142117 | |
| Published online | 14 July 2022 | |
Investigating dust properties in AGB wind-ISM interaction regions
1
Department of Space, Earth and Environment, Chalmers University of Technology,
412 96
Gothenburg, Sweden
e-mail: maercker@chalmers.se
2
Department of Astrophysics, University of Vienna, Türkenschanzstr. 17,
1180
Vienna, Austria
Received:
31
August
2021
Accepted:
11
April
2022
Aims. In this paper, we aim to constrain the dust mass and grain sizes in the interaction regions between the stellar winds and the interstellar medium (ISM) around asymptotic giant branch (AGB) stars. By describing the dust in these regions, we aim to shed light on the role of evolved low-mass stars in the origin of dust in galaxies.
Methods. We use images in the far-infrared (FIR) at 70 and 160 µm to derive dust temperatures and dust masses in the wind-ISM interaction regions around a sample of carbon-rich and oxygen-rich AGB stars. The dust temperature and mass are determined in two ways: first, directly from the data using the ratio of the measured fluxes and assuming opacities for dust with a constant grain size of 0.1 µm, and then using three-dimensional dust-radiative transfer models spatially constrained by the observations. Each of the radiative transfer models contains one constant grain size, which is varied between 0.01 and 5.0 µm.
Results. We find that the observed dust mass in the wind-ISM interaction regions is consistent with mass accumulated from the stellar winds. For the carbon-rich sources, adding the spatial constraints in the radiative transfer models results in preferentially larger grain sizes (≈2 µm). For the oxygen-rich sources, the spatial constraints result in overly high temperatures in the models, making it impossible to fit the observed FIR ratio irrespective of the grain size used, indicating a more complex interplay of grain properties and the stellar radiation field.
Conclusions. Our results have implications for how likely it is for the grains to survive the transition into the ISM, and the properties of dust particles that later act as seeds for grain growth in the ISM. However, our results for the oxygen-rich sources show that the derivation of dust properties is not straight forward, requiring more complex modelling.
Key words: stars: AGB and post-AGB / circumstellar matter / dust / extinction
© M. Maercker et al. 2022
 Open Access article, published by EDP Sciences, under the terms of the Creative Commons Attribution License (https://creativecommons.org/licenses/by/4.0), which permits unrestricted use, distribution, and reproduction in any medium, provided the original work is properly cited.
This article is published in open access under the Subscribe-to-Open model. Subscribe to A&A to support open access publication.
1 Introduction
Dust grains are solid-state particles with sizes ranging from a few nanometres (nm) to a few micrometres (µm), a large variety of chemical compositions, and with complex surface morphologies. The formation and evolution of dust in astrophysical sources is strongly affected by the density and temperature of the surrounding gas, shocks and gas compression, the radiation fields, and the chemical abundances. The bulk of the dust observed in galaxies is likely a consequence of grain growth on seed particles released into the interstellar medium (ISM; e.g. Ginolfi et al. 2018, and references therein). The efficiency of grain growth in the ISM is still heavily debated and depends on the chemical evolution of the galaxies and the properties of the seed particles (Ferrara et al. 2016; Zhukovska et al. 2016; Ginolfi et al. 2018). There is little doubt that evolved stars provide the seeds for grain growth in the Universe. The seeds are the result of reprocessing of grains that were originally formed in the winds and ejecta of evolved stars. High-mass stars (Mstar ≳ 8–10 M⊙) end their evolution in supernova (SN) explosions. As the ejecta from the SN cools behind the shock moving through the pre-SN wind, dust particles form which are released into the ISM where they can act as seed particles. However, the reverse shock from the SN likely destroys a large fraction of the formed dust (possibly more than 90% of the original dust mass; Bocchio et al. 2016). In contrast, the majority of all stars that have died in the Milky Way evolved along the asymptotic giant branch (AGB) and ended their lives in a less violent manner. Through their mass-loss, AGB stars are major contributors of dust grains (e.g. Ferrarotti & Gail 2006; Höfner & Olofsson 2018, and references therein). The dust grains are released to the ISM where the stellar wind collides with the surrounding interstellar matter, providing seed particles for ISM grain growth. In models of the Large Magellanic Cloud (LMC), total dust production rates fit the observed dust mass if destruction through a SN reverse shock is included (Schneider et al. 2014). In this case, the dust from AGB stars may account for up to 70% of the total dust budget observed at the present time. At earlier times the contribution from SN explosions dominates the dust production, owing to the longer evolutionary timescales for low-mass stars. The point at which dust production is dominated by AGB stars is very model dependent, and may happen already for galaxies at redshift 4-5 (Michałowski et al. 2010).
It is possible that up to 90% of the dust produced in stars comes from low-mass stars (Draine 2009), and the detection of pre-solar grains from low-mass stars in meteorites shows that (at least) some of this dust survives and can act as seeds for grain growth in the ISM (Heck et al. 2020). Indeed, models of the origin of dust in the Milky Way cannot explain the observed dust masses from stellar sources alone, strongly indicating that ISM grain growth must take place (Inoue 2011; Ginolfi et al. 2018).
The dust grains from AGB stars form in the extended atmosphere of the stars, where radiation pressure on the grains initiates the stellar wind (e.g. Woitke 2006; Khouri et al. 2016, 2020). The wind and resulting circumstellar envelope (CSE) may be asymmetric, are likely inhomogeneous, and experience continued grain growth and processing in denser regions out to a few stellar radii. Eventually, the dust is released into the ISM, when the stellar wind collides with the surrounding medium in the wind-ISM interaction region (Höfner & Olofsson 2018). The dust grains may contain complex molecules, and shield these latter from destruction by the interstellar radiation field and passage into the ISM. The mass, effectiveness of shielding, and the properties of seeds released into the ISM depend on the size, porosity, and structure of these stellar grains (Draine 2009). These properties in turn depend on the physical conditions in the dust formation and destruction regions. Attempts to determine the properties of dust grains have been made by looking at distinct features (e.g. de Vries et al. 2010) and continuum emission (e.g., Groenewegen et al. 2009; Ladjal et al. 2010; Maercker et al. 2018).
The properties of these original dust grains formed in the winds of evolved stars are directly connected to the properties of the seeds in the ISM, and the efficiency of the ISM growth depends directly on the properties of the stellar grains that are released into the ISM. Specifically, properties such as the size and structure of the seed grains are critical, as they determine the likelihood that the grains will grow (Draine 2009). Theoretical models of grain growth in the ISM combine critical dust properties in a generic ‘sticking coefficient’, constituting one of the largest uncertainties in grain-growth models (Zhukovska et al. 2016), emphasising the importance of determining these properties directly. In this paper we study a sample of wind-ISM interaction regions observed at far-infrared (FIR) wavelengths as a first step in studying the properties of the dust grains released into the ISM by AGB stars and their significance for the origin of dust in the ISM. We focus our analysis on the interaction regions between the wind and the ISM in order to empirically study the properties of the dust in these regions instead of the formation of the dust in the inner wind. A similar study using the same data was performed by Cox et al. (2012), albeit with a different approach and a focus on the overall geometry of the interaction regions rather than the dust properties. Section 2 describes the archival data we use in Sect. 3 to determine dust masses and temperatures. The results are presented in Sect. 4, including a comparison to the analysis by Cox et al. (2012). Finally, Sect. 5 contains a discussion that puts our results into the context of dust return to the ISM, an investigation of what constraints can be put on the grain sizes, and a description of the difficulties faced in reproducing the observations and determining the grain properties. Our conclusions on the dust in AGB wind-ISM interaction regions are then summarised in Sect. 6.
2 Data
The wind-ISM interaction regions around a sample of AGB stars and supergiants were observed as part of the MESS (Mass-loss of Evolved Stars) programme (Groenewegen et al. 2011) with PACS (Photodetector Array Camera and Spectrometer Poglitsch et al. 2010) aboard the Herschel Space Observatory (Pilbratt et al. 2010). The interaction regions were observed in scan maps in the blue (at 70 µm) and red (at 160 µm) filters. The emission in the infrared and the spatial resolution make it possible to determine the dust masses and dust temperatures in the wind- ISM interaction regions (Sects. 3.1 and 3.2). The data were fully reduced by the MESS team and presented in Cox et al. (2012, hereafter C2012). We use the highest level of the JScanam maps of the reduced data from the archive (data products are provided at varying quality levels). At 70 and 160 µm, the pixel scales are 1.″6 and 3.″2, respectively. The absolute flux calibration uncertainty of the observations is 15%. For more details on the data properties, see C2012 and the Herschel/PACS documentation1.
C2012 classified the observed structures based on their geometrical appearance into ‘fermata’, ‘rings’, ‘eyes’, and ‘irregular’. Here we investigate the subsample of sources classified as fermata (a central source surrounded by a bow shape (see e.g. Figs. A.3 or A.16) and rings (e.g. Fig. A.4). All the data included in this study are presented in Appendices A and B. The origin of the structures for these sources is likely dominated by the interaction of a spherical wind with the ISM, while the eyes and irregular shapes may have additional shaping mechanisms (e.g. interactions with companions). The sources included in this study, with some basic parameters, are listed in Table 1.
3 Methods
We use two methods to determine the temperatures and dust masses in the wind-ISM interaction regions: direct estimates from the data, and radiative transfer models. In the first, the temperature is directly obtained from the ratio of the observed fluxes and assumed opacity values for the grains (Sect. 3.1), while in the second method we explicitly model the wind-ISM interaction regions using three-dimensional dust radiative transfer to consistently derive the temperatures (Sect. 3.2).
3.1 Direct Estimates of Temperatures and Masses from the FIR Images
In the FIR, dust grains emit thermal radiation as a black body with temperature Td and modified by the dust opacity.
 (1)
(1)
where Md is the dust mass, B(λ,Td) is the blackbody flux at the dust temperature Td at wavelength λ, κλ is the absorption coefficient at wavelength λ, and D is the distance. The ratio of observed fluxes (RFIR = F70µm/F160µm) in the FIR therefore effectively constrains the (average) dust temperature and total dust mass, assuming optically thin dust emission and specific grain properties (that is, κλ for a particular grain). The PACS observations can therefore be used to directly determine the dust temperature and mass in the observed wind-ISM interaction regions.
We measure the total flux towards the wind-ISM interaction regions in the 70 and 160 µm filters after subtracting a local background outside the wind-ISM interaction regions, and summing the flux above the rms value (determined in the background regions). The star and present-day mass-loss dominate the flux along the line-of-sight towards the central star, and these regions are masked out. The error in the individual measurements of the total flux is ∼1% In some cases, the rms cut-off is not sufficient to exclude emission outside of the wind-ISM interaction structure, and does not exclude the contribution from background sources. In these cases, the flux is determined by hand within a polygon surrounding the main structure. By comparing the change in the measured flux using different polygon areas, we find that while the manual selection generally does not affect the fluxes measured in the 70 µm images (by less than 10%), this can have a much stronger effect on the measured 160 µm fluxes. Adding the absolute calibration uncertainty of 15%, we estimate the total uncertainties in the measured flux values to be ≈18% in the 70 µm images and ≈25% in the 160 µm images. The measured 70 and 160 µm fluxes, and the resulting RFIR are shown in Table 1.
In all cases, we assume optically thin dust emission from spherical grains with a constant radius of agr = 0.1 µm. This is comparable to what is typically assumed in AGB CSEs (e.g. Schöier et al. 2005; Ramstedt et al. 2009; Höfner 2008; Mattsson & Höfner 2011; Norris et al. 2012), and allows us to directly compare to C2012; however, see Sect. 5.2 for a discussion on grain sizes. For oxygen-rich sources (i.e. M-type and S-type stars) we use the absorption and scattering coefficients for astronomical silicates (Suh 1999) with a grain density of 3.3 g cm–3, giving a κλ of 71.08 and 12.71 cm2 g–1 at 70 and 160 µm, respectively, calculated using Mie theory. For carbon-rich sources, we use the absorption and scattering coefficients for amorphous carbon grains (Suh 2000) with a grain density of 1.8 g cm–3, giving a κλ of 86 cm2 g–1 and 26 cm2 g–1 at 70 and 160 µm, respectively. The measured fluxes and derived masses and temperatures ( and
and  , respectively) are presented in Table 1. The uncertainties in the flux measurement lead to uncertainties of ≈60% in
  and ≈ 15% in
  . We note that this method does not take any spatial constraints into consideration. The results merely provide the temperature for which the input dust grains will produce the observed ratios in the FIR. Different dust grains will produce the same FIR ratio, albeit at different temperatures. The actual temperature of the grains in the observed wind-ISM interaction regions depends on the stellar radiation field (the spectral energy distribution (SED) of the star), the effect of the present-day wind on the SED, the distance between the wind- ISM interaction region and the star, and the grain properties. Using the spatial information from the PACS observations and modelling the observed structures and radiation fields explicitly therefore provides additional constraints on the dust properties in the observed regions.
Estimated masses and temperatures in the wind-ISM interaction regions based on the measured fluxes in the PACS 70 and 160 µm images and assuming agr = 0.1 µm.
3.2 Radiative Transfer Models with RADMC-3D
In addition to deriving a first estimate of the masses and temperatures using the total PACS fluxes, we therefore also model the main structures in the wind-ISM interaction regions. The wind-ISM interaction regions do not have a simple spherical symmetry, making it necessary to use three-dimensional (3D) models. We calculate models using v2.0 of the 3D radiative transfer code RADMC-3D (Dullemond 2012), which calculates the full frequency-dependent dust-radiative transfer using the Monte Carlo method, and produces images and spectra. Models can be calculated for any arbitrary 3D density distribution, allowing us to model the wind-ISM interaction regions explicitly, and to constrain the sizes and densities in the regions.
We focus here on the main observable structure of the bow shock. The bow shock is formed when the stellar wind collides with the surrounding ISM, and is affected by the velocity of the wind relative to the ISM and the density of the ISM (Wilkin 1996; Villaver et al. 2012; Cox et al. 2012). It is assumed that the stellar wind expands freely within the bubble created by the bow shock, and the position of the star and present-day wind with relation to the bow shock depend on the angle of the space motion of the star with respect to the local ISM.
In principle, the 3D surface of the bow shock can be described by a hollow paraboloid (a wilkinoid, see e.g. Wilkin 1996; Cox et al. 2012). This surface is derived assuming a ram-pressure balance between the stellar wind and the flow of the ISM and the conservation of momentum flux across the shell. The geometry is described by the stand-off distance between the star and the wind-ISM interaction region. Using this description for the bow-shock surface has the advantage that it depends on physical parameters (the present-day mass-loss rate, the stellar wind velocity, the density of the surrounding ISM, and the stellar space velocity), which in principle can be constrained by fitting the observed structures. However, we find that the observed structures are generally better described by ellipsoids rather than wilkinoids, in particular at large angles relative to the direction of the apex of the bow shock (Sect. 4.2 and Fig. 1).
In order to estimate the masses and densities in the wind- ISM interaction regions, we therefore approximate the 3D structure of the interaction regions with ellipsoidal shells that follow a Gaussian density distribution in the radial direction,
![${\rho _{{\rm{IA}}}}\left( r \right) \propto \exp \left( {{{ - {{\left( {r - {r_{{\rm{IA}}}}} \right)}^2}} \over {2\sigma _{{\rm{IA}}}^2}}} \right) \times \left[ { - \cos {{\left( {{\theta \over 2}} \right)}^A}} \right],$](/articles/aa/full_html/2022/07/aa42117-21/aa42117-21-eq11.png) (2)
(2)
where ρIA is the density in the wind-ISM interaction region, rIA is the distance from the star where the wind-ISM interaction region has its peak density, σIA is the width of the Gaussian distribution, θ is the angle to the apex of the bow shock, and A is an exponent that allows the density to taper off behind the star. The density is scaled so that the integral over the entire volume of the wind-ISM interaction region gives the total mass Md. The distance from the star is given by the ellipsoid
 (3)
(3)
where R0 is the distance between the apex of the bow shock and the star (the stand-off distance), and Rp is the distance perpendicular to R0 (Fig. 1). Depending on the geometry, R0 can either be the major or minor axis of the ellipsoid (with Rp then being the respective other axis). We construct “open” ellipsoids by setting the density to zero at angles θ > θlim. For most sources, θlim = 100°, with the exception of R Cas (θlim = 140°) and W Hya (a closed ellipsoid). We use a mild tapering off with A = 1–2. Only for θ Aps is the shell more strongly tapered with A = 4. We note that the parameters R0, Rp, and θlim are physical parameters. Their observed projection will change depending on the inclination angle of the wind-ISM interaction region.
In addition to the wind-ISM interaction region, we also model the stellar radiation field and the present-day (dusty) mass loss Ṁpd,d. As the focus of this work is on modelling the wind-ISM interaction regions, we use a simplified approach in modelling the stellar radiation field and present-day dust mass loss to include a reasonable incident radiation field. We investigate the effect of changes in the incident radiation field in Sect. 5.2. The central star is included assuming black body radiation with temperature Tst and luminosity Lst. The density of the present-day mass loss follows the standard 1/r2 density profile, assuming the same dust expansion velocity as the gas. This is a simplified approach, as in reality the dust will have a drift velocity relative to the gas. Observationally, this drift velocity cannot be measured, as it is generally not possibly to measure the velocity of the dust. However, theoretical models predict significant drift velocities, especially for objects with low mass-loss rates (e.g. Sandin & Höfner 2003; Sandin & Mattsson 2020).
The modelled dust mass-loss rates Ṁpd,d are therefore lower limits. However, the resulting density profile will still produce the required radiation field. The resulting SEDs are constrained by data downloaded from the Vizier online photometry viewer2 and by varying the Ṁpd,d until a satisfactory fit to the SED is found. The present-day dusty mass loss is not strongly constrained (at best to a factor of a few, Ramstedt et al. 2008), and for our purposes a reasonable fit to the data by eye is sufficient. The present-day wind-expansion velocities v∞ and gas-mass-loss rates Ṁgas are from C2012 (see references therein). The final Tst, Lst, and Ṁpd,d are presented in Table 2.
The model grids are 400″ × 400″ × 400″ with a step size of 2″, and are converted to cm using the distances provided in Table 2. We tested models with a finer grid, which did not affect the results significantly for the wind-ISM interaction regions. In the central pixel, the grid is refined to a 6 × 6 × 6 subgrid to properly sample the increasing density of the present-day wind. The number of photons in the Monte Carlo simulation is set to 500 000. We assume isotropic scattering by the dust grains. The details in the ray-tracing are described in the RADMC-3D manual.
Although RADMC-3D allows to model an arbitrary 3D structure, there are some limitations to what is feasible in this study. The description of the wind-ISM interaction region with an ellipsoid and a Gaussian density profile cannot reproduce deviations from this smooth geometry, such as arcs and/or clumpy structures, or extended tails behind the star. We therefore generally do not expect the models to be able to reproduce all the emission that is observed in the images. Instead we focus on the main, overall structures of the wind-ISM region, and rather than fitting the total model flux to the observed flux, we try to reproduce the surface brightness and overall spatial distribution of the emission in the images. This fitting is done by eye by varying the radii, widths, angles, and dust masses in the wind-ISM interaction regions (see the Figs. A.1–A.22 to see the observed and modelled structures). In general, the radii (R0 and Rp) are constrained to within ∼10% of the width of ΔrIA, with ΔrIA being constrained to within ≈15%. Although we are only considering sources classified as fermata or rings, the structures in some sources are either too weak, and/or too complex to be feasibly modelled. These sources are indicated with an asterisk in Table 1. We initially model all sources assuming the same carbon and silicate grains as in Sect. 3.1 with agr = 0.1 µm. Generally, we find it difficult to fit the emission in both the 70 and 160 µm filters (i.e. to reproduce the ratio between the two filters, RFIR, see Sect 5.2), and we therefore focus on reproducing the flux at 70 µm. Based on our experience, while manually fitting the interaction regions, we estimate the uncertainty in the dust mass to be on the order of ≈±20% (similar to the uncertainty in the flux measurement). The uncertainty in the derived R0 is estimated to be ≈± 10%. This may however be affected by the degree of clumpiness in the interaction region (making it more difficult to fit the surface brightness) and/or projection effects.
The results of the radiative transfer modelling of the wind- ISM interaction regions are given in Table 3. The density  refers to the peak density of the dust in the model in the wind-ISM interaction region. The model images are compared to the observations in Appendix A.
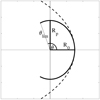 |
Fig. 1 Parameters of the ellipse shape describing the wind-ISM interaction regions: R0 (stand-off distance), Rp (the distance perpendicular to R0), and θ (the angle to the apex of the bow shock). The star is assumed to move towards the right relative to the ISM. The black dashed line shows the shape of the wilkinoid for the same stand-off distance (see text for details). |
Basic stellar and present-day wind parameters used as input in the modelling of the wind-ISM interaction regions.
4 Results
4.1 Direct estimates vs. radiative transfer modelling
Figure 2 shows the ratio between the dust masses and temperatures derived consistently in the radiative transfer modelling ( and
and  , respectively; Sect. 3.2) to the dust masses and temperatures estimated directly from the flux ratios in the images (
 and
and  , respectively; Sect. 3.1). Both the radiative transfer models and the direct estimates assume 0.1 µm-sized carbon or silicate grains. For the models, the total dust mass is systematically lower than the dust mass determined directly. On average, the ratio between
  and
and  is 0.6, both for the C-rich and the O-rich sources. This difference is caused by the temperatures in the radiative transfer models being higher than those inferred directly from the flux density ratios. The consequence is that the dust mass has to be reduced in the model in order to still fit the emission at 70 µm. As mentioned in Sect. 3.1, spatial constraints are not taken into account when determining the temperatures and dust masses from the ratios in the PACS images directly. As a consequence, when including the spatial constraints in the models and calculating the temperatures solving the radiative transfer, the grains become too warm, and the models do not reproduce the observed RFIR. This discrepancy likely reflects issues in the assumed dust properties and/or radiation fields (Sect. 5.2).
Results from the radiative transfer modelling with RADMC-3D assuming agr = 0.1 µm.
 |
Fig. 2 Ratios between dust temperatures and dust masses obtained through two different methods using 0.1 µm grains: full radiative transfer ( |
4.2 Comparison to the Findings of Cox et al. (2012)
The data that are used here were first presented by Cox et al. (2012). They provided a classification for the different wind-ISM interaction regions (see Sect. 2) and determine the dust masses in the wind-ISM interaction similar to our direct method. Cox et al. (2012) further discuss in detail the effect of the space motion and possible binarity on the observed structures, find an estimate of the density of the surrounding ISM, and run hydrodynamical models to investigate the morphology of the bow shock and the formation of instabilities. While we make use of a number of the results in C2012 (e.g. the classification scheme, the reduced data, and the derived position angles and inclinations), there are some notable differences in the method and focus:
C2012 measure the flux in apertures that follow the shape of the bow shock, within a certain radial range and angle, while we measure the entire flux in the image that is attributed to the wind-ISM interaction. As such, we generally measure more flux than C2012.
We use the same formalism to derive the dust mass based on the flux in the images (Eq. (1)). However, C2012 assume a fixed temperature of 30 K and determine separate dust masses based on the 70 and 160 µm fluxes, respectively. We use the ratio of the measured fluxes to constrain the temperature and then determine one dust mass.
C2012 use the same opacities for all sources (Li & Draine 2001), while we separate between carbon dust and silicate dust.
C2012 measure the stand-off distance (corrected for inclination) and use the description of wilkinoids to estimate the density of the surrounding ρISM.
C2012 calculate hydrodynamical models of the wind-ISM interaction regions to study the morphology and instabilities. However, they do not perform radiative transfer models of the dust to compare with the observed images.
C2012 derive estimates of the total dust mass in the wind- ISM interaction regions. However, they do not derive densities in the wind-ISM interaction regions.
As opposed to C2012, we focus on modelling the (typical) dust masses and dust temperatures, explicitly taking the shape and size of the wind-ISM interaction regions into account in 3D radiative transfer models, and investigate the constraints that can be set on the dust properties. Comparing our dust masses derived using Eq. (1) to the dust masses derived by these latter authors (we note that C2012 presented a corrigendum to their original results), our masses are systematically lower at only ≈30% of their masses measured at 70 µm, despite our generally larger fluxes. However, using our measured fluxes and fixing the temperature to T = 30 K, our masses using Eq. (1) increase by a factor 3.9 to an average of 17% larger than those of C2012. Additionally, using the opacities that C2012 use, the masses based on our measured fluxes increase by an additional factor of 1.25 to an average of 47% larger compared to those of C2012. From Table 1 it is clear that the temperature in the dust-emitting regions deviates significantly from 30 K (between 29 and 62 K, with an average of 40 K) for several objects when assuming 0.1 µm-sized grains. Therefore, although we in principle probe more of the mass in the wind-ISM interaction region by measuring the flux in the entire image (as opposed to using a limited aperture), by deriving the temperature instead of assuming one temperature, the total estimated mass decreases significantly compared to C2012. It is also worth noting that C2012 derive significantly different masses in the 70 and 160 µm images, indicating the same discrepancy in reproducing the observed RFIR (Sects. 4.1 and 5.2).
The other parameter we can directly compare is the standoff distance between the star and the bow shock. In C2012, this corresponds to the radius that defines the shape of the wilkinoid, while here it is the major or minor axis of the ellipsoid that is used to model the wind-ISM interaction region. C2012 give two radii, one that is predicted based on the stellar space velocity, the stellar mass-loss rate, the gas velocity of the stellar wind, the density in the surrounding ISM, and a radius measured in the observations (de-projected for the inclination angle). Their observed stand-off distances for the objects studied here are a factor of ≈2 smaller than what is predicted from the stellar space velocity. The radii derived in our models are consistent with the observed distances in C2012 (and the distances measured in the images). In order to investigate the formation and evolution of the interaction regions, C2012 present hydrodynamical models of the wind-ISM interaction. They find that the predicted stand-off distance is consistent with the models. However, the shape of the interaction region deviates significantly from what is predicted by the wilkinoid in most models. Depending on the density contrast between the stellar wind and ISM, and the velocities of the wind, dust, star, and ISM, instabilities can form that affect the overall geometry of the interaction regions, and the structure within the regions (e.g. width and clumpiness; see C2012 for a detailed discussion). The discrepancy emphasises the importance of modelling the interaction regions explicitly using hydrodynamical models (e.g. C2012; Villaver et al. 2012). In this context, it is worth noting that we generally cannot reproduce the observed shapes in the wind-ISM interaction regions using wilkinoids in our 3D radiative transfer models; for any given stand-off distance, the wilkinoid becomes too wide at increasing angles θ (Fig. 1). While the ellipsoid manages to reproduce the overall structures, it naturally fails to produce the extended tails that develop behind the stars. However, up to an angle of ≈ 100° (relative to the direction of the stand-off distance) we find that ellipsoids follow the shape of the interaction regions better than wilkinoids. For the purpose of this paper, it is important to place the observable dust in our models at the correct distance from the star. As such, our ellipsoids are ad hoc descriptions of the observed structures without underlying physical processes, but allow us to model the dust radiative transfer of the observed structures.
5 Discussion
5.1 Structure and Densities
The set of PACS observations of the wind-ISM interaction regions around AGB stars show a variety of morphologies (C2012). The different morphologies can generally be explained with the interaction of the stellar wind with the ISM, and/or the interaction between different periods of the stellar wind with varying mass-loss rates and expansion velocities. A full description of the structures requires hydrodynamical modelling of the winds and the surrounding material (Sect. 4.2 and, e.g., Steffen & Schönberner 2000; Mattsson et al. 2007; Wareing et al. 2007; Cox et al. 2012; Villaver et al. 2012). Keeping that in mind, the wind-ISM interaction regions modelled here can be accurately reproduced overall using an ellipsoid, and the derived stand-off distance is still connected to relevant physical parameters, such as the stellar- and wind-velocities, the mass-loss rate, and the density in the surrounding ISM.
The derived full width at half maximum (FWHM) of the interaction regions ΔrIA is 10-15% of the stand-off distance. This is consistent with the detached shells around carbon stars created by wind-wind interaction (e.g. Schöier et al. 2005; Mattsson et al. 2007; Maercker et al. 2010; Olofsson et al. 2010). However, we note that for some objects, a clear distinction can be made between the wind-wind interaction due to a thermal pulse and the wind-ISM interaction. The carbon stars U Cam, R Scl, and S Sct show clear wind-ISM interaction regions at further distances from the star than the spherical detached shells, indicating a predominantly radial wind-wind interaction due to a thermal pulse inside the wind-ISM interaction region. In the case of spherical shells, the origin of the observed structures may therefore be due to wind-ISM interaction, and/or wind-wind interaction following a thermal pulse.
Libert et al. (2007) present a simple model in order to describe the properties of the detached dust shell around the carbon star Y CVn. In their model the interaction with the ISM consists of a spherical shell with external material swept up from the ISM by the bow shock, separated from circumstellar material by a contact discontinuity (see Fig. 5 in Libert et al. 2007). They estimate the total mass of the shell to be dominated by cir-cumstellar material, with the mass swept up from the ISM only constituting a few percent of the total mass.
In order to get a rough estimate of the timescales and densities for the sources discussed here, we assume a simplified approximation of the wind-ISM interaction regions along the lines of the work by Libert et al. (2007). For each source, we assume a spherical half-shell with a radius R0 and width ΔrIA, and estimate the amount of mass that could have been swept up by the surrounding ISM in the corresponding volume:
 (4)
(4)
The total mass from the ISM swept up by this volume is estimated using the densities of the surrounding ISM, ρISM,
 (5)
(5)
where µH = 1.4 is the mean nucleus number per hydrogen atom, mH is the mass of the hydrogen atom, and nH is the hydrogen density in the ISM. The surrounding nH can be calculated assuming a relation between the particle density and the distance to the galactic plane z (following the same procedure as C2012, based on Spitzer 1978; Mihalas & Binney 1981; Loup et al. 1993),
 (6)
(6)
where z(pc) = d sin(b) + 15, d is the distance, and b the Galactic latitude. Assuming a gas-to-dust ratio in the ISM of 1000, we find that the amount of swept-up mass in the wind-ISM interaction regions is less than 1% of the observed mass.
Finally, if we assume that the stars have been losing mass at constant rates Ṁd and constant velocities v∞, we can calculate the time tIA it takes the stellar wind to build up the mass in the interaction region, and the crossing time tcross (the time it takes for the material in the stellar wind to reach the interaction region):
 (7)
(7)
 (8)
(8)
Table 3 shows the resulting build-up and crossing times. We note that both estimates are very uncertain because of uncertain present-day dust mass-loss rates Ṁpd,d (which are not well constrained in the SED models), and the assumption that the dust has (and retains) the same velocity as the gas (Sect. 3.2). The estimated crossing times and build-up times are therefore only upper limits. However, for most sources, tcross is significantly less than tIA (changes in the dust velocity would affect both to the same degree), and the dust particles remain in the wind-ISM interaction regions on timescales of a few 10000-100000 yr. The timescales are therefore consistent with the build up of the mass in the interaction region during AGB evolution. The average estimated gas density  is on the order of a few 1000 cm–3 (assuming purely atomic hydrogen and a gas-to-dust ratio of 1000), corresponding to the densities in regular CSEs at distances of a few thousand AU from the star. The densities are consistent with hydrodynamical models of interaction regions by Cox et al. (2012), and are consistent with or slightly higher than the densities predicted by Wareing et al. (2007) and Villaver et al. (2012). The derived densities are comparable to the number densities found in giant molecular clouds, dark clouds, and star forming clumps (103-105 cm–3), and are three to four orders of magnitude larger than the cold and warm ISM (e.g. Lequeux 2005).
It must be kept in mind that these estimates are based on over-simplifying assumptions. However, the estimates give an order-of-magnitude indication of the parameters determined, and indicate that the wind-ISM interaction regions contain significant amounts of dust and gas that is consistent with the build up dominated by material from the AGB stars. The mass resides in the shell for a significant period of time (several 10 000 yr to a few 100 000 yr) at relatively high densities and cold temperatures.
5.2 Constraints on Grain Sizes
Although comparatively high, the derived densities when taken at face value are likely not high enough and the timescales are too short to allow for significant further grain growth (requiring densities >105cm–3 and timescales of ∼105 yr; Ossenkopf & Henning 1994). However, submillimetre (submm) observations of thermal emission from the dust in detached shell sources indicate the presence of relatively large grains (0.1-2.0 µm) compared to what is generally assumed in the inner AGB wind (≈0.1-0.5 µm, e.g., Höfner 2008; Mattsson & Höfner 2011; Norris et al. 2012), indicating possible continued growth and processing of the dust grains in the wind-wind interaction. The densities in the shells are an order of magnitude larger than what is derived here, but the timescales are significantly shorter (a few 1000 yr) compared to the time the dust resides in the wind-ISM interaction. It is possible that increased densities in clumps caused by instabilities and/or increased densities in connection with the shock front allow grains to grow to larger sizes. Additionally, the models using agr = 0.1 µm generally do not reproduce the observed RFIR because the temperatures of the grains are too high (Sect. 4.1).
We therefore investigate the constraints that observations in the FIR can provide on the grain sizes, and whether different grain sizes can reproduce the observed RFIR. For a given grain type, the ratio between the fluxes at 70 and 160 µm depends on the grain size, as the ratio between the absorption at optical and NIR wavelengths and the emission in the FIR changes, effectively changing the grain temperature. We determine the FIR model flux ratios for the different grain sizes for each object, and compare the models to the observed ratios in the wind-ISM interaction regions using opacities for agr =0.01, 0.1, 0.25, 0.5, 0.75,1.0,2.0, and 5.0 µm for both amorphous carbon and silicate grains (Suh 1999, 2000).
Figure 3 shows the range of modelled RFIR for the different grain sizes for each source compared to the observed RFIRvalues, separated into C-rich and O-rich objects, as well as examples of the modelled RFIR vs. grain size for C-rich and O-rich objects, respectively. For the sources with amorphous carbon grains, the observed RFIR constrains the grain sizes for grains larger than ≈0.75-1.0 µm, while for smaller grains there is an ambiguity between sizes <0.25 µm on the one hand and 0.25-0.75 µm on the other (i.e. grains smaller than 0.25 µm and grains between 0.25 and 0.75 µm produce the same RFIR). For silicate grains, the ambiguity between small and larger grains is even larger.
For the carbon-rich AGB stars, the observed ratios indicate relatively large grains (≳1 µm). We note that we are only modelling grains of one constant size, while a distribution in grain sizes would be more realistic. However, given the observational information, such a distribution would be difficult to constrain. The effects of using different optical constants were investigated in the case of detached shells by Brunner et al. (2018). These authors do not find a significant difference between different optical constants. Taken at face value, our results indicate that a significant amount of dust must be present in relatively large grains in the wind-ISM interaction regions around the carbon AGB stars.
Although the uncertainties in the measured fluxes do not constrain the grain sizes for the C-rich objects very well, generally the models produce RFIR values within the observed range. For the models with silicate grains for O-rich stars, it is significantly more difficult to reproduce the observed RFIR. In half of the cases, the observed RFIR is a factor 1.5-2 lower than the smallest predicted ratio. In the remaining cases, the uncertainty in the observed RFIR is so large that the grain size cannot be constrained. This may partially be caused by poor measurements of the flux in the 160 µm images. However, comparing the observed values of RFIR to the modelled values, we systematically over-predict RFIR for models with silicate dust, while the ratios derived from models with amorphous carbon are comparable to those observed. Unless this is a coincidence, it is more likely that the reason for the discrepancy in the O-rich sources lies in the details of the dust modelling.
 |
Fig. 3 Modelled RFIR for different grain sizes. Top panel: observed values for RFIR for C-rich sources (red dots) and O-rich sources (blue squares) and their uncertainty ΔRFIR. The grey bars show the range of RFIR that the models produce for grain sizes between 0.01 and 5.0µm. Bottom panels: examples of the model RFIR vs. grain size for the carbon star UU Aur (left) and the O-rich star V1943 Sgr (right). The horizontal solid lines show the observed RFIR, the dashed horizontal lines indicate the uncertainty ΔRFIR. |
5.3 Assumptions in the Dust Modelling and their Effects on the Modelled RFIR
The factors that determine RFIR are the temperature of the grain and the slope (and value) of the opacities in the FIR. In addition to the ratio between absorption in the optical and NIR and emission in the FIR, the temperature of the grain is also affected by the shape of the SED (i.e. the incident light that the grain receives), in particular in the optical and NIR. However, the optical properties of the grains are not measured but are extrapolated at λ > 100 µm. Failing to reproduce the observed ratios in the FIR may therefore be due to unknown dust properties. A second issue is that we assume a stellar black body with a given luminosity and effective temperature in all our models. However, molecular and atomic absorption in the optical and NIR may significantly reduce the SED at short wavelengths compared to a plain black body.
In order to test the extent to which these different mechanisms affect the observed RFIR, we construct a test model with representative parameters for the observed sources and wind- ISM interaction regions (Table 4). Figure 4 shows model FIR ratios derived for our test model. The models are identical in their geometrical setup and density distribution, and are calculated using the standard silicate grains and amorphous carbon grains as used for all other sources. We additionally artificially changed the slope of the silicate grains to follow a λ–15 law instead of λ–2 at λ > 100 µm, the former being more similar to the amorphous carbon grains (corresponding to a direct change in dust properties). We also calculated models where we reduced the stellar black body to 25% at λ < 2 µm (corresponding to the molecular and atomic absorption in the atmosphere of the star). Both decreasing the stellar SED and changing the grain properties at long wavelengths would change the model RFIR to be consistent with observations.
Fanciullo et al. (2020) recently summarised lab measurements of opacities in the FIR of silicate dust grains. These authors found that, compared to the extrapolation from shorter wavelengths, the measured opacities have values that are larger by a factor of approximately ten. Significantly larger values of the opacity at FIR wavelengths would strongly affect the dust temperature, and hence RFIR. In order to test this, we increased the values of the opacities of our silicate dust at λ > 50 µm by a factor of ten, and again changed the slope of the opacities to follow a λ–15 law, making them similar to the grains in Fanciullo et al. (2020 and references therein). The result on RFIR is shown in Fig. 4 and has by far the strongest effect on the observed ratios. However, the grains summarised in Fanciullo et al. (2020) are representative of dust observed in the cold ISM. They are formed under much colder conditions (20-100 K) than is typical for AGB stars (where the dust forms at ∼1000K), and contain a mix of silicate and carbon dust. Whether these opacities are representative of the dust that is observed in the wind-ISM interaction regions is therefore unclear.
The silicate grains here include Fe, which affects the opacities at short wavelengths and hence the temperature of the grains. The composition of the dust around O-rich AGB stars is debated. Generally, grains that include Fe form too far from the star to accelerate the stellar wind, because they would be too warm to form in the acceleration region (however, they may still form further out in the wind). An alternative explanation for the driving of the stellar wind from O-rich AGB stars is the radiation pressure through scattering of photons off relatively large (≈0.5 µm) iron-free silicate grains (Höfner 2008). Such grains would decrease the temperature, making them more consistent with the observed RFIR.
Finally, Ysard et al. (2018) investigated the effect of different grain properties on the opacities for silicate, amorphous carbon, and hydrogenated carbon grains. Effects that they studied were porosity, shape (spherical vs. oblate), size, and aggregates, and combinations of these parameters. Depending on the parameters changed, and the different combinations, opacities can change significantly from the optical to the FIR, hence also likely affecting the temperature of the grains and the observed emission at different wavelengths.
The detailed properties of the grains are therefore very uncertain, and the derived values are strongly affected by a combination of our assumptions on the composition (e.g. Fe-free silicates), the stellar SEDs (to account for the absorption in the atmosphere at short wavelengths), the structure (spherical vs. oblate, porous, aggregates), and the sizes. The FIR observations here alone are not able to constrain the dust properties in the wind-ISM interaction regions around AGB stars. Additional spatially resolved spectroscopic and imaging observations in the optical and near- and FIR of dust towards the wind-ISM interaction regions, combined with direct observations of the stellar SED, are necessary to constrain the radiation field, grain composition, and grain structures.
While it is not possible to derive tight constraints on the grain properties based on the observations here, taking our results at face value it appears that the grains in the wind-ISM regions may be different from the grains in the CSEs around AGB stars. Generally, when explicitly modelling observations of the dust in winds around AGB stars, the same assumptions are often made as in this study: stellar black body, spherical solid grains, and one grain size. Since current observations do not provide sufficient spatial resolution to constrain the dust distribution from the inner to the outer CSE, the dust temperature is not well constrained, allowing for more freedom in the dust properties. Any effect described above that might affect the dust models in the wind- ISM interaction regions would also affect the models of dust in circumstellar winds. However, these effects might influence the two regions differently, and whether the discrepancy between the CSE and wind-ISM interaction region remains needs to be determined through further radiative transfer modelling.
Parameters for the test model.
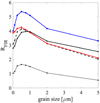 |
Fig. 4 Comparison of the RFIR for different grain sizes and different opacities: silicate grains (blue), amorphous carbon grains (red), silicate grains with λ–15 slope at λ > 100 µm (black-dashed), opacities that represent the opacities presented by (Fanciullo et al. 2020, black dotted), and models with silicate grains but with a modified stellar black body (black-solid). The models are calculated for the test model. See text for details). |
6 Conclusions
We investigated the FIR emission from wind-ISM interaction regions around AGB stars observed with the PACS 70 and 160 µm. We derived the temperatures and dust masses in the observed regions directly from the observed ratios between the two wavelengths (RFIR), as well as through explicit radiative transfer modelling of the observed structures, assuming amorphous carbon grains for C-rich AGB stars, and silicate grains for O-rich (M- and S-type) AGB stars.
When assuming grain sizes of agr = 0.1 µm, the models produce grains with relatively high temperatures and fail to reproduce the observed RFIR. For amorphous carbon grains models with agr ≳ 1 µm can explain the observed RFIR, indicating the presence of relatively large grains in the wind-ISM interaction regions. For O-rich and S-type AGB stars, the observed RFIR cannot be reproduced for most sources, irrespective of the grain size. In this case, it is likely that a combination of grain properties (composition, structure, and size) and the detailed stellar SED affect the temperatures of the grains. We discuss several possible mechanisms that could explain the discrepancies between modelled and observed RFIR for the O-rich sources: the slope in the opacities for silicate grains at λ > 100 µm; a reduction in the incident SED at λ < 2 µm as an effect of atomic and molecular absorption in the stellar atmosphere; the possibility of grains with the properties of cold interstellar grains at λ > 50 µm; possible contamination of the grains with Fe; and changes in the opacities owing to porosity, shape, size, and aggregates. It is not clear which of these mechanisms dominate, and in particular the implications for the grain properties affect our understanding of the dust that is released into the ISM. The derived dust masses in the wind-ISM interaction regions are consistent with the build up of dust through the stellar mass loss, with swept-up ISM dust only constituting ≈1% of the total observed dust mass. The indication of large grains is consistent with the findings of previous studies of the dust in detached shells, and indicates that dust particles from AGB stars continue to grow to significantly larger grains compared to what is derived for the inner AGB wind. However, the derived typical densities in the wind-ISM interaction regions do not seem to be high enough to allow for (obvious) grain growth, unless the interaction regions contain density enhancements with up to two orders of magnitude.
This has implications for the properties of particles that are released into the ISM, where the AGB dust acts as seed particles for continued grain growth in the ISM. Generally it is either assumed that the dust grains released into the ISM are unchanged from the original dust formed, or that they are sublimated by the interstellar radiation field and supernova shocks and do not contribute to the dust (growth) in the ISM at all. However, while we cannot conclusively constrain the dust properties, our results indicate that assumptions that are often made to model the dust in the inner CSE do not successfully reproduce the observations of wind-ISM interaction regions. There is additionally a tendency towards larger grains compared to what is generally assumed. This increases the chance of grain survival, and affects the role played by dust grains from AGB stars in forming the seeds for grain growth in the ISM. The detection of pre-solar grains from AGB stars is consistent with this picture.
While our models give rough estimates of the grain sizes and dust masses in the wind-interaction regions, and explicitly model the 3D structure of the regions, they are still very basic. In order to fully derive the conditions in the wind-ISM interaction regions, and the properties of the dust released into the ISM, it is necessary to obtain spatially resolved spectroscopic and imaging observations of the dust in order to determine the grain compositions and temperatures, as well as direct observations of the stellar SEDs. Full hydrodynamical models of the interaction regions designed to explicitly reproduce the observed cases are necessary to determine the physical parameters of the regions. Such investigations will be necessary to constrain models of grain growth and processing in the wind-ISM interaction regions in order to derive the detailed properties (size, composition, shape, porosity) of the grains released into the ISM.
Acknowledgements
M.M. acknowledges support from the Swedish Research Council under grant number 2016-03402. T.K. acknowledges support from the Swedish Research Council under grant number 2019-03777. E.D.B. acknowledges funding by the Swedish National Spaceboard.
Appendix A Models and Images for Sources that were Modelled
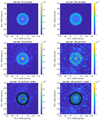 |
Fig. A.1 Observations and models for AQ And: Top to bottom: The Radmc3D model, the PACS image, and the PACS image with contours from the model. Images are for 70µm (left) and 160µm (right). Maximum contour levels are 0.4×10⁻³ Jy/″2(70µm) and 0.2×10⁻³ Jy/″2(160µm), respectively. Minimum contour levels are 10% of maximum. The colour scale is in Jy/″2. The red dashed circle shows the mask used to measure the flux from the star and present-day mass-loss. |
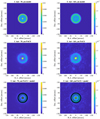 |
Fig. A.2 Observations and models for U Ant: Top to bottom: The Radmc3D model, the PACS image, and the PACS image with contours from the model. Images are for 70µm (left) and 160µm (right). Maximum contour levels are 7.6×10⁻³ Jy/″2(70µm) and 1.2×10⁻³ Jy/″2(160µm), respectively. Minimum contour levels are 10% of maximum. The colour scale is in Jy/″2. The red dashed circle shows the mask used to measure the flux from the star and present-day mass-loss. |
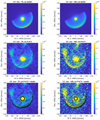 |
Fig. A.3 Observations and models for UU Aur: Top to bottom: The Radmc3D model, the PACS image, and the PACS image with contours from the model. Images are for 70µm (left) and 160µm (right). Maximum contour levels are 0.75×10⁻³ Jy/″2(70µm) and 0.2×10⁻³ Jy/″2(160µm), respectively. Minimum contour levels are 10% of maximum. The colour scale is in Jy/″2. The red dashed circle shows the mask used to measure the flux from the star and present-day mass-loss. |
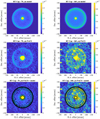 |
Fig. A.4 Observations and models for RT Cap: Top to bottom: The Radmc3D model, the PACS image, and the PACS image with contours from the model. Images are for 70µm (left) and 160µm (right). Maximum contour levels are 0.12×10⁻³ Jy/″2(70µm) and 0.056×10⁻³ Jy/″2(160µm), respectively. Minimum contour levels are 10% of maximum. The colour scale is in Jy/″2. The red dashed circle shows the mask used to measure the flux from the star and present-day mass-loss. |
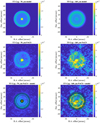 |
Fig. A.5 Observations and models for TT Cyg: Top to bottom: The Radmc3D model, the PACS image, and the PACS image with contours from the model. Images are for 70µm (left) and 160µm (right). Maximum contour levels are 2×10⁻³ Jy/″2(70µm) and 0.26×10⁻³ Jy/″2(160µm), respectively. Minimum contour levels are 10% of maximum. The colour scale is in Jy/″2. The red dashed circle shows the mask used to measure the flux from the star and present-day mass-loss. |
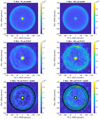 |
Fig. A.6 Observations and models for U Hya: Top to bottom: The Radmc3D model, the PACS image, and the PACS image with contours from the model. Images are for 70µm (left) and 160µm (right). Maximum contour levels are 1.3×10⁻³ Jy/″2(70µm) and 0.38×10⁻³ Jy/″2(160µm), respectively. Minimum contour levels are 10% of maximum. The colour scale is in Jy/″2. The red dashed circle shows the mask used to measure the flux from the star and present-day mass-loss. |
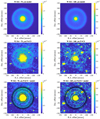 |
Fig. A.7 Observations and models for W Ori: Top to bottom: The Radmc3D model, the PACS image, and the PACS image with contours from the model. Images are for 70µm (left) and 160µm (right). Maximum contour levels are 0.066×10⁻³ Jy/″2(70µm) and 0.025×10⁻³ Jy/″2(160µm), respectively. Minimum contour levels are 10% of maximum. The colour scale is in Jy/″2. The red dashed circle shows the mask used to measure the flux from the star and present-day mass-loss. |
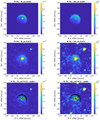 |
Fig. A.8 Observations and models for W Pic: Top to bottom: The Radmc3D model, the PACS image, and the PACS image with contours from the model. Images are for 70µm (left) and 160µm (right). Maximum contour levels are 0.68×10⁻³ Jy/″2(70µm) and 0.16×10⁻³ Jy/″2(160µm), respectively. Minimum contour levels are 10% of maximum. The colour scale is in Jy/″2. The red dashed circle shows the mask used to measure the flux from the star and present-day mass-loss. |
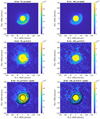 |
Fig. A.9 Observations and models for R Scl: Top to bottom: The Radmc3D model, the PACS image, and the PACS image with contours from the model. Images are for 70µm (left) and 160µm (right). Maximum contour levels are 0.7×10⁻³ Jy/″2(70µm) and 0.2×10⁻³ Jy/″2(160µm), respectively. Minimum contour levels are 10% of maximum. The colour scale is in Jy/″2. The red dashed circle shows the mask used to measure the flux from the star and present-day mass-loss. |
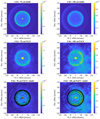 |
Fig. A.10 Observations and models for S Sct: Top to bottom: The Radmc3D model, the PACS image, and the PACS image with contours from the model. Images are for 70µm (left) and 160µm (right). Maximum contour levels are 1×10⁻³ Jy/″2(70µm) and 0.35×10⁻³ Jy/″2(160µm), respectively. Minimum contour levels are 10% of maximum. The colour scale is in Jy/″2. The red dashed circle shows the mask used to measure the flux from the star and present-day mass-loss. |
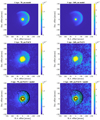 |
Fig. A.11 Observations and models for θ Aps: Top to bottom: The Radmc3D model, the PACS image, and the PACS image with contours from the model. Images are for 70µm (left) and 160µm (right). Maximum contour levels are 1.4×10⁻³ Jy/″2(70µm) and 0.19×10⁻³ Jy/″2(160µm), respectively. Minimum contour levels are 10% of maximum. The colour scale is in Jy/″2. The red dashed circle shows the mask used to measure the flux from the star and present-day mass-loss. |
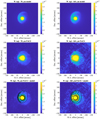 |
Fig. A.12 Observations and models for W Aql: Top to bottom: The Radmc3D model, the PACS image, and the PACS image with contours from the model. Images are for 70µm (left) and 160µm (right). Maximum contour levels are 1.8×10⁻³ Jy/″2(70µm) and 0.44×10⁻³ Jy/″2(160µm), respectively. Minimum contour levels are 10% of maximum. The colour scale is in Jy/″2. The red dashed circle shows the mask used to measure the flux from the star and present-day mass-loss. |
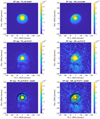 |
Fig. A.13 Observations and models for EP Aqr: Top to bottom: The Radmc3D model, the PACS image, and the PACS image with contours from the model. Images are for 70µm (left) and 160µm (right). Maximum contour levels are 3.5×10⁻³ Jy/″2(70µm) and 0.44×10⁻³ Jy/″2(160µm), respectively. Minimum contour levels are 10% of maximum. The colour scale is in Jy/″2. The red dashed circle shows the mask used to measure the flux from the star and present-day mass-loss. |
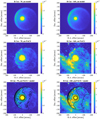 |
Fig. A.14 Observations and models for R Cas: Top to bottom: The Radmc3D model, the PACS image, and the PACS image with contours from the model. Images are for 70µm (left) and 160µm (right). Maximum contour levels are 1.2×10⁻³ Jy/″2(70µm) and 0.3×10⁻³ Jy/″2(160µm), respectively. Minimum contour levels are 10% of maximum. The colour scale is in Jy/″2. The red dashed circle shows the mask used to measure the flux from the star and present-day mass-loss. |
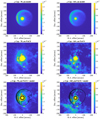 |
Fig. A.15 Observations and models for µ Cep: Top to bottom: The Radmc3D model, the PACS image, and the PACS image with contours from the model. Images are for 70µm (left) and 160µm (right). Maximum contour levels are 3×10⁻³ Jy/″2(70µm) and 0.58×10⁻³ Jy/″2(160µm), respectively. Minimum contour levels are 10% of maximum. The colour scale is in Jy/″2. The red dashed circle shows the mask used to measure the flux from the star and present-day mass-loss. |
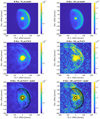 |
Fig. A.16 Observations and models for R Hya: Top to bottom: The Radmc3D model, the PACS image, and the PACS image with contours from the model. Images are for 70µm (left) and 160µm (right). Maximum contour levels are 1.1×10⁻³ Jy/″2(70µm) and 0.17×10⁻³ Jy/″2(160µm), respectively. Minimum contour levels are 10% of maximum. The colour scale is in Jy/″2. The red dashed circle shows the mask used to measure the flux from the star and present-day mass-loss. |
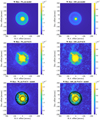 |
Fig. A.17 Observations and models for W Hya: Top to bottom: The Radmc3D model, the PACS image, and the PACS image with contours from the model. Images are for 70µm (left) and 160µm (right). Maximum contour levels are 3×10⁻³ Jy/″2(70µm) and 0.35×10⁻³ Jy/″2(160µm), respectively. Minimum contour levels are 10% of maximum. The colour scale is in Jy/″2. The red dashed circle shows the mask used to measure the flux from the star and present-day mass-loss. |
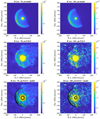 |
Fig. A.18 Observations and models for R Leo: Top to bottom: The Radmc3D model, the PACS image, and the PACS image with contours from the model. Images are for 70µm (left) and 160µm (right). Maximum contour levels are 1.1×10⁻³ Jy/″2(70µm) and 0.2×10⁻³ Jy/″2(160µm), respectively. Minimum contour levels are 10% of maximum. The colour scale is in Jy/″2. The red dashed circle shows the mask used to measure the flux from the star and present-day mass-loss. |
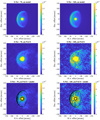 |
Fig. A.19 Observations and models for X Pav: Top to bottom: The Radmc3D model, the PACS image, and the PACS image with contours from the model. Images are for 70µm (left) and 160µm (right). Maximum contour levels are 2.2×10⁻³ Jy/″2(70µm) and 0.34×10⁻³ Jy/″2(160µm), respectively. Minimum contour levels are 10% of maximum. The colour scale is in Jy/″2. The red dashed circle shows the mask used to measure the flux from the star and present-day mass-loss. |
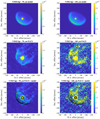 |
Fig. A.20 Observations and models for V1943 Sgr: Top to bottom: The Radmc3D model, the PACS image, and the PACS image with contours from the model. Images are for 70µm (left) and 160µm (right). Maximum contour levels are 1.2×10⁻³ Jy/″2(70µm) and 0.19×10⁻³ Jy/″2(160µm), respectively. Minimum contour levels are 10% of maximum. The colour scale is in Jy/″2. The red dashed circle shows the mask used to measure the flux from the star and present-day mass-loss. |
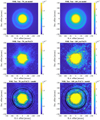 |
Fig. A.21 Observations and models for NML Tau: Top to bottom: The Radmc3D model, the PACS image, and the PACS image with contours from the model. Images are for 70µm (left) and 160µm (right). Maximum contour levels are 0.6×10⁻³ Jy/″2(70µm) and 0.2×10⁻³ Jy/″2(160µm), respectively. Minimum contour levels are 10% of maximum. The colour scale is in Jy/″2. The red dashed circle shows the mask used to measure the flux from the star and present-day mass-loss. |
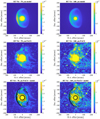 |
Fig. A.22 Observations and models for RT Vir: Top to bottom: The Radmc3D model, the PACS image, and the PACS image with contours from the model. Images are for 70µm (left) and 160µm (right). Maximum contour levels are 0.4×10⁻³ Jy/″2(70µm) and 0.1×10⁻³ Jy/″2(160µm), respectively. Minimum contour levels are 10% of maximum. The colour scale is in Jy/″2. The red dashed circle shows the mask used to measure the flux from the star and present-day mass-loss. |
Appendix B PACS Images of Sources that were Not Modelled
 |
Fig. B.1 Observations of U Cam: PACS images at 70µm (left) and 160µm (right). The colour scale is in Jy/″2. The red dashed circle shows the mask used to measure the flux from the star and present-day mass-loss. |
 |
Fig. B.2 Observations of S Cep: PACS images at 70µm (left) and 160µm (right). The colour scale is in Jy/″2. The red dashed circle shows the mask used to measure the flux from the star and present-day mass-loss. |
 |
Fig. B.3 Observations of Y CVn: PACS images at 70 µm (left) and 160 µm (right). The colour scale is in Jy/″2. The red dashed circle shows the mask used to measure the flux from the star and present-day mass-loss. |
 |
Fig. B.4 Observations of CW Leo: PACS images at 70µm (left) and 160µm (right). The colour scale is in Jy/″2. The red dashed circle shows the mask used to measure the flux from the star and present-day mass-loss. |
 |
Fig. B.5 Observations of TX Psc: PACS images at 70 µm (left) and 160µm (right). The colour scale is in Jy/″2. The red dashed circle shows the mask used to measure the flux from the star and present-day mass-loss. |
 |
Fig. B.6 Observations of X TrA: PACS images at 70µm (left) and 160µm (right). The colour scale is in Jy/″2. The red dashed circle shows the mask used to measure the flux from the star and present-day mass-loss. |
 |
Fig. B.7 Observations of S Cas: PACS images at 70 µm (left) and 160µm (right). The colour scale is in Jy/″2. The red dashed circle shows the mask used to measure the flux from the star and present-day mass-loss. |
 |
Fig. B.8 Observations of o Cet: PACS images at 70µm (left) and 160µm (right). The colour scale is in Jy/″2. The red dashed circle shows the mask used to measure the flux from the star and present-day mass-loss. |
 |
Fig. B.9 Observations of x Cyg: PACS images at 70µm (left) and 160µm (right). The colour scale is in Jy/″2. The red dashed circle shows the mask used to measure the flux from the star and present-day mass-loss. |
 |
Fig. B.10 Observations of X Her: PACS images at 70µm (left) and 160µm (right). The colour scale is in Jy/″2. The red dashed circle shows the mask used to measure the flux from the star and present-day mass-loss. |
 |
Fig. B.11 Observations of T Mic: PACS images at 70µm (left) and 160µm (right). The colour scale is in Jy/″2. The red dashed circle shows the mask used to measure the flux from the star and present-day mass-loss. |
 |
Fig. B.12 Observations of α Ori: PACS images at 70µm (left) and 160µm (right). The colour scale is in Jy/″2. The red dashed circle shows the mask used to measure the flux from the star and present-day mass-loss. |
References
- Bocchio, M., Marassi, S., Schneider, R., et al. 2016, A&A, 587, A157 [NASA ADS] [CrossRef] [EDP Sciences] [Google Scholar]
- Brunner, M., Maercker, M., Mecina, M., Khouri, T., & Kerschbaum, F. 2018, A&A, 614, A17 [NASA ADS] [CrossRef] [EDP Sciences] [Google Scholar]
- Cox, N. L. J., Kerschbaum, F., van Marle, A.-J., et al. 2012, A&A, 537, A35 [NASA ADS] [CrossRef] [EDP Sciences] [Google Scholar]
- de Vries, B. L., Min, M., Waters, L. B. F. M., Blommaert, J. A. D. L., & Kemper, F. 2010, A&A, 516, A86 [NASA ADS] [CrossRef] [EDP Sciences] [Google Scholar]
- Draine, B. T. 2009, ASP Conf. Ser., 414, 453 [Google Scholar]
- Dullemond, C. P. 2012, Astrophysics Source Code Library [record ascl:1202.015] [Google Scholar]
- Fanciullo, L., Kemper, F., Scicluna, P., Dharmawardena, T. E., & Srinivasan, S. 2020, MNRAS, 499, 4666 [NASA ADS] [CrossRef] [Google Scholar]
- Ferrara, A., Viti, S., & Ceccarelli, C. 2016, MNRAS, 463, L112 [NASA ADS] [CrossRef] [Google Scholar]
- Ferrarotti, A. S., & Gail, H.-P. 2006, A&A, 447, 553 [CrossRef] [EDP Sciences] [Google Scholar]
- Ginolfi, M., Graziani, L., Schneider, R., et al. 2018, MNRAS, 473, 4538 [NASA ADS] [CrossRef] [Google Scholar]
- Groenewegen, M. A. T., Sloan, G. C., Soszynski, I., & Petersen, E. A. 2009, A&A, 506, 1277 [NASA ADS] [CrossRef] [EDP Sciences] [Google Scholar]
- Groenewegen, M. A. T., Waelkens, C., Barlow, M. J., et al. 2011, A&A, 526, A162 [NASA ADS] [CrossRef] [EDP Sciences] [Google Scholar]
- Heck, P. R., Greer, J., Kööp, L., et al. 2020, PNAS, 117, 1884 [NASA ADS] [CrossRef] [Google Scholar]
- Höfner, S. 2008, A&A, 491, L1 [NASA ADS] [CrossRef] [EDP Sciences] [Google Scholar]
- Höfner, S., & Olofsson, H. 2018, A&ARv, 26, 1 [Google Scholar]
- Inoue, A. K. 2011, Earth, Planets, and Space, 63, 1027 [NASA ADS] [CrossRef] [Google Scholar]
- Khouri, T., Maercker, M., Waters, L. B. F. M., et al. 2016, A&A, 591, A70 [NASA ADS] [CrossRef] [EDP Sciences] [Google Scholar]
- Khouri, T., Vlemmings, W. H. T., Paladini, C., et al. 2020, A&A, 635, A200 [NASA ADS] [CrossRef] [EDP Sciences] [Google Scholar]
- Ladjal, D., Justtanont, K., Groenewegen, M. A. T., et al. 2010, A&A, 513, A53 [NASA ADS] [CrossRef] [EDP Sciences] [Google Scholar]
- Lequeux, J. 2005, The Interstellar Medium, Astronomy and astrophysics library (Berlin: Springer) (Translation from the French language edition of: Le Milieu Interstellaire by James Lequeux, EDP Sciences, 2003) [CrossRef] [Google Scholar]
- Li, A., & Draine, B. T. 2001, ApJ, 554, 778 [Google Scholar]
- Libert, Y., Gérard, E., & Le Bertre, T. 2007, MNRAS, 380, 1161 [Google Scholar]
- Loup, C., Forveille, T., Omont, A., & Paul, J. F. 1993, A&AS, 99, 291 [NASA ADS] [Google Scholar]
- Maercker, M., Olofsson, H., Eriksson, K., Gustafsson, B., & Schöier, F. L. 2010, A&A, 511, A37 [NASA ADS] [CrossRef] [EDP Sciences] [Google Scholar]
- Maercker, M., Khouri, T., De Beck, E., et al. 2018, A&A, 620, A106 [NASA ADS] [CrossRef] [EDP Sciences] [Google Scholar]
- Mattsson, L., & Höfner, S. 2011, A&A, 533, A42 [NASA ADS] [CrossRef] [EDP Sciences] [Google Scholar]
- Mattsson, L., Höfner, S., & Herwig, F. 2007, A&A, 470, 339 [NASA ADS] [CrossRef] [EDP Sciences] [Google Scholar]
- Michałowski, M. J., Watson, D., & Hjorth, J. 2010, ApJ, 712, 942 [CrossRef] [Google Scholar]
- Mihalas, D., & Binney, J. 1981, Galactic astronomy. Structure and Kinematics (San Francisco: Freeman) [Google Scholar]
- Norris, B. R. M., Tuthill, P. G., Ireland, M. J., et al. 2012, Nature, 484, 220 [NASA ADS] [CrossRef] [Google Scholar]
- Olofsson, H., Maercker, M., Eriksson, K., Gustafsson, B., & Schöier, F. 2010, A&A, 515, A27 [NASA ADS] [CrossRef] [EDP Sciences] [Google Scholar]
- Ossenkopf, V., & Henning, T. 1994, A&A, 291, 943 [NASA ADS] [Google Scholar]
- Pilbratt, G. L., Riedinger, J. R., Passvogel, T., et al. 2010, A&A, 518, L1 [NASA ADS] [CrossRef] [EDP Sciences] [Google Scholar]
- Poglitsch, A., Waelkens, C., Geis, N., et al. 2010, A&A, 518, L2 [NASA ADS] [CrossRef] [EDP Sciences] [Google Scholar]
- Ramstedt, S., Schöier, F. L., Olofsson, H., & Lundgren, A. A. 2008, A&A, 487, 645 [NASA ADS] [CrossRef] [EDP Sciences] [Google Scholar]
- Ramstedt, S., Schöier, F. L., & Olofsson, H. 2009, A&A, 499, 515 [NASA ADS] [CrossRef] [EDP Sciences] [Google Scholar]
- Sandin, C., & Höfner, S. 2003, A&A, 404, 789 [NASA ADS] [CrossRef] [EDP Sciences] [Google Scholar]
- Sandin, C., & Mattsson, L. 2020, MNRAS, 499, 1531 [NASA ADS] [CrossRef] [Google Scholar]
- Schneider, R., Valiante, R., Ventura, P., et al. 2014, MNRAS, 442, 1440 [NASA ADS] [CrossRef] [Google Scholar]
- Schöier, F. L., Lindqvist, M., & Olofsson, H. 2005, A&A, 436, 633 [NASA ADS] [CrossRef] [EDP Sciences] [Google Scholar]
- Spitzer, L., Jr. 1978, JRASC, 72, 349 [NASA ADS] [Google Scholar]
- Steffen, M., & Schönberner, D. 2000, A&A, 357, 180 [NASA ADS] [Google Scholar]
- Suh, K.-W. 1999, MNRAS, 304, 389 [NASA ADS] [CrossRef] [Google Scholar]
- Suh, K.-W. 2000, MNRAS, 315, 740 [NASA ADS] [CrossRef] [Google Scholar]
- Villaver, E., Manchado, A., & García-Segura, G. 2012, ApJ, 748, 94 [NASA ADS] [CrossRef] [Google Scholar]
- Wareing, C. J., Zijlstra, A. A., & O’Brien, T. J. 2007, MNRAS, 382, 1233 [NASA ADS] [CrossRef] [Google Scholar]
- Wilkin, F. P. 1996, ApJ, 459, L31 [Google Scholar]
- Woitke, P. 2006, A&A, 460, L9 [NASA ADS] [CrossRef] [EDP Sciences] [Google Scholar]
- Ysard, N., Jones, A. P., Demyk, K., Boutéraon, T., & Koehler, M. 2018, A&A, 617, A124 [NASA ADS] [CrossRef] [EDP Sciences] [Google Scholar]
- Zhukovska, S., Dobbs, C., Jenkins, E. B., & Klessen, R. S. 2016, ApJ, 831, 147 [NASA ADS] [CrossRef] [Google Scholar]
All Tables
Estimated masses and temperatures in the wind-ISM interaction regions based on the measured fluxes in the PACS 70 and 160 µm images and assuming agr = 0.1 µm.
Basic stellar and present-day wind parameters used as input in the modelling of the wind-ISM interaction regions.
Results from the radiative transfer modelling with RADMC-3D assuming agr = 0.1 µm.
All Figures
 |
Fig. 1 Parameters of the ellipse shape describing the wind-ISM interaction regions: R0 (stand-off distance), Rp (the distance perpendicular to R0), and θ (the angle to the apex of the bow shock). The star is assumed to move towards the right relative to the ISM. The black dashed line shows the shape of the wilkinoid for the same stand-off distance (see text for details). |
| In the text | |
 |
Fig. 2 Ratios between dust temperatures and dust masses obtained through two different methods using 0.1 µm grains: full radiative transfer ( |
| In the text | |
 |
Fig. 3 Modelled RFIR for different grain sizes. Top panel: observed values for RFIR for C-rich sources (red dots) and O-rich sources (blue squares) and their uncertainty ΔRFIR. The grey bars show the range of RFIR that the models produce for grain sizes between 0.01 and 5.0µm. Bottom panels: examples of the model RFIR vs. grain size for the carbon star UU Aur (left) and the O-rich star V1943 Sgr (right). The horizontal solid lines show the observed RFIR, the dashed horizontal lines indicate the uncertainty ΔRFIR. |
| In the text | |
 |
Fig. 4 Comparison of the RFIR for different grain sizes and different opacities: silicate grains (blue), amorphous carbon grains (red), silicate grains with λ–15 slope at λ > 100 µm (black-dashed), opacities that represent the opacities presented by (Fanciullo et al. 2020, black dotted), and models with silicate grains but with a modified stellar black body (black-solid). The models are calculated for the test model. See text for details). |
| In the text | |
 |
Fig. A.1 Observations and models for AQ And: Top to bottom: The Radmc3D model, the PACS image, and the PACS image with contours from the model. Images are for 70µm (left) and 160µm (right). Maximum contour levels are 0.4×10⁻³ Jy/″2(70µm) and 0.2×10⁻³ Jy/″2(160µm), respectively. Minimum contour levels are 10% of maximum. The colour scale is in Jy/″2. The red dashed circle shows the mask used to measure the flux from the star and present-day mass-loss. |
| In the text | |
 |
Fig. A.2 Observations and models for U Ant: Top to bottom: The Radmc3D model, the PACS image, and the PACS image with contours from the model. Images are for 70µm (left) and 160µm (right). Maximum contour levels are 7.6×10⁻³ Jy/″2(70µm) and 1.2×10⁻³ Jy/″2(160µm), respectively. Minimum contour levels are 10% of maximum. The colour scale is in Jy/″2. The red dashed circle shows the mask used to measure the flux from the star and present-day mass-loss. |
| In the text | |
 |
Fig. A.3 Observations and models for UU Aur: Top to bottom: The Radmc3D model, the PACS image, and the PACS image with contours from the model. Images are for 70µm (left) and 160µm (right). Maximum contour levels are 0.75×10⁻³ Jy/″2(70µm) and 0.2×10⁻³ Jy/″2(160µm), respectively. Minimum contour levels are 10% of maximum. The colour scale is in Jy/″2. The red dashed circle shows the mask used to measure the flux from the star and present-day mass-loss. |
| In the text | |
 |
Fig. A.4 Observations and models for RT Cap: Top to bottom: The Radmc3D model, the PACS image, and the PACS image with contours from the model. Images are for 70µm (left) and 160µm (right). Maximum contour levels are 0.12×10⁻³ Jy/″2(70µm) and 0.056×10⁻³ Jy/″2(160µm), respectively. Minimum contour levels are 10% of maximum. The colour scale is in Jy/″2. The red dashed circle shows the mask used to measure the flux from the star and present-day mass-loss. |
| In the text | |
 |
Fig. A.5 Observations and models for TT Cyg: Top to bottom: The Radmc3D model, the PACS image, and the PACS image with contours from the model. Images are for 70µm (left) and 160µm (right). Maximum contour levels are 2×10⁻³ Jy/″2(70µm) and 0.26×10⁻³ Jy/″2(160µm), respectively. Minimum contour levels are 10% of maximum. The colour scale is in Jy/″2. The red dashed circle shows the mask used to measure the flux from the star and present-day mass-loss. |
| In the text | |
 |
Fig. A.6 Observations and models for U Hya: Top to bottom: The Radmc3D model, the PACS image, and the PACS image with contours from the model. Images are for 70µm (left) and 160µm (right). Maximum contour levels are 1.3×10⁻³ Jy/″2(70µm) and 0.38×10⁻³ Jy/″2(160µm), respectively. Minimum contour levels are 10% of maximum. The colour scale is in Jy/″2. The red dashed circle shows the mask used to measure the flux from the star and present-day mass-loss. |
| In the text | |
 |
Fig. A.7 Observations and models for W Ori: Top to bottom: The Radmc3D model, the PACS image, and the PACS image with contours from the model. Images are for 70µm (left) and 160µm (right). Maximum contour levels are 0.066×10⁻³ Jy/″2(70µm) and 0.025×10⁻³ Jy/″2(160µm), respectively. Minimum contour levels are 10% of maximum. The colour scale is in Jy/″2. The red dashed circle shows the mask used to measure the flux from the star and present-day mass-loss. |
| In the text | |
 |
Fig. A.8 Observations and models for W Pic: Top to bottom: The Radmc3D model, the PACS image, and the PACS image with contours from the model. Images are for 70µm (left) and 160µm (right). Maximum contour levels are 0.68×10⁻³ Jy/″2(70µm) and 0.16×10⁻³ Jy/″2(160µm), respectively. Minimum contour levels are 10% of maximum. The colour scale is in Jy/″2. The red dashed circle shows the mask used to measure the flux from the star and present-day mass-loss. |
| In the text | |
 |
Fig. A.9 Observations and models for R Scl: Top to bottom: The Radmc3D model, the PACS image, and the PACS image with contours from the model. Images are for 70µm (left) and 160µm (right). Maximum contour levels are 0.7×10⁻³ Jy/″2(70µm) and 0.2×10⁻³ Jy/″2(160µm), respectively. Minimum contour levels are 10% of maximum. The colour scale is in Jy/″2. The red dashed circle shows the mask used to measure the flux from the star and present-day mass-loss. |
| In the text | |
 |
Fig. A.10 Observations and models for S Sct: Top to bottom: The Radmc3D model, the PACS image, and the PACS image with contours from the model. Images are for 70µm (left) and 160µm (right). Maximum contour levels are 1×10⁻³ Jy/″2(70µm) and 0.35×10⁻³ Jy/″2(160µm), respectively. Minimum contour levels are 10% of maximum. The colour scale is in Jy/″2. The red dashed circle shows the mask used to measure the flux from the star and present-day mass-loss. |
| In the text | |
 |
Fig. A.11 Observations and models for θ Aps: Top to bottom: The Radmc3D model, the PACS image, and the PACS image with contours from the model. Images are for 70µm (left) and 160µm (right). Maximum contour levels are 1.4×10⁻³ Jy/″2(70µm) and 0.19×10⁻³ Jy/″2(160µm), respectively. Minimum contour levels are 10% of maximum. The colour scale is in Jy/″2. The red dashed circle shows the mask used to measure the flux from the star and present-day mass-loss. |
| In the text | |
 |
Fig. A.12 Observations and models for W Aql: Top to bottom: The Radmc3D model, the PACS image, and the PACS image with contours from the model. Images are for 70µm (left) and 160µm (right). Maximum contour levels are 1.8×10⁻³ Jy/″2(70µm) and 0.44×10⁻³ Jy/″2(160µm), respectively. Minimum contour levels are 10% of maximum. The colour scale is in Jy/″2. The red dashed circle shows the mask used to measure the flux from the star and present-day mass-loss. |
| In the text | |
 |
Fig. A.13 Observations and models for EP Aqr: Top to bottom: The Radmc3D model, the PACS image, and the PACS image with contours from the model. Images are for 70µm (left) and 160µm (right). Maximum contour levels are 3.5×10⁻³ Jy/″2(70µm) and 0.44×10⁻³ Jy/″2(160µm), respectively. Minimum contour levels are 10% of maximum. The colour scale is in Jy/″2. The red dashed circle shows the mask used to measure the flux from the star and present-day mass-loss. |
| In the text | |
 |
Fig. A.14 Observations and models for R Cas: Top to bottom: The Radmc3D model, the PACS image, and the PACS image with contours from the model. Images are for 70µm (left) and 160µm (right). Maximum contour levels are 1.2×10⁻³ Jy/″2(70µm) and 0.3×10⁻³ Jy/″2(160µm), respectively. Minimum contour levels are 10% of maximum. The colour scale is in Jy/″2. The red dashed circle shows the mask used to measure the flux from the star and present-day mass-loss. |
| In the text | |
 |
Fig. A.15 Observations and models for µ Cep: Top to bottom: The Radmc3D model, the PACS image, and the PACS image with contours from the model. Images are for 70µm (left) and 160µm (right). Maximum contour levels are 3×10⁻³ Jy/″2(70µm) and 0.58×10⁻³ Jy/″2(160µm), respectively. Minimum contour levels are 10% of maximum. The colour scale is in Jy/″2. The red dashed circle shows the mask used to measure the flux from the star and present-day mass-loss. |
| In the text | |
 |
Fig. A.16 Observations and models for R Hya: Top to bottom: The Radmc3D model, the PACS image, and the PACS image with contours from the model. Images are for 70µm (left) and 160µm (right). Maximum contour levels are 1.1×10⁻³ Jy/″2(70µm) and 0.17×10⁻³ Jy/″2(160µm), respectively. Minimum contour levels are 10% of maximum. The colour scale is in Jy/″2. The red dashed circle shows the mask used to measure the flux from the star and present-day mass-loss. |
| In the text | |
 |
Fig. A.17 Observations and models for W Hya: Top to bottom: The Radmc3D model, the PACS image, and the PACS image with contours from the model. Images are for 70µm (left) and 160µm (right). Maximum contour levels are 3×10⁻³ Jy/″2(70µm) and 0.35×10⁻³ Jy/″2(160µm), respectively. Minimum contour levels are 10% of maximum. The colour scale is in Jy/″2. The red dashed circle shows the mask used to measure the flux from the star and present-day mass-loss. |
| In the text | |
 |
Fig. A.18 Observations and models for R Leo: Top to bottom: The Radmc3D model, the PACS image, and the PACS image with contours from the model. Images are for 70µm (left) and 160µm (right). Maximum contour levels are 1.1×10⁻³ Jy/″2(70µm) and 0.2×10⁻³ Jy/″2(160µm), respectively. Minimum contour levels are 10% of maximum. The colour scale is in Jy/″2. The red dashed circle shows the mask used to measure the flux from the star and present-day mass-loss. |
| In the text | |
 |
Fig. A.19 Observations and models for X Pav: Top to bottom: The Radmc3D model, the PACS image, and the PACS image with contours from the model. Images are for 70µm (left) and 160µm (right). Maximum contour levels are 2.2×10⁻³ Jy/″2(70µm) and 0.34×10⁻³ Jy/″2(160µm), respectively. Minimum contour levels are 10% of maximum. The colour scale is in Jy/″2. The red dashed circle shows the mask used to measure the flux from the star and present-day mass-loss. |
| In the text | |
 |
Fig. A.20 Observations and models for V1943 Sgr: Top to bottom: The Radmc3D model, the PACS image, and the PACS image with contours from the model. Images are for 70µm (left) and 160µm (right). Maximum contour levels are 1.2×10⁻³ Jy/″2(70µm) and 0.19×10⁻³ Jy/″2(160µm), respectively. Minimum contour levels are 10% of maximum. The colour scale is in Jy/″2. The red dashed circle shows the mask used to measure the flux from the star and present-day mass-loss. |
| In the text | |
 |
Fig. A.21 Observations and models for NML Tau: Top to bottom: The Radmc3D model, the PACS image, and the PACS image with contours from the model. Images are for 70µm (left) and 160µm (right). Maximum contour levels are 0.6×10⁻³ Jy/″2(70µm) and 0.2×10⁻³ Jy/″2(160µm), respectively. Minimum contour levels are 10% of maximum. The colour scale is in Jy/″2. The red dashed circle shows the mask used to measure the flux from the star and present-day mass-loss. |
| In the text | |
 |
Fig. A.22 Observations and models for RT Vir: Top to bottom: The Radmc3D model, the PACS image, and the PACS image with contours from the model. Images are for 70µm (left) and 160µm (right). Maximum contour levels are 0.4×10⁻³ Jy/″2(70µm) and 0.1×10⁻³ Jy/″2(160µm), respectively. Minimum contour levels are 10% of maximum. The colour scale is in Jy/″2. The red dashed circle shows the mask used to measure the flux from the star and present-day mass-loss. |
| In the text | |
 |
Fig. B.1 Observations of U Cam: PACS images at 70µm (left) and 160µm (right). The colour scale is in Jy/″2. The red dashed circle shows the mask used to measure the flux from the star and present-day mass-loss. |
| In the text | |
 |
Fig. B.2 Observations of S Cep: PACS images at 70µm (left) and 160µm (right). The colour scale is in Jy/″2. The red dashed circle shows the mask used to measure the flux from the star and present-day mass-loss. |
| In the text | |
 |
Fig. B.3 Observations of Y CVn: PACS images at 70 µm (left) and 160 µm (right). The colour scale is in Jy/″2. The red dashed circle shows the mask used to measure the flux from the star and present-day mass-loss. |
| In the text | |
 |
Fig. B.4 Observations of CW Leo: PACS images at 70µm (left) and 160µm (right). The colour scale is in Jy/″2. The red dashed circle shows the mask used to measure the flux from the star and present-day mass-loss. |
| In the text | |
 |
Fig. B.5 Observations of TX Psc: PACS images at 70 µm (left) and 160µm (right). The colour scale is in Jy/″2. The red dashed circle shows the mask used to measure the flux from the star and present-day mass-loss. |
| In the text | |
 |
Fig. B.6 Observations of X TrA: PACS images at 70µm (left) and 160µm (right). The colour scale is in Jy/″2. The red dashed circle shows the mask used to measure the flux from the star and present-day mass-loss. |
| In the text | |
 |
Fig. B.7 Observations of S Cas: PACS images at 70 µm (left) and 160µm (right). The colour scale is in Jy/″2. The red dashed circle shows the mask used to measure the flux from the star and present-day mass-loss. |
| In the text | |
 |
Fig. B.8 Observations of o Cet: PACS images at 70µm (left) and 160µm (right). The colour scale is in Jy/″2. The red dashed circle shows the mask used to measure the flux from the star and present-day mass-loss. |
| In the text | |
 |
Fig. B.9 Observations of x Cyg: PACS images at 70µm (left) and 160µm (right). The colour scale is in Jy/″2. The red dashed circle shows the mask used to measure the flux from the star and present-day mass-loss. |
| In the text | |
 |
Fig. B.10 Observations of X Her: PACS images at 70µm (left) and 160µm (right). The colour scale is in Jy/″2. The red dashed circle shows the mask used to measure the flux from the star and present-day mass-loss. |
| In the text | |
 |
Fig. B.11 Observations of T Mic: PACS images at 70µm (left) and 160µm (right). The colour scale is in Jy/″2. The red dashed circle shows the mask used to measure the flux from the star and present-day mass-loss. |
| In the text | |
 |
Fig. B.12 Observations of α Ori: PACS images at 70µm (left) and 160µm (right). The colour scale is in Jy/″2. The red dashed circle shows the mask used to measure the flux from the star and present-day mass-loss. |
| In the text | |
Current usage metrics show cumulative count of Article Views (full-text article views including HTML views, PDF and ePub downloads, according to the available data) and Abstracts Views on Vision4Press platform.
Data correspond to usage on the plateform after 2015. The current usage metrics is available 48-96 hours after online publication and is updated daily on week days.
Initial download of the metrics may take a while.


