Fig. 3
Download original image
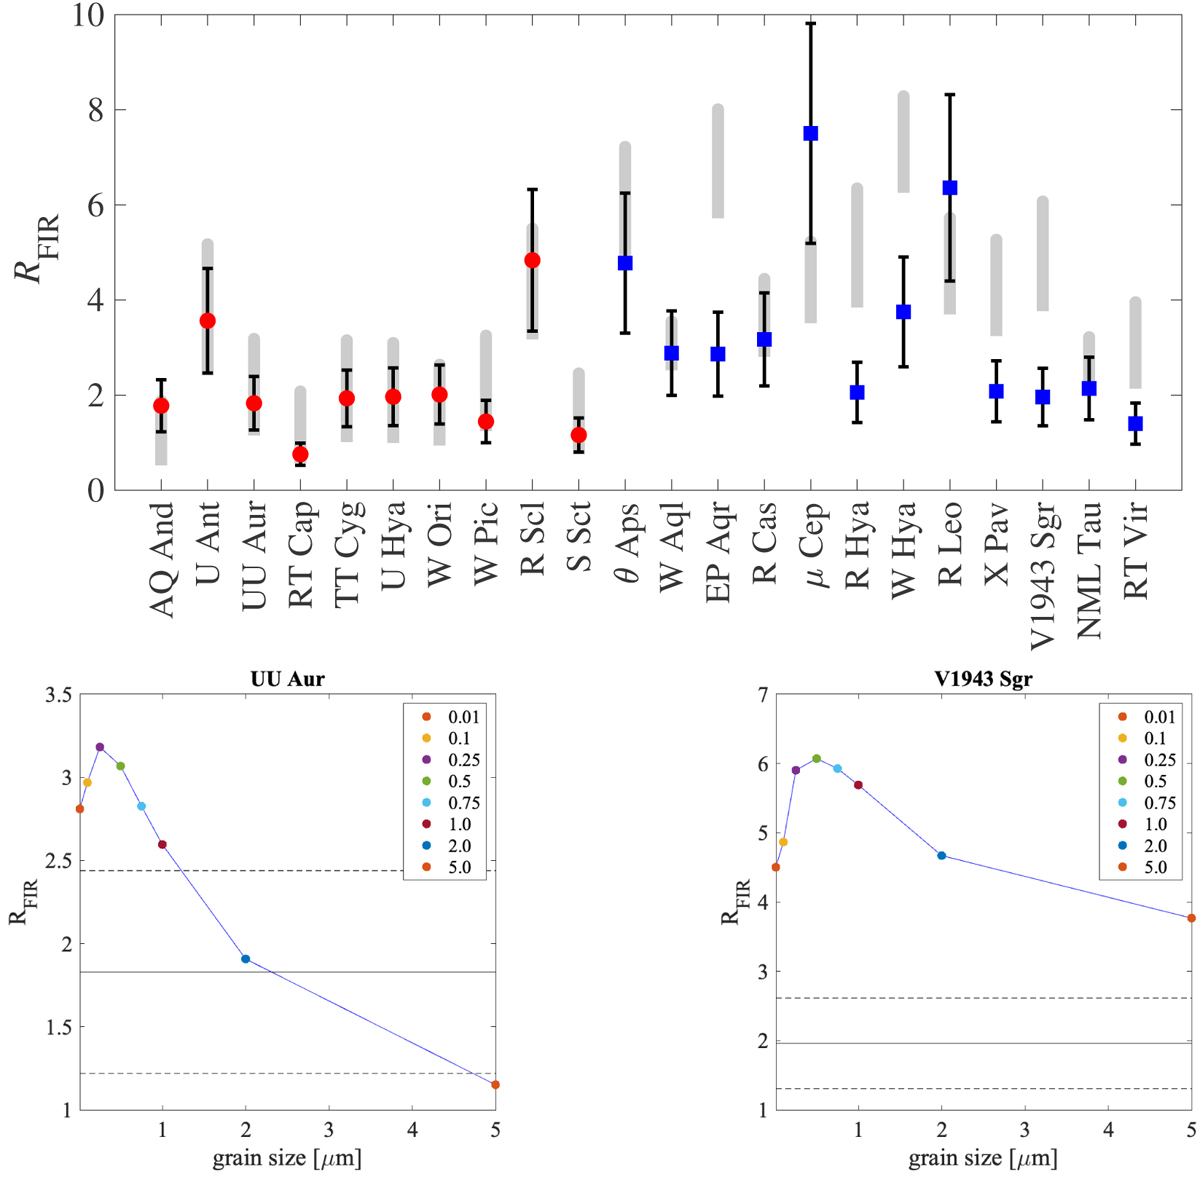
Modelled RFIR for different grain sizes. Top panel: observed values for RFIR for C-rich sources (red dots) and O-rich sources (blue squares) and their uncertainty ΔRFIR. The grey bars show the range of RFIR that the models produce for grain sizes between 0.01 and 5.0µm. Bottom panels: examples of the model RFIR vs. grain size for the carbon star UU Aur (left) and the O-rich star V1943 Sgr (right). The horizontal solid lines show the observed RFIR, the dashed horizontal lines indicate the uncertainty ΔRFIR.
Current usage metrics show cumulative count of Article Views (full-text article views including HTML views, PDF and ePub downloads, according to the available data) and Abstracts Views on Vision4Press platform.
Data correspond to usage on the plateform after 2015. The current usage metrics is available 48-96 hours after online publication and is updated daily on week days.
Initial download of the metrics may take a while.