| Issue |
A&A
Volume 684, April 2024
|
|
|---|---|---|
| Article Number | A163 | |
| Number of page(s) | 8 | |
| Section | Interstellar and circumstellar matter | |
| DOI | https://doi.org/10.1051/0004-6361/202348024 | |
| Published online | 24 April 2024 | |
Dust survival in harsh environments
Investigating the relevance of photo-evaporation process
1
National Centre for Nuclear Research,
ul. Pasteura 7,
02-093
Warsaw,
Poland
e-mail: This email address is being protected from spambots. You need JavaScript enabled to view it.
2
INAF – Osservatorio astronomico d’Abruzzo,
Via Maggini SNC,
64100
Teramo,
Italy
3
INFN – Sezione di Perugia,
Via A. Pascoli SNC,
06123
Perugia,
Italy
4
SISSA,
Via Bonomea 265,
Trieste,
Italy
5
IFPU – Institute for fundamental physics of the Universe,
Via Beirut 2,
34014
Trieste,
Italy
6
Astronomical Observatory Institute, Faculty of Physics, Adam Mickiewicz University,
ul. Słoneczna 36,
60-286
Poznań,
Poland
7
INAF – Osservatorio Astronomico di Padova,
Vicolo dell’Osservatorio 5,
35122
Padova,
Italy
Received:
19
September
2023
Accepted:
24
December
2023
Abstract
Aims. We investigate the role of photo-evaporation of dust that is exposed to the radiation field of hot young stars and planetary nebulae (PNe) as a possible destruction mechanism of dust grains in the interstellar medium (ISM).
Methods. We estimated photo-evaporation induced by the feedback of individual or clustered young stars, of PNe, and in the presence of a variable radiation field that scales with the interstellar radiation field. For PNe, we investigated the dust photo-evaporation of dust grains already present in the ISM and of those formed in the last phases of the evolution of thermally pulsing asymptotic giant branch (TP-AGB) stars. We included dust photo-evaporation rate in models of dust evolution in galaxies for different assumptions of the dust growth scenario, the dust-to-gas ratios, the star formation histories, and the initial mass functions of the stars.
Results. For all the cases we considered, we found that both photo-evaporation from young stars and from PNe is negligible with respect to other dust-removal processes such as destruction from supernova shocks, astration, and possibly outflow. Grains are stable against photo-evaporation when they are exposed to a radiation field that is up to 107 times the interstellar radiation field.
Conclusions. Dust grains of size ≥0.01 µm are not efficiently destroyed either by photo-evaporation in the presence of a strong radiation field.
Key words: dust, extinction / evolution / galaxies: evolution / galaxies: ISM
© The Authors 2024
 Open Access article, published by EDP Sciences, under the terms of the Creative Commons Attribution License (https://creativecommons.org/licenses/by/4.0), which permits unrestricted use, distribution, and reproduction in any medium, provided the original work is properly cited.
This article is published in open access under the Subscribe to Open model. This email address is being protected from spambots. You need JavaScript enabled to view it. to support open access publication.
1 Introduction
The formation and survival of dust grains in galaxies have paramount implications for many astrophysical processes. Dust grains contribute to the formation of different molecules in space, and to gas cooling through which the formation of stars is promoted (e.g. Cuppen et al. 2017). Dust absorbs light mostly in the ultraviolet (UV) and visible wavelength and re-emits this energy in the infrared. Therefore, the physical quantities derived from the spectral energy distribution (SED) fitting, such as the star formation rate (SFR), must take the effect of dust into account. Despite the significance of the dust formation, destruction, and survival in the interstellar medium (ISM), these mechanisms remain controversial.
UV photons impinging on dust grains remove electrons from the grain surfaces and heat the gas. Through this process, grains become positively charged (Weingartner & Draine 2001b). Photo-evaporation of dust grains is suggested to be relevant for the life-cycle of polycyclic aromatic hydrocarbons (PAHs, Demyk 2011). The ISM may indeed be enriched by small molecules from the photo-evaporation of PAHs, while in photo-dissociation regions, PAHs may be created when UV photons and/or shock waves break down carbon grains (Cesarsky et al. 2000; Berné et al. 2007). Nevertheless, the role of dust photo-evaporation as a possible efficient destruction mechanism of dust grains in the ISM has not been equally well explored so far. Dust grains undergo photo-evaporation due to the intense radiation field in galaxies with high SFRs. In simulations of dust evolution in galaxies, the role of this mechanism in relation to other processes, such as astration and supernova (SN) shocks and large-scale galactic outflows, has not yet been thoroughly assessed, however. In low-metallicity galaxies and in the early Universe, where stars are typically hotter than at solarlike metallicity and where the formation of massive stars with intense radiation fields may be favoured (Marks et al. 2012), photo-evaporation may be relevant.
Recent observational studies showed that the specific mass of dust (sMdust=Mdust/M★, where Mdust and M★ are the masses of dust and of stars, respectively) rises quickly at young ages and then decreases with age. Different classes of galaxies showed evidence of this trend: massive and dwarf star-forming galaxies in the local Universe (De Vis et al. 2019; Nanni et al. 2020; Galliano et al. 2021; Casasola et al. 2022), dusty galaxies and Lyman-break galaxies identified at very high redshifts (2 < z < 6, Burgarella et al. 2020, 2022; Donevski et al. 2020; Kokorev et al. 2021), and quiescent but dusty galaxies at low and intermediate redshifts (Gobat et al. 2018; Michałowski et al. 2019; Donevski et al. 2023; Leśniewska et al. 2023). The core of the correlation between the sΛfdust and the specific star formation rate (sSFR = SFR/M★) is thought to be an age-evolutionary sequence.
From a theoretical viewpoint, various models tracking the dust, gas, and metal content of galaxies that include recipes for dust formation, grain growth, and destruction, and large scale inflows and outflows of material, are able to reproduce the observed decline of sMdust with sSFR (Li et al. 2019; Pantoni et al. 2019; De Vis et al. 2019; Nanni et al. 2020; Galliano et al. 2021; Burgarella et al. 2022). The majority of models find strong outflows driven by stellar feedback and SN explosions to explain the decline of sMdust with age. Predicted outflow efficiencies (ML = Ṁ/SFR, where M represents the mass outflow rate) are up to 80. In contrast to what simulations predict, recent observational works on both local and high-z sources (e.g. Ginolfi et al. 2020; Romano et al. 2023; Salak et al. 2024) found a typical value of ML ≈ 1. Using a novel spectral selection, Donevski et al. (2023) examined quiescent galaxies that showed no signs of energetic feedback from embedded active galactic nuclei. A significant scatter follows an anti-correlation between sMdust and age, suggesting distinct dust removal pathways over a range of timescales. Dust destruction from feedback from Type Ia SNe (Li et al. 2020), planetary nebulae (PNe; Leśniewska et al. 2023), or heating from winds of thermally pulsing asymptotic giant branch (TP-AGB) stars have also been proposed to explain the observed decline of sMdust with age in quiescent galaxies (Conroy et al. 2015).
This all motivates us to re-examine under which conditions dust can survive in galaxies and which processes are dominant in producing the observed anti-correlation of sMdust and stellar age. Along with usually considered dust removal processes in the ISM such as SN shocks, astration, and outflow, we additionally probe whether photo-evaporation due to the intense radiation input from massive stars and PNe can be an efficient destruction process for dust grains.
2 Method: Dust evolution model
In this work, we investigate the efficiency of dust photo-evaporation by including this process in calculations that follow dust evolution in the ISM of galaxies. We did not consider all the details of dust condensation and destruction during the process of star formation or PNe, but only the effect of radiation feedback from stars already on their main sequence, that is, in HII regions, or in the PN phase.
2.1 General framework
In order to modelthe gas and dust evolution in the ISM ofgalax-ies, we first computed the chemical gas enrichment from stars by adopting the one-zone chemical evolution code OMEGA (Côté et al. 2017; Ritter et al. 2018, One-zone Model for the Evolution of GAlaxies), which includes population III stars (Heger & Woosley 2010), Type II (Limongi & Chieffi 2018; Prantzos et al. 2018) and Type Ia supernovae (SNe, Iwamoto et al. 1999), and TP-AGB stars (Cristallo et al. 2015). We therefore computed the evolution of the gas mass Mgas, of the mass of each metal species, Mgas,i, and the mass of the dust species, j, either silicates (olivine and pyroxene) or carbon, Mdust,j, similarly to other works in the literature (e.g. Dwek 1998; Calura et al. 2008; Asano et al. 2013; Ginolfi et al. 2018; De Vis et al. 2019; Nanni et al. 2020; Galliano et al. 2021).
When only inflow was neglected, we obtained the evolution of the total mass of gas as
 (1)
(1)
where the last term takes the mass of metals locked into dust grains into account.
For each gas species, i, the evolution of its mass reads
 (2)
(2)
where the first two terms of each equation were computed by OMEGA, to which we refer for all the details. The first term represents the gas return from the stellar population (SP). The initial mass function (IMF) of the stars was assumed to be constant with time. The integral was performed between the minimum (ML = 0.08 M⊙) and the maximum (MU = 120 M⊙) mass of stars. The IMF was normalised in such a way that
 (3)
(3)
We tested two different IMFs: the Chabrier IMF (Chabrier 2003), and a top-heavy IMF of the form
 (4)
(4)
with α = 1.35. This IMF favours the formation of massive stars and can impact the efficiency of the destruction processes involved.
The second term of the Eqs. (1) and (2) is the astration of gas and metals due to the formation of stars, and the last term is gas removal from the ISM operated by outflows. The last term of Eq. (2) represents the metal depletion from the gas phase into dust grains, where ni is the number of atoms of the element i in the monomer of the dust species j, and mi and mdust,j are the atomic mass of the element i and the mass of the dust monomer j, respectively.
The evolution of dust grains of species j was computed as
 (5)
(5)
The first term of the equation represents the dust enrichment, where the dust yields were approximated by making use of the metal yields,
 (6)
(6)
where ƒkey,j is the fraction of the key element1 locked into dust grains, nkey,j is the number of atoms of the key element in one monomer of dust, and  is the gas mass injection rate of the key element from the SP. We assumed ƒkey,olivine = 0.3, fkey,pyroxene = 0.3, fkey,carbon = 0·5, and ,fkey,iron = 0·01 for TP-AGB stars, and fkey ,olivine = 0, fkey,pyroxene = 0·5, fkey, carbon = 0·5, and ƒkey,iron = 0·5 for SNe (Nanni et al. 2020). The quantity mkey,j is the atomic mass of the key element. The second term in Eq. (5) represents dust astration due to star formation. The term
  is the dust destruction from SN shocks. We added the terms
  , corresponding to photo-evaporation due to young stars and PNe, respectively. The destruction term in PNe includes both the dust destroyed in the ISM
 and the in situ dust
  ,
,
 (7)
(7)
Similarly to Eqs. (1) and (2), the dust removal from the outflow was parametrised through the mass-loading factor. The last term is the dust growth that occurs in the ISM.
We adopted the commonly used delayed star-formation history (SFH) for the galaxy,
 (8)
(8)
where τ = 10, 1000 Myr are representative of a rapid burst of star formation and of a more continuous star formation, respectively. The SFH was normalised in such a way that M★ = 1 M⊙ after 13 Gyr. However, we checked that the same type of normalisation at different final ages of the galaxy did not change the results.
2.2 Dust destruction by SN shocks
The dust destruction operated by SN shocks was modelled as in many works in the literature, for instance Dwek (1998). The destruction timescale is given by
 (9)
(9)
where Mgas evolves according to Eq. (1), RSN is the SN rate, and Mswept is the mass of gas that is swept up for each SN event. We assumed Mswept = 1200 M⊙ (Dwek et al. 2007). The destruction rate of dust is therefore
 (10)
(10)
2.3 Dust photo-evaporation
The stellar parameters of individual stars were calculated with the FUNS code (Straniero et al. 2006; Cristallo et al. 2009, 2011, 2015). Surface luminosities and temperatures were extracted when 10% of the central hydrogen had burnt. We considered a metallicity of Z = 0·0001 plus an enrichment of α-elements (0.7 dex for oxygen, and 0.4 dex for the other α-elements) and stellar masses between 0.08 and 120 M⊙. However, we verified that by increasing the upper limit of the stellar mass to 300 M⊙, the results were not significantly changed. The low metallicity and stellar evolutionary phase allow for the maximum possible effective temperatures and therefore the strongest possible dust photo-evaporation. At each distance from the star, we computed the dust equilibrium temperature Tj for each dust species j, either carbon or silicate,
 (11)
(11)
where κabs,j(v) is the mass absorption coefficient of the dust species j in cm2 g−1 as a function of the frequency, B(ν)(Teff) and B(v)(Tj) is the blackbody emission at the effective temperature of the star and of the dust temperature, respectively, and W(r) is the dilution factor of radiation with distance from the star, r, which for stars of radius R* reads
![Mathematical equation: $W(r) = {1 \over 2}\left[ {1 - \sqrt {1 - {{\left( {{{{R_*}} \over r}} \right)}^2}} } \right].$](/articles/aa/full_html/2024/04/aa48024-23/aa48024-23-eq17.png) (12)
(12)
Stars are seldom born isolated. Therefore, we considered the more realistic case of stars in stellar clusters. We assumed for the radiation field the field we obtained from a simple stellar population (SSP) computed for a single burst of star formation with Z = 0·0001 and both the Chabrier and top-heavy IMF by means of the code PÉGASE.3 (Fioc & Rocca-Volmerange 2019) with a lower and upper limit of 0.08 and 120 M⊙, respectively. We adopted the stellar population based on the Padova tracks (Bressan et al. 1993; Fagotto et al. 1994a,b,c; Girardi et al. 1996). For stars with Teff < 50 000 K the theoretical spectra are taken from the BaSeL library v3.1 (Kurucz 1979; Westera et al. 2002). For hotter stars the spectra are from Rauch (2003). We considered a zero-age SSP that provided the maximum of the photo-evaporation efficiency, and an upper limit for the star cluster mass of 105 M⊙ (Portegies Zwart et al. 2010). In this case, Eq. (11) becomes
 (13)
(13)
where L(ν)SSP is the spectrum of the SSP.
The mass absorption coefficients in Eqs. (11) and (13) for the main populations of silicate and carbon were computed by starting from their optical properties of Laor & Draine (1993) for astronomical silicate and graphite in the wavelength range from 0.001–1000 µm, which covers the entire emission spectrum of young stars and PNe2. We adopted the same size distribution as Weingartner & Draine (2001a); Draine & Li (2007). We did not consider the PAH evolution in our treatment since they usually represent a minor component in terms of the total dust mass in the ISM. For this reason, we excluded the contribution of small grains of size given by Eq. (2) of Weingartner & Draine (2001a) from the grain size distribution of carbon.
We computed the variation in the dust size with time due to evaporation of dust heated by starlight  in analogy to Eq. (3) of Kobayashi et al. (2011) and adopting the data in their Table 1,
 (14)
(14)
where ρj and Lj are the mass density and the latent heat of sublimation of the jth dust species, Aj is its mean molecular weight, P0 is the saturated vapour pressure, k is the Boltzmann constant, and mH is the hydrogen mass. We also conservatively adopted the same data for olivine to compute the evaporation of pyroxene. Olivine is predicted to evaporate at a temperature lower than that of pyroxene. As a consequence, our choice maximises the evaporation efficiency of silicates.
Small grains evaporate quicker than large ones. In order to determine an upper limit of dust photo-evaporation, we therefore assumed that carbon and silicate grains formed with a typical size of aj = 0.01 µm, which is about one order of magnitude smaller than the peak of the distribution found by Weingartner & Draine (2001a) for the Milky Way, which was adopted in Draine & Li (2007).
We defined the dust temperature for which the grains are stable against photo-evaporation as the temperature at which the time needed for evaporation for a grain of size aj = 0.01 µm is greater than or equal to a critical age, agecrit, which we set equal to the age at which the galaxy has built its entire stellar mass, agecrit = 13 Gyr,
 (15)
(15)
We obtained Tcarbon ≈ 1330 K for carbon dust and Tsilicate ≈ 877 K for silicates.
The distance from the source at which the equilibrium temperature equals this sublimation temperature (Eqs. (11) and (13)) is the dust sublimation radius, Rsubl,j.
In case of individual stars (ISs) or PNe, at each time step, the mass of dust that is destroyed in the volume of a shell with a thickness equal to  is
is
 (16)
(16)
For stars in the ISM, ρgas is either the gas density in the region of star formation or in the region where the PN resides. For young stars, we set as density that of a molecular cloud ρgas = 105mHµ, where µ is the mean molecular weight µ = 1.37. This high value of the density is typical of star-forming clumps and cores (Draine 2011). The contribution of the destruction by each isolated star was weighted over the IMF (which was normalised as in Eq. (3)),
 (17)
(17)
For the calculation of the dust destroyed by a single PN in the ISM, we used Eq. (16) and assumed ρgas = 50mHµ, a value typical of the cold atomic medium (Ferrière 2001), which is the upper limit of the density of the medium in which PNe are expected to reside. The quantity Mdust,J·/Mgas is the dust-to-gas ratio in the ISM, calculated from Eqs. (1) and (5).
Planetary nebulae are complex objects, however, in which the central hot white dwarf is surrounded by dust and gas at a higher density than that of the cold atomic medium. Dust is produced during the TP-AGB phase when the star loses mass at high rates (up to a few 10−5 M⊙ yr−1). To compute the dust destruction in situ for PNe, we assumed ρgas = 104mHµ (e.g. Stanghellini et al. 2012) and an upper limit of the total dust-to-gas ratio of 0.01 (Stasińska & Szczerba 1999). We assumed that for each of the dust species considered (olivine, pyroxene, and carbon), Mdust,j/Mgas was equal to one-third of the total value.
When stars are born in clusters, we assumed that the radiation came from a point source. In this case, the mass of destroyed dust is the mass in a sphere with a radius  ,
,
 (18)
(18)
where ρgas was assumed to be the same as in the case of individual stars (ρgas = 105mHµ).
The final dust destruction operated by star formation was therefore computed given the SFR as a function of time,
 (19)
(19)
The photo-evaporation rate induced by PNe was instead calculated as
 (20)
(20)
where dnTP–AGB/dt is the birth rate of TP-AGB stars that end their evolution as PNe, which was extracted from the code OMEGA. We assumed an effective temperature for all the PNe of Teff = 2 × 10⁵ K and a luminosity L = 4 × 10⁴ L⊙, which are upper limit values for PNe with an initial mass of 6 M⊙ (see FRUITY database3, Cristallo et al. 2015).
2.4 Dust growth in the ISM
The dust destruction processes included in our calculations depends on the dust-to-gas ratio as a function of time. This quantity varies when dust growth in the ISM is included. We therefore analysed two extreme cases: (1) no dust growth in the ISM, and (2) fully efficient dust growth in the ISM. The variation in the mass of dust due to growth is expressed as
 (21)
(21)
where daj/dt is the variation in the dust size due to the addition of atoms and molecules on the grain surface and was computed following Nanni et al. (2020), and ns,j is the number of seed nuclei computed by dividing the mass of each dust species by the mass of one dust grain (Asano et al. 2013). For this calculation, we implicitly assumed that all the grains in the ISM can potentially act as seed nuclei.
3 Results
3.1 A simple case
In order to give a sense of how much dust is destroyed for each solar mass of stars formed and for each PN, we performed some simple calculations by considering a single value for the dust-to-gas ratio of 0.01 in the ISM (Bohlin et al. 1978). As the sublimation radius of dust in Eqs. (16)–(18), we adopted the radius of silicates, Rsubl,silicate because this is larger than the radius of carbonaceous grains.
3.1.1 Dust photo-evaporation by isolated young stars
Based on Eq. (17), we first estimate how much dust was destroyed per M⊙ of stars formed with the IMF distributed according to the Chabrier or top-heavy functions and normalised as in Eq. (3). For this test, we assumed stars to be formed in isolation. We obtained the fraction of ≈7.3 × 10⁻⁹ and ≈6.5 × 10⁻⁸ of destroyed dust, where the stars were distributed according to the Chabrier and top-heavy IMF, respectively.
3.1.2 Dust photo-evaporation by stars in clusters
From Eq. (18), we found that the dust mass fraction destroyed per solar mass of stars formed in a cluster is ≈9.8 × 10⁻⁸ and ≈1.4 × 10⁻⁶, where stars are distributed according to the Chabrier and top-heavy IMF, respectively. In the case of the top-heavy IMF, this estimate is larger than the one found for isolated stars, while the two values are comparable for the Chabrier IMF. The difference with the case of isolated stars may be due to the diverse estimates of flux impinging on the grain surface in Eqs. (11) and (13), and of the total volume that is cleared of dust in Eqs. (16) and (18).
The sublimation radius for the different dust species is Rsubi,silicate ≈ 4 × 10⁻² pc and Rsubl,carbon ≈ 6 × 10⁻³ pc in the case of a Chabrier IMF, and Rsubi,silicate ≈ 1 × 10⁻¹ pc and Rsubi,carbon ≈ 1 × 10⁻² pc in the case of the top-heavy IMF. These values suggest that dust is destroyed by photo-evaporation in the immediate vicinity of the cluster, given that a typical radius of an HII region is a few parsec (Draine 2011).
3.1.3 Dust photo-evaporation by PNe
We estimate from Eq. (16) that the amount of dust that is destroyed in the ISM for each PN is ≈2.4 × 10⁻¹¹ M⊙.
We obtain that the mass of dust that is destroyed in situ by photo-evaporation is ≈4.9 × 10⁻⁹ M⊙. This value is negligible compared to the dust yields produced throughout the entire duration of the TP-AGB phase (e.g. Zhukovska et al. 2008; Ventura et al. 2012; Nanni et al. 2013) and compared to the dust mass inferred from observations, which is ≈10−4 M⊙ (Stasińska & Szczerba 1999; Dell’Agli et al. 2023). Recently, Dell’Agli et al. (2023) have found that the amount of dust that can be destroyed by PN feedback is ≈60%. Therefore, an alternative mechanism different from photo-evaporation may be at work. For the case of clusters, photo-evaporation is efficient in the vicinity of the source. We found Rsubl,silicate ≈ 7 × 10⁻⁴ pc, and Rsubl,carbon ≈ 9 × 10⁻⁵ pc.
3.2 Dust exposed to an external radiation field
Dust in the ISM and in the outer part of the cirmcumstellar envelopes of TP-AGB stars is exposed to a background radiation field. We assessed whether photo-evaporation may be relevant when dust is exposed to an external radiation field, as is often assumed in the literature (e.g. Draine & Li 2007). In this approach, the radiation field is parametrised as U × ISRF, where U is a scaling that can be up to Umax = 107, and the ISRF is interstellar radiation field from Mathis et al. (1983). For this maximum value of the scaling factor, we obtain from Eq. (11) (by substituting B(ν)(Teff) with the ISRF flux by Mathis et al. 1983) an equilibrium temperature for silicate dust of Tsilicate ≈ 154 K and of Tcarbon ≈ 245 K for carbon. These values are well below the sublimation temperatures derived in Sect. 2.3, and therefore, both silicate and carbon dust grains are stable against evaporation.
3.3 Including dust destruction in dust evolutionary models
We included dust photo-evaporation by considering the case of young stars born in clusters and PNe, following the description provided in Sect. 2. In Fig. 1, we show the overall evolution of sMdust in the ISM (upper panel), and we compare the efficiency of different dust-depleting mechanisms by plotting the integrated amount of the specific mass of dust that is destroyed or removed as a function of time, sMdestr = Mdestr/M* (middle and lower panels). In other words, we integrated in time each of the destruction mechanisms corresponding to terms two to six in Eq. (5), and we divided by the stellar mass4. We ran a reference model by assuming Mgas,ini = 4 M*,fin (where Mgas,ini and M*,fin are the initial mass of gas and the final stellar mass, respectively), τ = 1000 Myr in Eq. (8), MSwept = 1200 M⊙, a Chabrier IMF, and a typical value of the mass-loading factor ML = 1. With this assumption for ML, astration and outflow provide the same contribution to dust removal. We considered the cases with and without dust growth in the ISM, and we varied Mgas,ini, τ, and the IMF.
Figure 1 demonstrates that destruction from photo-evaporation is lower by some orders of magnitude than SN shock destruction, dust astration, and outflow removal. This is true both with and without dust growth in the ISM. The difference in the destruction efficiency for the two cases is minor. Only the model in which dust growth is not included shows a decline in sMdust as a function of time, mainly due to dust destruction from Type II SNe. This trend agrees qualitatively well with the trend observed in the literature, but a number of observable parameters such as metallicity and gas fraction, in addition to the specific mass of dust, should be reproduced consistently by models before some firm conclusions can be drawn.
In Fig. 2, we show the same model as in Fig. 1 (magenta lines) together with a model of gas-rich galaxies with Mgas,ini = 20 × M*,fin. In the middle and lower panels show that in this latter case, the efficiency of the various removal processes is reduced because the values of Mdust,j/Mgas are lower (see Eqs. (9), (10), and (16)). Photo-evaporation remains negligible with respect to the other processes. The plot shows that for gas-rich systems with high Mgas/M★, the predicted sMdust does not show a decline as in the case with a lower Mgas/M★.
In Fig. 3, we show the same model as in the previous plots (magenta lines) together with a model computed by assuming τ = 10 Myr in Eq. (8), representing the case of a very short burst of star formation. In this latter case, the decline in the sMdust with time occurs at earlier times than in the case with τ = 1000 Myr because of the fast production of stars that explode as Type II SN, and it is followed by an increase in the dust content due to the remaining contribution of Type II SNe, TP-AGB stars, and Type Ia SNe. This trend, showing a decline followed by an increase in the dust mass, seems to be at odds with the observed trend, but is obtained for the specific choice of parameters (e.g. Mgas,ini/M★,fin) in addition to the SFH.
In Fig. 4, we show the effect of assuming a different IMF (either Chabrier 2003 or a top-heavy IMF). A top-heavy IMF may be typical of low-metallicity environments (e.g. Marks et al. 2012). In the upper panel, the model with the top-heavy IMF shows a more rapid decline with time than the Chabrier case due to the efficient destruction by Type II SNe, which are more numerous than for the Chabrier IMF. The dust produced by the top-heavy model encompasses the dust in which the Chabrier IMF is employed. Because of the higher sMdust, the destruction mechanisms are more efficient than in the Chabrier case. Photo-evaporation remains negligible in both cases. For both models, the trend we found agrees qualitatively well with the observations.
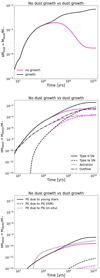 |
Fig. 1 Specific mass of dust produced and/or destroyed as a function of time. Upper panel: overall evolution of dust computed as the enrichment from stars minus the dust removal from different mechanisms. We show cases with and without dust growth in the ISM. The initial mass of the gas is equal to four times the final mass of stars, Mgas,ini = 4 × M*,fin and τ = 1000 Myr in Eq. (8). Middle and lower panels: Dust removal due to different mechanisms included in the models in the upper panel, as mentioned in the legend, where “PE” stands for “photo-evaporation”. |
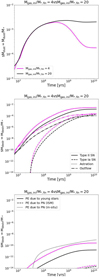 |
Fig. 2 Specific mass of dust produced and/or destroyed as a function of time. Upper panel: overall evolution of dust computed as the enrichment from stars minus the dust removal from different mechanisms. Two cases with different initial gas masses, Mgas,ini = 4 × M*,fin and Mgas,ini = 20 × M*,fin, are compared. We selected τ = 1000 Myr in Eq. (8) and did not include dust growth in the ISM. Middle and lower panels: dust removal due to different mechanisms included in the models in the upper panel, similar to Fig. 1. |
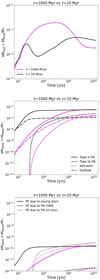 |
Fig. 3 Specific mass of dust produced and/or destroyed as a function of time. Upper panel: overall evolution of dust computed as the enrichment from stars minus the dust removal from different mechanisms. Two cases with different values of τ = 10,1000 Myr in Eq. (8) are shown. Mgas,ini = 4 × M*,fin. Middle and lower panels: dust removal due to different mechanisms corresponding to the models in the upper panel, similar to Fig. 1. |
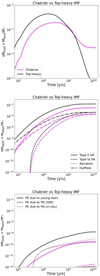 |
Fig. 4 Specific mass of dust produced and/or destroyed as a function of time. Upper panel: overall evolution of dust computed as the enrichment from stars minus the dust removal from different mechanisms. Two cases with different choices of the IMF are shown. We selected Mgas,ini = 4 × M*,fin, τ = 1000 Myr in Eq. (8) and did not include dust growth in the ISM. Middle and lower panels: dust removal due to different mechanisms corresponding to the models in the upper panel, similar to Fig. 1. |
4 Conclusions
We found that photo-evaporation due to young stars and PNe only plays a minor role in dust destruction, independently of the assumed efficiency of dust growth in the ISM, the initial mass of gas, the SFH, and the IMF. We do not exclude the possibility of dust being destroyed by shocks generated by fast winds in HII regions and PNe, however. The investigation of these processes is beyond the scope of this work. The dust exposed to an interstellar radiation field U× ISRF is stable against sublimation up to the highest value assumed in the literature Umax = 107 (Draine & Li 2007). These findings also imply that the total yields from TP-AGB stars are not normally destroyed by photo-evaporation induced by the ambient radiation field or when the PN phase is reached.
The observed trend with increasing sMdust at early times followed by a decrease is qualitatively well reproduced for low values of Mgas/M★ found in passive galaxies, while for higher values of sMdust representative of systems with a large gas fraction (e.g. DGS), the observed trend is difficult to reproduce when the outflow is not extremely efficient (see also Nanni et al. 2020).
It is worth noting that observationally, we are able to probe a specific dust mass above 10−4 at each redshift. Therefore, at these values we do not expect photo-evaporation to be a relevant dust destruction process even with a low metallicity and intense radiation field.
Acknowledgements
A.N., M.R., P.S. acknowledge support from the Narodowe Centrum Nauki (NCN), Poland, through the SONATA BIS grant UMO-2020/38/E/ST9/00077. S.C. acknowledges funding by the European Union – NextGenerationEU RFF M4C2 1.1 PRIN 2022 project “2022RJLWHN URKA” and by INAF Theory Grant "Understanding R-process & Kilono-vae Aspects (URKA). D.D. acknowledges support from the NCN through the SONATA grant UMO-2020/39/D/ST9/00720. M.J.M. acknowledges the support of the NCN through the SONATA BIS grant UMO-2018/30/E/ST9/00208 and the Polish National Agency for Academic Exchange Bekker program grant BPN/BEK/2022/1/00110. M.R. acknowledges support from the Foundation for Polish Science (FNP) under the program START 063.2023. We thank the anonymous referee for the careful reading of the manuscript and for her/his thoughtful comments.
References
- Asano, R. S., Takeuchi, T. T., Hirashita, H., & Inoue, A. K. 2013, EPS, 65, 213 [Google Scholar]
- Berné, O., Joblin, C., Deville, Y., et al. 2007, A&A, 469, 575 [NASA ADS] [CrossRef] [EDP Sciences] [Google Scholar]
- Bohlin, R. C., Savage, B. D., & Drake, J. F. 1978, ApJ, 224, 132 [Google Scholar]
- Bressan, A., Fagotto, F., Bertelli, G., & Chiosi, C. 1993, A&AS, 100, 647 [NASA ADS] [Google Scholar]
- Burgarella, D., Nanni, A., Hirashita, H., et al. 2020, A&A, 637, A32 [NASA ADS] [CrossRef] [EDP Sciences] [Google Scholar]
- Burgarella, D., Bogdanoska, J., Nanni, A., et al. 2022, A&A, 664, A73 [NASA ADS] [CrossRef] [EDP Sciences] [Google Scholar]
- Calura, F., Pipino, A., & Matteucci, F. 2008, A&A, 479, 669 [NASA ADS] [CrossRef] [EDP Sciences] [Google Scholar]
- Casasola, V., Bianchi, S., Magrini, L., et al. 2022, A&A, 668, A130 [NASA ADS] [CrossRef] [EDP Sciences] [Google Scholar]
- Cesarsky, D., Lequeux, J., Ryter, C., & Gérin, M. 2000, A&A, 354, L87 [Google Scholar]
- Chabrier, G. 2003, PASP, 115, 763 [Google Scholar]
- Conroy, C., van Dokkum, P. G., & Kravtsov, A. 2015, ApJ, 803, 77 [Google Scholar]
- Côté, B., O’Shea, W., Ritter, C., Herwig, F., & Venn, K. A. 2017, ApJ, 835, 128 [CrossRef] [Google Scholar]
- Cristallo, S., Straniero, O., Gallino, R., et al. 2009, ApJ, 696, 797 [NASA ADS] [CrossRef] [Google Scholar]
- Cristallo, S., Piersanti, L., Straniero, O., et al. 2011, ApJS, 197, 17 [NASA ADS] [CrossRef] [Google Scholar]
- Cristallo, S., Straniero, O., Piersanti, L., & Gobrecht, D. 2015, ApJS, 219, 40 [Google Scholar]
- Cuppen, H. M., Walsh, C., Lamberts, T., et al. 2017, Space Sci. Rev., 212, 1 [Google Scholar]
- Dell’Agli, F., Tosi, S., Kamath, D., et al. 2023, MNRAS, 526, 5386 [CrossRef] [Google Scholar]
- Demyk, K. 2011, in European Physical Journal Web of Conferences, 18, 03001 [NASA ADS] [CrossRef] [EDP Sciences] [Google Scholar]
- De Vis, P., Jones, A., Viaene, S., et al. 2019, A&A, 623, A5 [NASA ADS] [CrossRef] [EDP Sciences] [Google Scholar]
- Donevski, D., Lapi, A., Malek, K., et al. 2020, A&A, 644, A144 [NASA ADS] [CrossRef] [EDP Sciences] [Google Scholar]
- Donevski, D., Damjanov, I., Nanni, A., et al. 2023, A&A, 678, A35 [NASA ADS] [CrossRef] [EDP Sciences] [Google Scholar]
- Draine, B. T. 2011, Physics of the Interstellar and Intergalactic Medium (Princeton University Press) [Google Scholar]
- Draine, B. T., & Li, A. 2007, ApJ, 657, 810 [CrossRef] [Google Scholar]
- Dwek, E. 1998, ApJ, 501, 643 [NASA ADS] [CrossRef] [Google Scholar]
- Dwek, E., Galliano, F., & Jones, A. P. 2007, ApJ, 662, 927 [NASA ADS] [CrossRef] [Google Scholar]
- Fagotto, F., Bressan, A., Bertelli, G., & Chiosi, C. 1994a, A&AS, 104, 365 [NASA ADS] [Google Scholar]
- Fagotto, F., Bressan, A., Bertelli, G., & Chiosi, C. 1994b, A&AS, 105, 29 [NASA ADS] [Google Scholar]
- Fagotto, F., Bressan, A., Bertelli, G., & Chiosi, C. 1994c, A&AS, 105, 39 [NASA ADS] [Google Scholar]
- Ferrière, K. M. 2001, Rev. Mod. Phys., 73, 1031 [NASA ADS] [CrossRef] [Google Scholar]
- Fioc, M., & Rocca-Volmerange, B. 2019, A&A, 623, A143 [NASA ADS] [CrossRef] [EDP Sciences] [Google Scholar]
- Galliano, F., Nersesian, A., Bianchi, S., et al. 2021, A&A, 649, A18 [EDP Sciences] [Google Scholar]
- Ginolfi, M., Graziani, L., Schneider, R., et al. 2018, MNRAS, 473, 4538 [NASA ADS] [CrossRef] [Google Scholar]
- Ginolfi, M., Jones, G. C., Béthermin, M., et al. 2020, A&A, 633, A90 [NASA ADS] [CrossRef] [EDP Sciences] [Google Scholar]
- Girardi, L., Bressan, A., Chiosi, C., Bertelli, G., & Nasi, E. 1996, A&AS, 117, 113 [NASA ADS] [CrossRef] [EDP Sciences] [Google Scholar]
- Gobat, R., Daddi, E., Magdis, G., et al. 2018, Nat. Astron., 2, 239 [NASA ADS] [CrossRef] [Google Scholar]
- Heger, A., & Woosley, S. E. 2010, ApJ, 724, 341 [Google Scholar]
- Iwamoto, K., Brachwitz, F., Nomoto, K., et al. 1999, ApJS, 125, 439 [NASA ADS] [CrossRef] [Google Scholar]
- Kobayashi, H., Kimura, H., Watanabe, S. i., Yamamoto, T., & Müller, S. 2011, Earth Planets Space, 63, 1067 [Google Scholar]
- Kokorev, V. I., Magdis, G. E., Davidzon, I., et al. 2021, ApJ, 921, 40 [NASA ADS] [CrossRef] [Google Scholar]
- Kurucz, R. L. 1979, ApJS, 40, 1 [NASA ADS] [CrossRef] [Google Scholar]
- Laor, A., & Draine, B. T. 1993, ApJ, 402, 441 [NASA ADS] [CrossRef] [Google Scholar]
- Leśniewska, A., Michałowski, M. J., Gall, C., et al. 2023, ApJ, 953, 27 [CrossRef] [Google Scholar]
- Li, Q., Narayanan, D., & Davé, R. 2019, MNRAS, 490, 1425 [CrossRef] [Google Scholar]
- Li, M., Li, Y., Bryan, G. L., Ostriker, E. C., & Quataert, E. 2020, ApJ, 898, 23 [NASA ADS] [CrossRef] [Google Scholar]
- Limongi, M., & Chieffi, A. 2018, ApJS, 237, 13 [NASA ADS] [CrossRef] [Google Scholar]
- Marks, M., Kroupa, P., Dabringhausen, J., & Pawlowski, M. S. 2012, MNRAS, 422, 2246 [NASA ADS] [CrossRef] [Google Scholar]
- Mathis, J. S., Mezger, P. G., & Panagia, N. 1983, A&A, 128, 212 [NASA ADS] [Google Scholar]
- Michalowski, M. J., Hjorth, J., Gall, C., et al. 2019, A&A, 632, A43 [NASA ADS] [CrossRef] [EDP Sciences] [Google Scholar]
- Nanni, A., Bressan, A., Marigo, P., & Girardi, L. 2013, MNRAS, 434, 2390 [NASA ADS] [CrossRef] [Google Scholar]
- Nanni, A., Burgarella, D., Theulé, P., Côté, B., & Hirashita, H. 2020, A&A, 641, A168 [NASA ADS] [CrossRef] [EDP Sciences] [Google Scholar]
- Pantoni, L., Lapi, A., Massardi, M., Goswami, S., & Danese, L. 2019, ApJ, 880, 129 [NASA ADS] [CrossRef] [Google Scholar]
- Portegies Zwart, S. F., McMillan, S. L. W., & Gieles, M. 2010, ARA&A, 48, 431 [NASA ADS] [CrossRef] [Google Scholar]
- Prantzos, N., Abia, C., Limongi, M., Chieffi, A., & Cristallo, S. 2018, MNRAS, 476, 3432 [Google Scholar]
- Rauch, T. 2003, A&A, 403, 709 [NASA ADS] [CrossRef] [EDP Sciences] [Google Scholar]
- Ritter, C., Herwig, F., Jones, S., et al. 2018, MNRAS, 480, 538 [NASA ADS] [CrossRef] [Google Scholar]
- Romano, M., Nanni, A., Donevski, D., et al. 2023, A&A, 677, A44 [NASA ADS] [CrossRef] [EDP Sciences] [Google Scholar]
- Salak, D., Hashimoto, T., Inoue, A. K., et al. 2024, ApJ, 962, 1 [NASA ADS] [CrossRef] [Google Scholar]
- Stanghellini, L., García-Hernández, D. A., García-Lario, P., et al. 2012, ApJ, 753, 172 [NASA ADS] [CrossRef] [Google Scholar]
- Stasińska, G., & Szczerba, R. 1999, A&A, 352, 297 [Google Scholar]
- Straniero, O., Gallino, R., & Cristallo, S. 2006, Nucl. Phys. A, 777, 311 [NASA ADS] [CrossRef] [Google Scholar]
- Ventura, P., Criscienzo, M. D., Schneider, R., et al. 2012, MNRAS, 424, 2345 [NASA ADS] [CrossRef] [Google Scholar]
- Weingartner, J. C., & Draine, B. T. 2001a, ApJ, 548, 296 [Google Scholar]
- Weingartner, J. C., & Draine, B. T. 2001b, ApJS, 134, 263 [CrossRef] [Google Scholar]
- Westera, P., Lejeune, T., Buser, R., Cuisinier, F., & Bruzual, G. 2002, A&A, 381, 524 [NASA ADS] [CrossRef] [EDP Sciences] [Google Scholar]
- Zhukovska, S., Gail, H. P., & Trieloff, M. 2008, A&A, 479, 453 [NASA ADS] [CrossRef] [EDP Sciences] [Google Scholar]
The key element is defined as the least abundant among the elements that form a certain dust species divided by its number of atoms in the compound.
Absorption and scattering coefficients are available at https://www.astro.princeton.edu/~draine/dust/dust.diel.html
The contribution of photo-evaporation from PNe was split in the two terms of Eq. (7).
All Figures
|
Fig. 1 Specific mass of dust produced and/or destroyed as a function of time. Upper panel: overall evolution of dust computed as the enrichment from stars minus the dust removal from different mechanisms. We show cases with and without dust growth in the ISM. The initial mass of the gas is equal to four times the final mass of stars, Mgas,ini = 4 × M*,fin and τ = 1000 Myr in Eq. (8). Middle and lower panels: Dust removal due to different mechanisms included in the models in the upper panel, as mentioned in the legend, where “PE” stands for “photo-evaporation”. |
| In the text | |
|
Fig. 2 Specific mass of dust produced and/or destroyed as a function of time. Upper panel: overall evolution of dust computed as the enrichment from stars minus the dust removal from different mechanisms. Two cases with different initial gas masses, Mgas,ini = 4 × M*,fin and Mgas,ini = 20 × M*,fin, are compared. We selected τ = 1000 Myr in Eq. (8) and did not include dust growth in the ISM. Middle and lower panels: dust removal due to different mechanisms included in the models in the upper panel, similar to Fig. 1. |
| In the text | |
|
Fig. 3 Specific mass of dust produced and/or destroyed as a function of time. Upper panel: overall evolution of dust computed as the enrichment from stars minus the dust removal from different mechanisms. Two cases with different values of τ = 10,1000 Myr in Eq. (8) are shown. Mgas,ini = 4 × M*,fin. Middle and lower panels: dust removal due to different mechanisms corresponding to the models in the upper panel, similar to Fig. 1. |
| In the text | |
|
Fig. 4 Specific mass of dust produced and/or destroyed as a function of time. Upper panel: overall evolution of dust computed as the enrichment from stars minus the dust removal from different mechanisms. Two cases with different choices of the IMF are shown. We selected Mgas,ini = 4 × M*,fin, τ = 1000 Myr in Eq. (8) and did not include dust growth in the ISM. Middle and lower panels: dust removal due to different mechanisms corresponding to the models in the upper panel, similar to Fig. 1. |
| In the text | |
Current usage metrics show cumulative count of Article Views (full-text article views including HTML views, PDF and ePub downloads, according to the available data) and Abstracts Views on Vision4Press platform.
Data correspond to usage on the plateform after 2015. The current usage metrics is available 48-96 hours after online publication and is updated daily on week days.
Initial download of the metrics may take a while.