Open Access
Fig. 2
Download original image
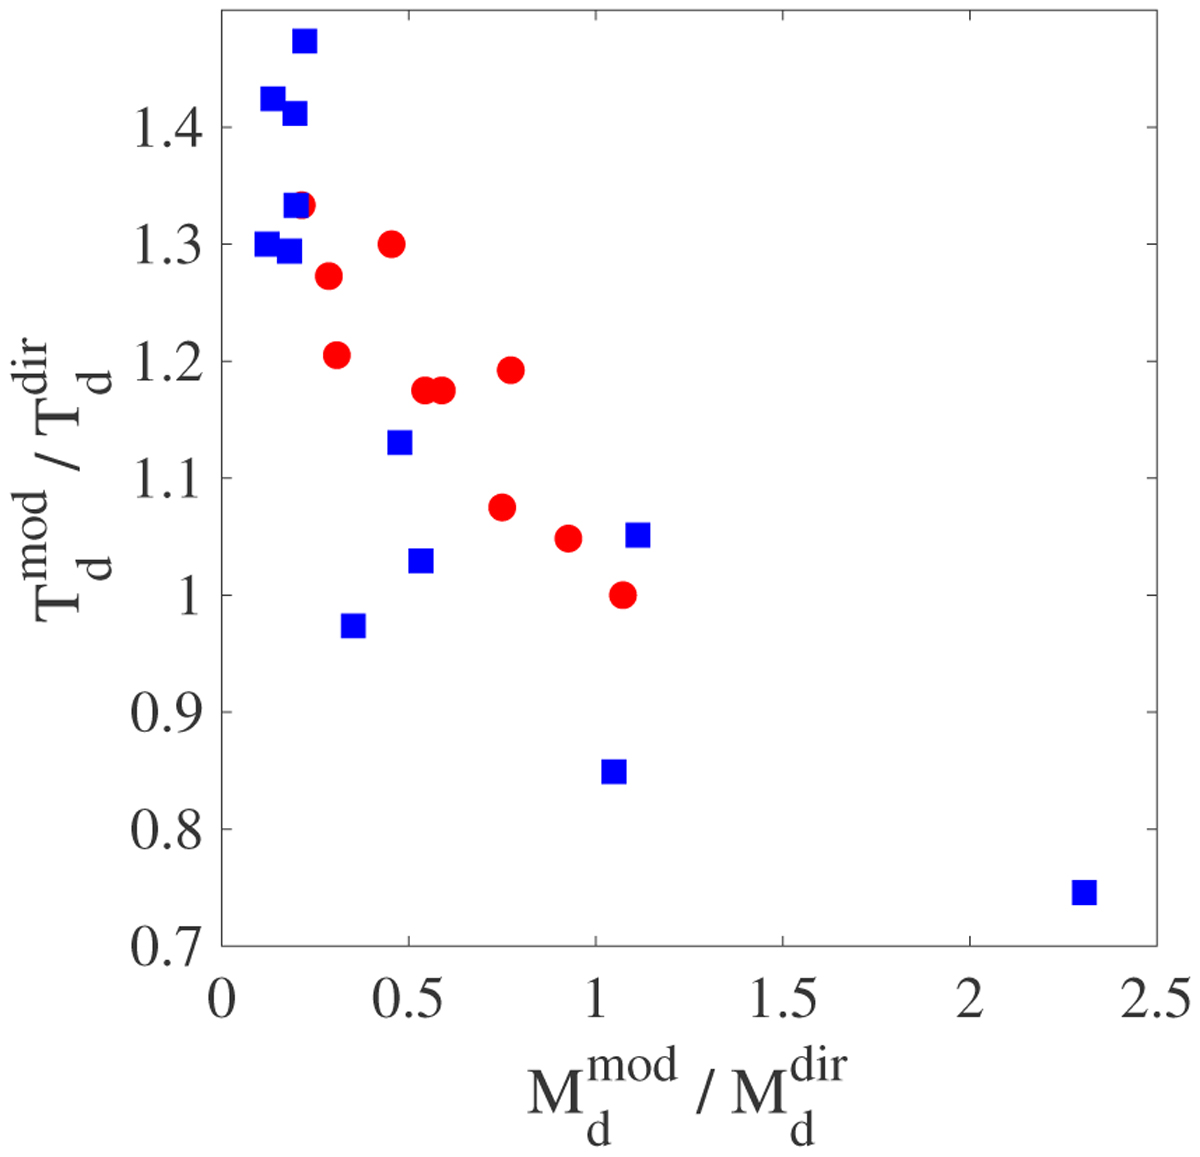
Ratios between dust temperatures and dust masses obtained through two different methods using 0.1 µm grains: full radiative transfer (![]() and
and ![]() ) and derived directly from the PACS images (
) and derived directly from the PACS images (![]() and
and ![]() ) for C-rich sources (red dots) and O-rich and S-type AGB stars (blue squares).
) for C-rich sources (red dots) and O-rich and S-type AGB stars (blue squares).
Current usage metrics show cumulative count of Article Views (full-text article views including HTML views, PDF and ePub downloads, according to the available data) and Abstracts Views on Vision4Press platform.
Data correspond to usage on the plateform after 2015. The current usage metrics is available 48-96 hours after online publication and is updated daily on week days.
Initial download of the metrics may take a while.