| Issue |
A&A
Volume 662, June 2022
|
|
|---|---|---|
| Article Number | A5 | |
| Number of page(s) | 15 | |
| Section | Extragalactic astronomy | |
| DOI | https://doi.org/10.1051/0004-6361/202142546 | |
| Published online | 25 May 2022 | |
Modelling X-shaped radio galaxies: Dynamical and emission signatures from the Back-flow model
1
Department of Astronomy, Astrophysics and Space Engineering, Indian Institute of Technology Indore, Simrol 453552, India
e-mail: gourab@iiti.ac.in, bvaidya@iiti.ac.in
2
INAF/Osservatorio Astrofisico di Torino, Strada Osservatorio 20, 10025 Pino Torinese, Italy
3
Inter-University Centre for Astronomy and Astrophysics, Post Bag 4, Pune 411007, India
4
Dipartimento di Fisica Generale, Universita degli Studi di Torino, Via Pietro Giuria 1, 10125 Torino, Italy
Received:
29
October
2021
Accepted:
2
March
2022
Context. Active galactic nuclei typically show the presence of radio jets ranging from sub-kiloparsec to megaparsec scales. Some of these radio galaxies show distortion in their jets, forming tailed or winged sources. X-shaped radio galaxies (XRGs) are a sub-class of winged sources, the formation mechanism of which is still unclear.
Aims. The focus of this work is to understand hydro-dynamical back-flows and their role in dynamics and non-thermal emission signatures (in the presence of radiative losses and diffusive shock acceleration) during the initial phase of these galaxies.
Methods. We performed relativistic magneto-hydrodynamic (RMHD) simulations of an under-dense jet travelling in a tri-axial ambient using a hybrid Eulerian-Lagrangian framework to incorporate effects of micro-physical processes.
Results. We demonstrate the dominant role played by pressure gradient in shaping XRGs in thermally dominated cases. We show that the prominence of the formed structure decreases as the jet deviates from the major axis of the ambient. The wing evolution is mainly governed by re-energised particles due to shocks that keep the structure active during the evolution time. The synthetic intensity maps of the radio galaxy show similarities with morphologies that are typically found in observed XRGs. This includes the cases with wider wings than the active lobes. The characteristic emission signatures in terms of its synchrotron spectra and the implication of equipartition condition in age estimation are also discussed here. Additionally, we show that age discrepancies can be attributed to the mixing of different aged particle populations. Furthermore, the effect of the viewing angle on the difference of spectral index (Δα) of the active lobes and the wings shows a large variation and degenerate behaviour. We demonstrate the role of diffusive shocks in the obtained variation and conclude that the Δα spread is not a dependable characteristic in determining the formation model of XRGs.
Key words: radiation mechanisms: non-thermal / acceleration of particles / magnetohydrodynamics (MHD) / galaxies: jets / methods: numerical
© ESO 2022
1. Introduction
The work of Fanaroff & Riley (1974) showed that there are two types of extended radio galaxies classified based on their luminosity at 178 MHz: Fanaroff & Riley (FR) classes I and II. They can also be identified by observing the absence or the presence of the edge-brightened feature at the jet termination point, respectively. The radio jets ejected along the spin axes of the central super massive black hole (SMBH) can extend from several kiloparsec (kpc) to a few megaparsec (Mpc) in space (Bassani et al. 2016; Dabhade et al. 2020). Interestingly, some of these double-lobed radio galaxies show significant distortion in their lobes and form peculiar radio structures. They can be divided into two categories – Mirror symmetry, when the bridges or lobes bend away from the galaxy in the same direction, forming tailed sources and Inversion symmetry, where they bend in opposite directions forming winged sources (X, S, or Z morphology). There is a general agreement that mirror symmetry occurs when the galaxy is moving with respect to the ambient medium. In most cases, the ram pressure of the cluster medium and buoyancy forces influence the formation of these tailed structures (Smolčić et al. 2007; Müller et al. 2021; Pandge et al. 2022). However, the formation mechanism of X-shaped radio galaxies (or the winged sources) is still under debate with no general agreement (Lal & Rao 2007; Hodges-Kluck et al. 2010; Gopal-Krishna 2012; Hardcastle et al. 2019; Cotton et al. 2020). The first X-shaped radio galaxy (XRG), NGC 326, was discovered by Ekers et al. (1978). Since then, it has been known that these galaxies have a pair of active lobes similar to the classical double-lobed radio structure beside the presence of secondary lobes (wings) which are diffuse, extended, and of lower luminosity than the active lobes (Cheung 2007; Bera et al. 2020). A recent study using the MeerKat telescope demonstrated a classic wing-lobe structure using 1.28 GHz radio observations demonstrating wings extending up to several hundreds of kpc (Cotton et al. 2020).
Several models have been put forward in order to describe the peculiar X-shape. One of the models is based on the merging of galaxies hosting super-massive black holes (Begelman et al. 1980; Rottmann 2001). Here, the formation of diffuse lobes has been attributed to the relic jet, formed due to the BH-BH collision leading to a quick change in the jet ejection axis of the central active galactic nuclei (AGN) (Merritt & Ekers 2002; Gopal-Krishna et al. 2003; Saripalli & Roberts 2018). The process of merging of galaxies can also result in a rather slow transition of central BH spin axis. Here, the freshly deposited matter of the merged companion with different angular momentum will eventually realign the spin axis of the central BH in a gradual manner via accretion (Rottmann 2001). The re-orientation timescale for such a process is of the order of 106 − 107 years (Natarajan & Armitage 1999; Dennett-Thorpe et al. 2002). Additionally, jet re-orientation due to spin transition of the central SMBH in a post-merger phase has also been suggested by Garofalo et al. (2020).
A different model considering the role of the ambient relates the formation of wings occurs to the evolution of the back-flowing plasma in the galaxy tri-axial density distribution (Back-flow model). The back-flowing materials (plasma) released at the jet head while traversing back towards the centre are deflected by the interstellar medium (ISM) of the host galaxy, leading to an X-shaped morphology (Leahy & Williams 1984). The study led by Capetti et al. (2002) showed the role of an over-pressured cocoon in forming XRGs and a striking connection between the wing orientation and the minor axis of the ambient, confirmed by Gillone et al. (2016) on a larger sample. This is what has actually been observed for many XRGs (Saripalli & Subrahmanyan 2009) and has been verified in a detailed 3D simulation led by Rossi et al. (2017). Recent evidence for the Back-flow model is provided by Cotton et al. (2020), where they show a double-boomerang structure supporting the findings of Leahy & Williams (1984) and comparable to the results of numerical simulations by Rossi et al. (2017). The role of an over-pressured cocoon in forming a giant radio galaxy with X-shaped morphology is also shown recently by Bruni et al. (2021).
Some other formation mechanisms relevant to either of the models mentioned above are highlighted here. They are the dual AGN model by Lal & Rao (2007) and the effect of buoyancy on the plasma bubble or lobes by Gull & Northover (1973), which are receiving some relevant observational support from the studies led by Lal et al. (2019), Hardcastle et al. (2019). The role of a precessing jet in forming an X-shaped morphology can also not be ignored, as shown by Horton et al. (2020) using numerical simulations of precessing jets and proxy synchrotron emission for the formed structures. However, to date, there exists no general agreement between the proposed models to describe the formation process of these galaxies. Also, under which parametric restrictions each of these models work is still not well understood (Joshi et al. 2019). Finally, whether any universal model exists that can explain all the properties of these galaxies is also an important question to ask.
In our study, we focused on the Back-flow model (Capetti et al. 2002) as the possible origin of the X-morphology by using numerical simulations to study their dynamics and emission properties. In this regard, Capetti et al. (2002) and Hodges-Kluck & Reynolds (2011) also performed numerical simulations considering the role of the ambient and the back-flow of plasma using a hydro-dynamical approach. In a more detailed simulation led by Rossi et al. (2017), considering both the effects of magnetic field and relativistic flows, have investigated the wing formation process based on the jet and ambient parameters. However, considering the emission perspective of XRGs, these previous studies either used proxies (Hodges-Kluck & Reynolds 2011) or considered a simplistic treatment of it (Rossi et al. 2017). Here, we intend to model the emission aspect of these radio galaxies by properly introducing the effects of the ongoing micro-physical processes such as radiative and adiabatic losses and the particle re-energisation process. In this way, we can follow the spectral evolution of the emitting particles and we can investigate whether re-energisation processes can also be present in the wings, allowing a possible discrimination between different formation mechanisms.
Here, we adopt the Eulerian-Lagrangian hybrid framework to incorporate effects due to radiation losses in the presence of diffusive shock acceleration. Such hybrid models have been developed in several astrophysical codes (Jones et al. 1999; Vaidya et al. 2018; Winner et al. 2019; Huber et al. 2021; Ogrodnik et al. 2021). In particular, for this study we used the model of Vaidya et al. (2018) (see also Mukherjee et al. 2021) in the PLUTO code (Mignone et al. 2007). This model was also recently used to study the influence of KH instability on kpc scale jets by Borse et al. (2021).
The paper is arranged as follows: we discuss our numerical setup in Sect. 2, including both the dynamical and emission perspective of it. In Sect. 3, we demonstrate the dynamical results obtained from different simulation runs. The associated spectral signatures obtained using the hybrid framework are discussed in detail in Sect. 4. Furthermore, we showcase the impact of shock acceleration on particle and spectral evolution in Sect. 5 and then summarise our work in Sect. 6. We adopted here a flat cosmology with H0 = 69.6 km s−1 Mpc−1 and Ωm = 0.29.
2. Numerical setup
Our numerical simulations were performed using the PLUTO code (Mignone et al. 2007), which solves the set of relativistic magneto-hydrodynamic (RMHD) equations defined as
where κ, δ = (0, 1, 2, 3) (Mignone & Bodo 2006; Mignone et al. 2009). Here, ρ is the rest mass density, uκ is the four velocity (Γ(1, v): Γ represents the jet Lorentz factor), and bκ is the covariant magnetic field defined through the lab field B as (b0, B/Γ + b0v). Total enthalpy and total pressure of the system are represented by w and p, respectively. The metric gκδ is considered to be flat with the form diag(−1, 1, 1, 1).
2.1. Dynamical model
The ambient condition of our numerical model is a representative tri-axial ellipsoidal galaxy. We initialised such a galaxy using the King’s density profile (Cavaliere & Fusco-Femiano 1976), which is defined (in Cartesian system) as
where ρ0 is the central density of the galaxy and set to be 1 amu/cc. The values of a, b, and c (effective core radius) are different so that the density distribution acquires a tri-axial shape. Here,

and ψ is the angle between the jet ejection axis and the major axis of the galaxy (Rossi et al. 2017). The pressure distribution P(x′,y′,z) follows the density distribution of the galaxy by assuming an isothermal atmosphere and is used to obtain acceleration due to gravity (g) through the hydro-static equilibrium equation, ∇P = ρg. Furthermore, we introduced an initial jet nozzle at the centre of this distribution, which will continuously inject a relativistic jet with a Lorentz factor of Γ = 5. The injected jet materials are under-dense with a factor (η) of 10−6 relative to the central density of the galaxy. The galaxy is initially iso-thermal, and the temperature of the medium is fixed by setting the jet Mach number to 400. The Taub-Matthews equation of state was used for our runs (Taub 1948; Mignone et al. 2005). We performed these simulations with second-order accuracy in space using linear reconstruction and the HLLC Riemann solver. We also incorporated an initial toroidal B-field in the jet injection region, which is defined as

where r and ϑ are the polar coordinates in the perpendicular plane to the jet ejection axis and Bx, By are the components of the field defined in that plane (Rossi et al. 2017). The value of Bt is constant and is determined through the jet magnetisation parameter σ (set to 0.01), which is the ratio of the Poynting flux to the matter energy flux ( is the specific enthalpy). To ensure the solenoidal condition of magnetic field, we adopted the method of divergence cleaning as prescribed by Dedner et al. (2002). The simulations were conducted in dimensionless units, where the units for their conversion back into physical forms are chosen by keeping consistency with the observational data. The unit length is defined as
  kpc, which is a fictitious core radius of the galaxy. Based on this, all the lengths are defined in our simulations. Unit density (ρ0) and velocity (V0) are chosen as 1 amu/cc and light speed (c), respectively; using these, we can find out the units for other variables as well.
For our runs, we particularly followed the initial configuration described in Rossi et al. (2017). The initial density profile was obtained using Eq. (2) by adopting a = 1/3, b = 2/3 and c = 1/4 with respect to the physical scale  . So, the y′-axis is the major axis of the galaxy (where y is the jet ejection axis) and the x′and z axes are the intermediate and minor axes, respectively. The distribution of density along the three axes of the ambient medium is represented in Fig. 1. The simulation domain has a physical size of
  ×
×  ×
×  , which is discretised using 192 × 384 × 192 grid points for our reference runs (see Table 1). A bi-directional jet is injected into the domain from the origin through a cylindrical injection region with a radius of 0.05 and a height of 0.063 (with respect to
  ). This region is further divided (along
  ) into three sections: neutral region, jet region (towards +ve y-axis), and the counter-jet region (towards −ve y-axis). In the neutral region (
 ), the B-field values and velocity are zero but in the jet and the counter-jet region, the direction of the velocity and B-field are reversed. The parameters defined inside the jet injection region are set to be fixed with time. For these runs, the outer boundaries on all sides are set by extrapolating the ambient values.
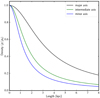 |
Fig. 1. Distribution of density along major, intermediate, and minor axis of the tri-axial ellipsoidal galaxy is shown here (in the initial phase), where the value of ρ0 is 1 amu/cc. |
Parameters that are varied in our simulations.
The injected jet power is calculated using the formula below (Matthews et al. 2019):
![$$ \begin{aligned} Q_j = \pi r_j^2 {{v}}_j \bigg[ \Gamma (\Gamma - 1)\rho_j c^2 + \frac{\curlyvee}{{\curlyvee} - 1}\Gamma^2 P_j\bigg] ,\end{aligned} $$](/articles/aa/full_html/2022/06/aa42546-21/aa42546-21-eq16.gif)
where rj, vj, ρj, ⋎ and Pj represent the jet radius, bulk velocity of the jet, jet density, adiabatic index, and jet pressure, respectively. All of our simulations possess the same value of Qj, which is 1.51 × 1045 erg s−1.
The different simulations carried out in the present study are summarised in Table 1. We performed two principle runs in 3D using the resolution prescribed above, which we refer to as our reference runs. For the case 3Dmaj_ref, the ejected jet propagates along the major axis of the galaxy and for the case 3Dang_ref, the jet propagates at a 30° angle to the major axis of the galaxy (similar to cases E and F of Rossi et al. 2017). We also carried out a high resolution run (3Dmaj_high) with 384 × 768 × 384 grid cells to investigate the resolution effect in our results.
2.2. Emission model
We made use of the hybrid framework of the PLUTO code in order to inject the Lagrangian macro-particles into the domain to model the emission properties of these galaxies (Vaidya et al. 2018; Mukherjee et al. 2021). These non-thermal particles were continuously injected through the jet nozzle in order to fill the computational domain. With the chosen injection rate, we obtained nearly 106 particles at the end of the simulation that can adequately model the emission features. Each macro-particle is an ensemble of non-thermal electrons that are set to follow a power law pattern (initially) defined as N(γ) = N0γ−p with index p = 6. The value of N0 can be obtained by  where nmicro is the non-thermal electron number density. Its value is set by assuming that the energy density of the injected electrons (Ue) is a fraction of the magnetic energy density
  at the injection region; that is (in cgs units),
The term in the brackets in Eq. (6) represents the equipartition magnetic energy density (Hardcastle et al. 2002) where Beq is the equipartition magnetic field strength. In reality, Beq is rather a proxy for magnetic field defined such that magnetic energy associated is equivalent to the radiating electrons energy and therefore cannot be regarded as physical magnetic field. Here, ϵ represents the fraction and is set to the value of 2.7 × 10⁻⁴ under the limiting Lorentz factors 102 (γmin) and 1010 (γmax) of the electrons. The choice of ϵ is rather arbitrary and results in a sub-equipartition strength of emission with Beq = 0.01Bdyn. We therefore obtain the value of nmicro as 10−3ρj, where ρj is the jet density. The initial spectral distribution of the electrons will subsequently get updated depending on the micro-physical processes it undergoes like radiative losses, adiabatic cooling, or diffusive shock acceleration from multiple shocks. For this reason, the particles are insensitive to the initial conditions when they travel some distance away from the injection region. The radiative losses considered here are the synchrotron and the inverse Compton (IC-CMB) emission, for which we set a representative redshift (z) of the galaxy as 0.05. For the present study, we focused on the synchrotron emission for seven different frequencies, six of which are in radio bands (LOFAR 144 MHz, GMRT 240 MHz, GMRT 610 MHz, VLA 1.4 GHz, VLA 5 GHz and VLBA 43 GHz) and one is in the optical B band (HST 6.5 × 10⁴ GHz). In this regard, we obtained specific intensity maps of the radio galaxy from synchrotron emissivities (at these frequencies) assuming a line of sight angle (θ, ϕ) as shown in Fig. 2.
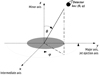 |
Fig. 2. 3D representative image showing the line of sight visualisation angle (θ, ϕ) used in our study to get the synchrotron emissivity (and hence the intensity) along that direction. The major, intermediate, and minor axes of the central ellipsoidal galaxy are labelled here just to represent the relative configuration of the tri-axial ambient, where they shift slightly based on our different runs. |
3. Dynamical evolution: Lobe and wing formation
In this section, we describe the dynamical evolution of various simulations leading to the formation of X-shaped morphology.
3.1. Jet along major axis
At the onset when the jet head enters into the galactic medium, it results in the formation of a spherical cocoon due to the high-density distribution near the centre of the galaxy. As time progresses, both the jet and counter-jet propagate outwards and exit the high-density galactic core region. The existing over-pressured spherical cocoon starts to expand asymmetrically, following the maximum pressure gradient path created by the ambient medium. Elliptical galaxies have a higher pressure gradient along the minor axis compared to the major one. Thus, when jets travel along the major axis, the back-flowing material (which contributes to spherical cocoon) expands faster along the minor axis, creating a prominent wing structure. In Fig. 3 (for the case of 3Dmaj_ref), we show the density distribution (left) viewed along the x-axis indicating the formation of a prominent wing structure. On the right, we show 3D velocity distribution (vy) viewed at an angle to the jet ejection axis. This velocity distribution demonstrates the formation of the back-flowing plasma at the jet head and accumulation of it in the wings. The corresponding time of evolution for both these structures is 3.91 megayear (Myr).
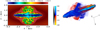 |
Fig. 3. Dynamical characteristics showing the formation of a wing-lobe structure for case 3Dmaj_ref. Left: 2D slice of our simulated 3D structure (at x = 0) representing the density distribution in the y − z plane. The formation of a prominent wing structure along the z-axis can be observed here. Right: velocity-distribution map (vy) of the bi-directional jet, representing the same structure as the left one but viewed at an angle to the jet ejection axis. Both of these structures have a dynamical age of 3.91 Myr. The measure of velocity, density, and length are represented here with respect to the light speed (c), unit density (ρ0 i.e. 1 amu/cc), and unit length ( |

A comparison with the theoretical estimation of the active lobe length with the simulated length is also made for this case and is represented in Fig. 4, where, in addition, a comparison with our high resolution run is also overlaid. The theoretical estimation of the active lobe length is obtained from the equation as suggested by Martí et al. (1997) for a relativistic case; that is,
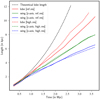 |
Fig. 4. Comparison of the theoretical estimation of lobe length with our simulated lobe length obtained for the run 3Dmaj_ref is shown. The time evolution of the wing lengths along the intermediate axis (i.e. along the x-axis) and the minor axis (i.e. along the z-axis) along with the comparison with the high resolution 3D run (3Dmaj_high) are also overlaid. The caption ref_res used here for the run 3Dmaj_ref and high_res for the run 3Dmaj_high. |
where vh, Γj, ρj, ρa, hj, and ha represent the jet head speed, jet Lorentz factor, jet density, ambient density, and jet and ambient specific enthalpies, respectively. In order to determine the simulated active lobe length, we tracked the maximum pressure region that will occur at the jet-head and ambient interaction point (Bromberg et al. 2011). Whereas, for the wing length determination, we tracked the maximum value of kinetic energy along the wing. In Fig. 4, we can see that the simulated line never crosses the theoretical prediction (1D), as we have extra dimensions here (3D) where the jet can expand, reducing the jet velocity further (Rossi et al. 2017). It is also noticeable that with increasing resolution, the results approach the theoretical prediction. However, the deviation in the wing length and in the lobe length for our high and reference resolution cases are < 4% and 12%, respectively, at a time of 3.13 Myr. This is equivalent to a lag of < 0.2 kpc and 1.1 kpc for the wing and lobe length, compared to their total sizes of 5.6 kpc and 9.9 kpc respectively. The average values of magnetic field (density weighted) we obtain at the end of the simulations (3.91 Myr) are of the order of 12 μG. Similarly, for the average pressure of the cocoon, the value we obtain is of the order of 10−9 dyn cm−2. In addition to this, we also plotted the time evolution of plasma-β (the ratio of thermal to magnetic pressure, βpl
 ) in order to understand which form of energy plays the crucial role in shaping these galaxies. The values of βpl represented in Fig. 5 are much higher than unity. This indicates that it is the thermal part that remains dominated in the cocoon over a long time for these galaxies (thermally over-pressured cocoon). Also, at the same time, the cocoon is strongly over-pressured with respect to the ambient. In this regard, the evolution of βpl obtained in the case of 3Dmaj_high does not show a steep increase; however, an overall increasing nature with βpl ≫ 1 of the curve is obvious.
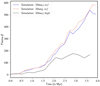 |
Fig. 5. Time evolution of plasma-β (βpl) for all of our runs showing a gradual increasing nature throughout. The values of it obtained are much higher than unity indicating the presence of a thermally over-pressured cocoon. |
3.2. Jet at an angle to the major axis
The simulation 3Dang_ref, where the jet propagates at an angle 30° to the major axis of the galaxy, still favours the formation of an X-shape morphology. However, as it deviates from the most favourable condition of wing formation, the prominence of the formed structure is less than the run 3Dmaj_ref (Rossi et al. 2017). In Fig. 6, we represent the density distribution of the galaxy along the plane y–z (left) and y–x (right) where the lateral expansion of the cocoon is still in progress. An asymmetry in wing formation, that is the bending of back-flowing materials before reaching centre can be seen in the y–x plane i.e. when viewed along the z-axis of the galaxy, where a similar bending of back-flowing plasma has also been observed in several XRGs (Cotton et al. 2020; Bruni et al. 2021). However, our structure is still in its initial stage of formation (3.91 Myr) and in this regard, it would be interesting to further follow its long term evolution. The lobe length obtained for this case is found to be 24% higher than in the case of 3Dmaj_ref at a time 3.65 Myr, whereas no significant difference in wing lengths is observed for either of the cases. This indicates the crucial role of the thermally over-pressured cocoon in driving the wings beside the leading role played by ambient at its first place. The higher lobe length obtained here is also expected due to the higher propagation speed of the jet (Rossi et al. 2017), which is generated due to the faster decay of ambient pressure along the jet propagation direction. The corresponding evolution of plasma-β follows a similar trend as 3Dmaj_ref (Fig. 5); however, the values obtained are slightly higher.
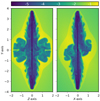 |
Fig. 6. Density distribution (log ρ) of run 3Dang_ref in the plane y–z (left) and y–x (right) showing the wing formation along the z and x axis respectively. The asymmetry in wing formation i.e. the bending of back-flowing materials before reaching centre can be seen here along the x-axis, whose morphological relevance is discussed in Sect. 3.2. The dynamical age of this structure is 3.91 Myr. Here lengths are defined with respect to 4 kpc. |
In summary, our 3D relativistic MHD simulations of jet propagation within a tri-axial galactic environment have demonstrated the formation of X-morphology following the Back-flow model as proposed by Capetti et al. (2002). One of the observed characteristics of such an X-morphology is that in most cases wings coincide with the minor axis of the galaxy (e.g., Saripalli & Subrahmanyan 2009; Gillone et al. 2016; Joshi et al. 2019). We performed simulation runs by varying the direction of jet ejection with respect to the major axis of the underlying galaxy and verified such empirical evidence consistent with results obtained by Rossi et al. (2017). For these radio galaxies, the dominant thermal energy over magnetic energy favours the development of X-shaped morphology and it remains dominated in the cocoon during the evolution time. The back-flowing plasma which was created at the jet head due to the pressure imbalance (Leahy & Williams 1984), continuously inflates the cocoon and gets accumulated in the wings.
4. Synthetic spectral characteristics
4.1. Effect of viewing angle on the surface brightness maps
Using the Lagrangian macro-particles injected into the domain, we also evaluated the intensity distribution of the galaxy. The results for the case of 3Dmaj_ref are shown in Fig. 7, where, in addition to the intensity map, the effect of viewing on the shape is also demonstrated. The line of sight angles of visualisation from the top row to bottom row in Fig. 7 are (θ = 70° ,ϕ = 0°), (θ = 20° ,ϕ = 70°), (θ = 45° ,ϕ = 45°), (θ = 70° ,ϕ = 45°), and (θ = 70° , ϕ = 70°), respectively. In the figure, each column represents emission maps for different observed frequencies as mentioned on top of the column. A common colour bar for the radio frequencies is shown in the utmost right of the figure. A separate colour bar for the optical (B band) map (separated with a dashed rectangular block) is used in order to clearly demonstrate the small-scale variations of intensity. From Fig. 7, it is evident that the relative extent of the active lobe and the wing also depends on the viewing angle. Our projected surface brightness maps, synthesised from a single simulation, show similarities with several observed XRGs in terms of appearance. As suggested by Hodges-Kluck & Reynolds (2011), the projection effect almost always enhances the wing size; this can also be seen in our study.
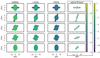 |
Fig. 7. Intensity maps (log I in Jy arcsec−2) obtained for the run 3Dmaj_ref are highlighted in this image for five line-of-sight angles; i.e. (θ = 70° ,ϕ = 0°), (θ = 20° ,ϕ = 70°), (θ = 45° ,ϕ = 45°), (θ = 70° ,ϕ = 45°), and (θ = 70° ,ϕ = 70°) for the first, second, third, fourth, and fifth rows, respectively (from top), at a time of 3.78 Myr. We used a separate colour bar for the optical image to highlight the small-scale variation in the intensity distribution. It is evident from figure that the relative extent of the active lobes and the wings depend on the viewing effect. The measure of ΔRA and ΔDec here are in arcseconds. |
We observe that as the viewing angle θ approaches the intermediate-axis (x-axis), the contribution from the wing to the synthetic emission increases in comparison to that obtained from lobe. Similarly, as the value of ϕ increases, the contribution from wing to the emission also increases. In the odd case with very high θ = 70° and ϕ = 70°, emission in the radio bands from the wing over-powers that from the lobe, and the observed structure resembles a blob and cannot be categorised as X-shaped. The projected lobe length to wing length ratio i.e. ℒlobe/ℒwing for the case (70° ,70°) is 0.7, whereas it is ≈1 for (70° ,45°), stipulating a population that possess equal projected wing and lobe length. The values of ℒlobe/ℒwing for other cases and viewing angles are listed in Table 2 and are typically > 1.
Spread of  , shown for different viewing angles.
In summary, we find that synthetic emission maps produced from simulations with back-flow can span the full range of ℒlobe/ℒwing with different viewing angles. This result is consistent with the findings of Hodges-Kluck & Reynolds (2011), Joshi et al. (2019).
4.2. Spectral maps and energy distribution
From the power-law dependence of the flux density Sv ∝ vα, the spectral index α can be obtained as

Its distribution for the 3Dmaj_ref case with viewing angle (θ = 70° ,ϕ = 0°) and for frequencies v1 = 240 MHz and v2 = 5 GHz is shown in Fig. 8. The intensity weighted average of α of the whole structure is evaluated using the equation below:
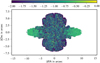 |
Fig. 8. Spectral index distribution (α) of the radio structure obtained for the run 3Dmaj_ref is shown. Here, wings show steep spectral index compared to the active lobes due to the accumulation of older particles. However, the presence of several flatter α patches are also noticeable (especially in the wings), which are generated due to re-energised particles at shock sites. The frequencies used here to produce this map are 240 MHz and 5 GHz. |
and the value obtained is −1.16. From the spectral map distribution, it is evident that steeper spectra are primarily associated with the wings (dark blue), while the lobes show rather flat spectral signatures (light green). Considering the wings, we also observe that at significant places, the spectral index values become flat (localised green spots in the wing structure). This indicates possibility of particle energisation due to localised shocks within the wings. We further analysed particle distribution both in the wings and the lobes separately, and this is discussed in Sect. 5.
The distribution of spectral index also depends on the choice of frequencies, and therefore we created spectral maps with multiple frequency pairs i.e. for (v1, v2) as (0.240, 0.610) GHz, (0.240, 5.0) GHz, and (5.0, 43.0) GHz (see Eq. (8)). In this way, we are probing two ends of a power-law spectrum that has a break near 5 GHz observed in our case. The α maps with the above frequency choices are shown in Fig. 9 for the case of 3Dang_ref with a line-of-sight angle (70° ,0°). The maps indicate that the spectral index is flat within the lobes for all chosen frequency pairs. Whereas, wings demonstrate a much steeper value of α, particularly for higher frequency choices (see middle and right panels of Fig. 9). This corroborates the fact that synchrotron cooling time is short for high-energy particles and verifies the fact that older particles (those injected at early times in the simulation) have considerably cooled due to radiative processes and accumulated in the wings. It should be noted that even for the α map with 5 and 43 GHz (right panel of Fig. 9), one can observe local patches in the wings that correspond to flat spectra with α ∼ −0.7 primarily arising due to shocks. The associated spectral energy distribution (vLv with Lv as the specific luminosity) is obtained for seven synchrotron frequencies and presented in Fig. 10. We observe a low-frequency hump peaking at 1.4 GHz for both of our 3D cases with a peak value of 3 × 1041 erg/sec. Also, the luminosity values show a similar declining trend with higher frequencies, as expected due to synchrotron cooling.
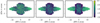 |
Fig. 9. Distribution of spectral index (α) values for different frequency choices for the case of 3Dang_ref is shown here for a line-of-sight angle of (70° ,0°). The frequencies used to generate these maps are 0.240–0.610 GHz (left), 0.240–5.0 GHz (middle), and 5.0–43.0 GHz (right), respectively. The steepening of α values with increasing frequency choices in the wings is expected due to synchrotron cooling. The presence of flatter α patches (particularly in the wings) are prominent if the chosen frequencies are in the low-frequency regime (indication of particle re-energisation). |
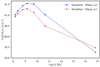 |
Fig. 10. Spectral energy distribution (vLv: Lv is specific luminosity) of our simulated XRGs in seven synchrotron frequencies are represented here. A low frequency hump, peaking at 1.4 GHz, is prominent in the image for both of our 3D cases. |
We further evaluated Δα, the difference between the averaged spectral index of the active lobes ( ) and the wings (
 ), for different viewing angles and different pairs of frequencies. We denote this quantity as
  and compute the same using
We separated out the region of the lobe from the wing as indicated by red rectangle with solid line in Fig. 11. The rectangle is drawn ensuring that the jet structure obtained from optical B band images remains well within its sides. The contribution from the overlapping region is eliminated by identifying the lobes by only considering 20% of the projected jet length as shown by the red dashed lines. The region outside the solid rectangle is identified as a wing. The intensity-averaged spectral index is, finally, estimated using Eq. (9) for each of these regions. It is clear from the expression of  (see Eq. (10)) that a negative (−ve) value would indicate flatter spectral index in wings as compared to lobes. While, a positive (+ve)
  would imply that lobes have flatter spectral index compared to the wings.
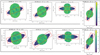 |
Fig. 11. Representation of the regions identified as wing and lobe for evaluating the quantity |


The values of  , obtained for frequencies v1 = 240 MHz and v2 = 610 MHz are highlighted in Table 2 for both our reference runs. We find that its value can be either +ve or −ve depending on the viewing angle. The measure of
  is also sensitive to the choices of frequencies. We obtained its values with different sets of v1 and v2, which are listed in Table 3. The choices are made in such a way that we can probe
  in the two regimes of a broken power-law spectrum obtained for our radio galaxy (spectral break around 5 GHz). We see that
  values are mostly +ve for higher frequencies and also have higher values, as is expected of older cooling electrons in the wings with steeper spectral indices. Negative values of
  are seen for the pairs of frequencies that are in the rising phase of SED (up to the peak at 1.4 GHz). An exception is where
  is −ve, regardless of the fact that both the lobe and wing spectral index (
 ,
,  ) steepen for these frequencies. This is the case with largest projected wing size with a small tip of jet visible in the intensity map. This further hints that the projected size of lobes and wings may play an integral role in influencing the sign of
  . Thus, the viewing angle also plays a crucial role in determining the value of
  as shown in Tables 2 and 3. In the case of our reference run 3Dmaj_ref, the line-of-sight angles (70° ,0°) and (70° ,20°) provide the highest projected lobe length to wing length ratio (≥1.5) and correspondingly have −ve values of
  . On the other hand, the other two viewing angles have greater wing lengths and so values of
  obtained are +ve. For the case of 3Dang_ref, the obtained lengths of lobes are naturally higher due to the higher propagation speed of the jet, as also discussed in Sect. 3.2. In this case, all the values obtained for
  are −ve for 240 MHz (v1) and 610 MHz (v2). However, this is not a general trend observed for all the frequency choices. We also revisited our calculation (i.e. measure of
  ) following the same process as highlighted above but varying the tip length of the jet from 15% to 25%. We observed that changes in ways of distinguishing lobes and wings only affect the quantitative values, but the overall qualitative picture presented here still holds true. This is expected, as with different line of sight choices and box sizes, we consider or ignore regions where effects from non-linear, micro-physical processes are also in play. As a result, a wide range of
  can be anticipated from a single source based on the way we measure them. In the case of a bigger box shape, the effect of contamination (between lobe and wing) will be imparted on the
  measurements.
Spread of  , shown for different choices of frequencies.
From an observation study of 28 XRGs, Lal et al. (2019) demonstrated that the values of  vary approximately between −0.7 to +0.6. Based on such a variation, their study did not find any significant difference between the spectral behaviour of wings and lobes and suggested a possible role of dual AGN in formation of XRGs. From our analysis, we show that
  distribution has a strong dependence on frequency choices, especially which part of SED they are in. In this regard, one should note that the peak frequency in SEDs of several observed XRGs has been found to vary in a wider range starting from MHz to GHz scale (Lal & Rao 2007; Ignesti et al. 2020). The distribution also shows variation depending on the viewing angles. As the size and shape of the structure changes based on line-of-sight visualisation angles, so does the distribution of α, which in turn affects the αav evaluation and hence the
  . The diffusive shocks, especially, complicate things even more by producing flatter α patches. Furthermore, shock acceleration is a continuous process, and so is the radiative cooling processes. Hence, such a measure would critically depend on the evolution stage of the galaxy. Our current models are limited to simulations focusing on the early phase of XRGs. Although the mechanisms through which the shocks are generated are a continuous process, and it is expected that cocoons and wings of larger scale XRGs will also be turbulent as the back-flow settles, whether such mechanisms can operate at a later stage of XRGs (and if so, with what level of efficiency) needs to be tested with long-term simulations. Here, we only intend to highlight the critical dependences of
  on numerous factors that may be in operation in different sources.
In summary, the quantity  has a non-linear dependence on several parameters and a rather degenerate behaviour, and therefore its value may not be sufficient to constrain the formation process of X-shaped radio galaxies. One may find similar distribution of this parameter for the choices of other competing formation models, as the shock re-acceleration could also be relevant in these formation scenarios. This existence of degeneracy implies that a measure of difference in spectral index has to be supplemented with other observable to clearly identify the formation mechanism of XRGs.
5. Impact of shock acceleration
5.1. On maximum particle energy
Our simulations show that older particles tend to accumulate in the wings that are adiabatically expanding. In this case, one would expect the wing over time to have a rather steep spectral distribution due to losses incurred via radiative and adiabatic processes. Instead, we observe that there are significant localised flat α patches in the wings at a time when the structure has evolved for 3.78 Myr. This indicates that the wing structure of the galaxy is not a passively growing feature, rather it evolves continuously under the influence of particle re-energisation activities due to shocks. To further validate this fact, we show the maximum Lorentz factor (γmax) distribution of the non-thermal electrons at a time 3.78 Myr in Fig. 12. We expect the initial γmax value (1010) of the particle distribution will eventually reduce with time due to the presence of radiative and adiabatic losses that we considered in our simulations. However, in the presence of shocks, at the shock acceleration sites, particle spectra will be flat with an increased γmax compared to that expected from a particle that has never been shock accelerated (Borse et al. 2021; Mukherjee et al. 2021). Due to the accumulation of older particles in the wings, the γmax distribution generally shows somewhat lower values than the lobes. However, the presence of several high γmax regions observed in the wings indicates the ongoing re-energising activities. Here, the possible origin of shocks can be attributed to ongoing super-sonic turbulence in the wing due to the diverted back-flow from the lobes. To show the correlation between this γmax distribution and the obtained α-map, we compared Fig. 12 with Fig. 8, which we obtained from the same simulation (3Dmaj_ref) and at the same time (3.78 Myr), representing a similar morphology. Considering the active lobe of the structure, the particles are energised in the terminal shocks and begin to cool as they back-flow towards the centre without much re-acceleration. Some particles are even trapped in the jet side edges and evolve under the dominant cooling processes, reducing their γmax values significantly. As a consequence, we see near the jet leading edges the spectral index values become flat, and it is steepening in the side edges of the jet. Also, as we move towards the centre from the jet head, the α values gradually become steep. In the secondary lobes, however, in a typically steeper α distribution (owing to the accumulation of cooled particles), we see flatter α patches are in formation, governed by the shock accelerations whose strength determines the α values.
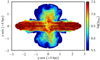 |
Fig. 12. Distribution of maximum Lorentz factors (γmax) of non-thermal electrons of the radio structure at a time of 3.78 Myr. This projected distribution (projected on y–z plane) provides evidence of re-energisation activities in the wings due to shock acceleration. For visualisation, we put limit in the colour bar. |
To further quantify the distribution shown in Fig. 12, we separated out the lobe and wing particles following the process highlighted in Sect. 4.2 (particles in the overlapping region are excluded). We then plotted a histogram of γmax values of these particles, which is shown in Fig. 13. The histogram confirms the fact discussed above with wing particles peaking at ∼105.5 in comparison to the lobe particles that peak at ∼107.7. For the lobe distribution, we see a few particles with γmax values of 1010, indicating recently injected particles that still carry the injection spectra. Whereas, most of the lobe particles have started to show cooling effects, resulting in a peak near 107.7. For the wing particles, we see broadening of the distribution with the appearance of a high γmax tail (extending up to 107.7) indicating mixing of particles that have different evolutionary histories (see Mukherjee et al. 2021). We further elaborate on this in Sect. 5.2. The high γmax tail of the wing distribution in Fig. 13 is particularly interesting as they carry the signatures of particle re-acceleration processes that are generated due to diffusive shocks in the wings.
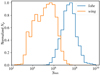 |
Fig. 13. Histogram showing the maximum Lorentz factor distribution (γmax) of lobe and wing particles (considered without contamination) obtained at a time of 3.78 Myr. The vertical axis represents normalised number of particles (Np). We see a lower γmax peak for wing distribution in comparison to the lobe that peaks near 107.7. The wing distribution also shows a spread in values with a high γmax tail (extending up to ∼107.7), providing evidence of re-energisation activities in the wings due to diffusive shocks. |
To quantify the impact of shock acceleration, we analysed the number of shocks that the particles have encountered (in the lobe and wings, obtained without contamination) with their corresponding γmax values at 3.78 Myr. Since the streamlines of some particles have not crossed a strong shock while being advected with the fluid, the particles involved in this analysis represent a sub-sample of particles involved in Fig. 13. Such a distribution showcases the history of particle since its injection into the numerical domain. This distribution is represented via a 2D-histogram in Fig. 14, where we show only the particles that are in the wings. We found that the lobe particles have higher γmax values, and the number of shocks they encountered is lower (≤2). Conversely, a significant number of wing particles have undergone multiple shocks (≥2) in their lifetime and show a γmax distribution peaking at ∼104.5, as can be seen in Fig. 14. This again affirms the role of shock acceleration in re-energising particles in the wings, which plays a crucial role in keeping the wing structure active during the evolution time.
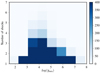 |
Fig. 14. 2D PDF of number of shocks that the wing particles have encountered vs. their corresponding γmax values. We see that significant wing particles have experienced a greater number of shocks than the lobes (≤2), providing hint of ongoing re-energisation activities in the wings. The corresponding colour bar represents the number of particles that are distributed in the bins, where we impose a visualisation limit. |
We further show the effect of re-energisation via diffusive shocks on particle spectra of two wing particles explicitly in Fig. 15. The figure represents the time evolution of γmax values for such wing particles which have undergone multiple shocks (≥4) in their lifetime. The strength of these shocks are found to be of moderate to weak (i.e. compression ratio < 3). We see an initial steep fall of γmax values from 1010 (initial) to 103–104 due to the dominant cooling effects. However, after ∼0.7 Myr, these particles undergo multiple shocks that result in the secondary peak observed in Fig. 15. The cooling processes affect the radio galaxy throughout the time and so, once the particles cross the shock locations, they again start to cool down. As a result, the γmax values again start to reduce after ∼1.3 Myr and 1.7 Myr for particles 1 (red curve) and 2 (blue curve), respectively. The cooling is mostly governed by radiative process; however, the role of adiabatic effect cannot be ignored. The small-scale dips found in Fig. 15 are mainly due to dominant adiabatic cooling. From this exercise, we elaborately show the significance of diffusive shocks in pausing the drastic cooling of radiating electrons in the wings that keep the structure active despite their ageing with time.
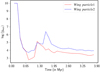 |
Fig. 15. Time evolution of maximum Lorentz factor (γmax) of two wing particles that have undergone multiple shocks in their lifetime (≥4). The corresponding compression ratios suggest that the shocks are mostly moderate to weak in strength, which is responsible for the secondary peak as shown above. Despite this, the final γmax values have reduced significantly from their initial stage. |
5.2. On equipartition approximation
An imprint of particle acceleration due to diffusive shocks is also reflected on the equipartition approximation. While measuring the strength of the magnetic field from direct observation of synchrotron radiation of radio galaxies, it is often assumed that the radiating electrons are in equipartition with the magnetic energy density of the cocoon. This minimum energy condition has also been applied to XRGs while quantifying several physical aspects of it (Hodges-Kluck et al. 2010; Cotton et al. 2020). The equipartition condition can be written in cgs units as (Hardcastle et al. 2002)
where Ue represents the electron energy density, N(γ)dγ is the non-thermal electron number density between Lorentz factor γ to γ + dγ, mec2 is the rest mass energy of electron, and Beq is the equipartition magnetic field strength. Using Eq. (11), we evaluated the Beq for the lobe and wing particles separately (without considering overlapping region; Sect. 4.2).
In Fig. 16, we represent a 2D PDF showing the distribution of  versus γmax for these particles at 2.6 Myr (top) and 3.78 Myr (bottom). The particles that belong to the lobes are marked within the black dashed box, while the rest belong to the wing. The dynamical magnetic field evaluated at the particle’s position is denoted by Bdyn such that Bdyn = Beq represents equipartition. All particles are injected to have an initial sub-equipartition condition (i.e. Beq = 0.01Bdyn) (see Sect. 2.2). Figure 16 evidently shows particles that exist within the wings can be distinguished into three stripes, that is S1, S2, and S3.
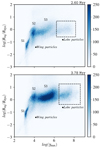 |
Fig. 16. 2D PDF of Beq/Bdyn vs. γmax of the particles that are in the lobe and in the wing, obtained at a time of 2.6 Myr (top) and 3.78 Myr (bottom). The particles inside the black dashed box are associated with lobes, outside of which are the wing particles. The figure shows that most of the particles have acquired a near-equipartition stage, i.e. Beq ≈ Bdyn, while a few have also deviated from it. Stripes 1, 2, and 3 (i.e. S1, S2, S3) marked in the figure are associated with three types of particles that are found in the wings, which indicate several micro-physical processes occurring in the wing (see Sect. 5.2 for details). The corresponding colour bar represents the number of particles that are distributed in the bins where we set a visualisation limit. |
We first consider the figure plotted at 3.78 Myr (Fig. 16). Particles associated with stripe S1 are the oldest of particles injected into the domain at a very early time and have now radiated away all their energy resulting in γmax ∼ 103. The majority of the wing particles belong to stripes S2 and S3 and have acquired a near equipartition stage, i.e. Beq ≈ Bdyn. Their γmax values range from 104 to 106. The wing particles that belong to stripe S3 have a synchrotron cooling time ≤ 1.7 Myr for an average B-field strength of 12 μG obtained for the radio galaxy. This estimated time is an upper limit as particles have also spent some of their journey in the lobes, where B-field strengths are typically higher. We verified that the majority of particles in stripe S3 spent more than 1.7 Myr there since their injection. In the absence of any particle acceleration process, one would have expected these particles to cool and populate the S1 stripe with lower γmax and Beq < Bdyn; instead, these particles have near equipartition field strength, implying that shock acceleration in the turbulent wings played a role in altering their non-thermal radiation through re-energisation. Such re-energisation of the non-thermal electrons is mostly due to moderate to weak shocks as seen in our simulations. The particles associated with stripe S2 are injected in the domain around a simulation time of 1.4 Myr. They consist of both the cooling and shocked populations. The shocked particles have undergone through multiple shocks in their initial stage of evolution but are now cooling down without any recent acceleration event (see Fig. 15).
Furthermore, to illustrate that the above-mentioned mechanisms maintain a population of high energetic particles in the wing with time, we now compare the plot shown at 3.78 Myr with the plot at 2.60 Myr of Fig. 16. Considering the wing particles, we see their equipartition condition upgrading to higher values with time. In the S1 patch, however, the γmax values reduce with time (contrary to the S2 and S3 patches), indicating that it is only the reduction of dynamical magnetic field value (Bdyn) in the cocoon (due to the adiabatic expansion) that governs its equipartition condition. These are the oldest injected particles in the domain and are now cooling down under the dominant cooling effects. So, we see particles with limited or no re-acceleration events would exhaust their energy via cooling, resulting in γmax ∼ 103 and hence emission in ∼MHz range (critical synchrotron frequency). In this regard, the S2 and S3 patch particles show a systematic shift towards higher γmax values with time, and the patches are diffused with a greater number of particles, indicating the continuous filling of highly energetic particles in the wings with time. Particle re-acceleration via diffusive shocks (as discussed earlier) and particle mixing of different aged populations (Mukherjee et al. 2021) are the two leading mechanisms behind the observed characteristics of these patches, which plays a crucial role in maintaining a highly energetic particle population in the wing. Since wing particles show a distribution peaking at γmax ∼ 104.5 (Fig. 14), they would strongly contribute to higher radio frequencies (∼GHz range) and hence flatten the spectrum, as we obtained.
Our analysis regarding the evolution of equipartition condition also applies to the radio galaxies in general. Evidence of this can be found in Fig. 16, which shows that the majority of lobe particles have acquired the equipartition state, although they have been injected into the numerical domain with an initial sub-equipartition condition (Sect. 2.2). Although the number of shocks encountered by the lobe particles is lower compared to the wing particles (Fig. 14), the strength of these shocks is high, which is one of the reasons for upgrading the equipartition condition of these particles. At the same time, the cooling processes also affect the particle spectra, as can be seen in Fig. 15, which are capable of reducing the initial γmax value drastically from 1010. Governed by the combined effect of cooling and re-energisation, the equipartition condition of the non-thermal particles in the lobe will evolve, and hence its effect on spectral age will be imparted (discussed further in this section). We note here that the ongoing supersonic turbulence due to the diverted back-flow from the lobe is one of the prime mechanisms responsible for re-energising the wing particles. In the lobes, however, particles can be energised at the sites of re-collimation, termination, shear interface of the jet, as well as in the turbulent back-flows (Borse et al. 2021; Mukherjee et al. 2021).
As indicated earlier, the equipartition condition also varies with time. Here, we considered the contribution from all the particles injected into the computational domain (i.e. of the entire structure) and estimated  . This magnetic field ratio at simulation times of 1.04 Myr and 3.78 Myr is represented as histograms in Fig. 17. Following the initial condition discussed in Sect. 2.2, one would expect a peaked distribution as Beq = 0.01Bdyn at time t = 0. With time, we observe that the distrbution is diffused and also the peak is shifted to a higher value of magnetic field ratio. At the final time of 3.78 Myr, we find that the peak value corresponds to near-equipartition stage (Beq ≈ Bdyn) after a systematic shift of one order of magnitude in its value at 1.04 Myr. Additionally, at 3.78 Myr, we also have very few particles with a magnetic field ratio > 100. This trend indicates that over time the magnetic field ratio may alter, particularly if the system is allowed to evolve for a much longer time.
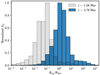 |
Fig. 17. Histograms showing the distribution of Beq/Bdyn for all the particles distributed over the domain at a simulation time (t) of 1.04 Myr and 3.78 Myr. The vertical axis represents the normalised number of particles (Np). A clear shift in the peak value of the histogram can be observed here as the galaxy ages. However, at 3.78 Myr the majority of particles show that the radio structure as a whole has achieved a near equipartition stage (Beq ≈ Bdyn). |
Synchrotron cooling depends strongly on the B-field; a small deviation from the equipartition condition of a radio galaxy can lead to a significant difference between spectral and dynamical age (Mahatma et al. 2020). This in turn can affect the estimation of other parameters (e.g., the luminosity and jet kinetic power). The study led by Hodges-Kluck et al. (2010) also showed disagreement between spectral and dynamical age in the context of an X-shaped radio galaxy. Additionally, Kraft et al. (2005) showed a spatial variation of equipartition condition for XRG 3C 403 by measuring X-ray emission in the lobe and wings, which can have sigificant influence on age estimation. The disparity in the validity of the equipartition condition from observations (see also Croston et al. 2005) further asserts that this approximation is dynamic and has its own limitations in extending for estimating age.
For our case, the dynamical age of the radio structure is obtained as the age up to which the simulation has been conducted (t). The corresponding spectral age for an equipartition magnetic field strength Beq is evaluated as
where Beq is expressed in units of nT, z represents the redshift of the source adopted to be 0.05, BCMB = 0.318(1 + z)2 is the magnetic field equivalent to cosmic microwave background radiation in nT, and vb is the break frequency in GHz (Kardashev 1962; Miley 1980; Pandge et al. 2022). The spectral age can therefore be estimated using equipartition field strength (Beq) and break frequency vb. For t = 1.04 Myr, we obtain a density weighted-average dynamical magnetic field (Bdyn) of the radio galaxy of 8.4 nT. This corresponds to an equipartition field strength (Beq) of 0.5 nT. This is estimated from Fig. 17 using the obtained median value of 0.06 of the  distribution. We also find no significant break in the emission spectrum of our galaxy up to the frequency 43 GHz at this early simulation time. Assuming 43 GHz as the break frequency, the spectral age is obtained as 14.2 Myr, giving
  . This estimate is an upper limit as the spectral age would be slightly less than the obtained value for a higher vb. At t = 3.84 Myr, we obtain
  for an average Bdyn field strength of 1.2 nT (Beq = 1.393Bdyn; 1.393 is the median value of
  distribution at this time (Fig. 17)) and vb of 5 GHz for our structure. This clearly shows that the discrepancy in the dynamical and spectral age reduces noticeably if the equipartition magnetic field strength approaches the dynamical magnetic field strength of the radio galaxy. Our result is consistent with the findings of Mahatma et al. (2020). The discrepancy factor of 2.5 (obtained when the galaxy is in near-equipartition state) between the spectral and dynamical age can be attributed to the mixing of different aged particle populations with different evolution histories as suggested by Mahatma et al. (2020). A signature of this blending in our case is demonstrated in Fig. 16 (see Sect. 5). The mixing of different particle populations is expected due to turbulence, particularly at the shear interface, which can alter the total particle spectrum when averaged over a particular area (Mukherjee et al. 2021). Such a change in particle spectra can affect the spectral age and results in a factor of a few discrepancies in the spectral or dynamical age discrepancy, as was demonstrated by Turner et al. (2018).
One thing to note here is that our simulated radio structure is still in its initial stage of evolution, and the near-equipartition stage achieved for the radio galaxy is at a dynamical time of 3.78 Myr. Looking at the evolution trend of  , we expect the ratio to peak at a higher value if the structure evolves for a much longer time as also stated earlier. This will raise a spectral age of the radio galaxy, which would be less than its dynamical age, as is typically the case found in observational studies. However, the exact evolutionary behaviour of
  in the longer time regime is yet to be explored and should be the subject of further studies.
In summary, our results and analysis indicate that the equipartition condition is a rather dynamic process that not only varies with time but also has spatial dependence within the radio galaxy. The acceleration of particles due to multiple shocks in the turbulent wing structures and also in the lobes have a vital role to play in governing the maximum particle energy, particle spectral index, and equipartition field strength, and therefore they have implications on the age estimation.
6. Summary
We performed relativistic magneto-hydrodynamic simulations of jet propagation from a tri-axial galaxy to understand the formation of X-shaped radio galaxies based on the Back-flow model. We affirm the role of pressure gradient of the ambient and hence the jet ejection direction in forming the X-shaped morphology as suggested by Capetti et al. (2002). We considered two principle cases from Rossi et al. (2017) involving the jet being ejected along the major axis of the galaxy and at an angle of 30° to the major axis of the galaxy in order to investigate their dynamical and emission perspective in detail. To understand the effect of back-flow on the emission signatures, we modelled the non-thermal emission using a hybrid approach considering the role of the diffusive shock acceleration (DSA) and the radiative and adiabatic cooling on particle spectral evolution. Using such a hybrid approach, one can obtain a detailed understanding of radiative processes in wings and lobe through the synthetic emission maps which was missing from the previously adopted fixed spectrum approach by Rossi et al. (2017). Furthermore, the adopted hybrid approach including the effects of diffusive shock acceleration allows us to comprehend the impact of shocks in particle energetics and spectral signatures, particularly in the wing region, which is typically comprised of older particles.
The main results from the present work can be summarised as follows
Lobe and wing formation. The spatial extent of the wing and the lobe depends strongly on the direction of jet flow. When the jet travels along the major axis of the galaxy, broader wings with a prominent X-shape appear with it. Whereas, when it travels at an angle to the major axis of the galaxy, the prominence of the formed structure decreases due to the appearance of higher lobe length for this case. Moreover, we see asymmetry in the wing formation i.e. the bending of back-flowing materials before reaching the centre in the angled jet case, whose morphological relevance can be found in several observed XRGs. Owing to a value of βpl ≫ 1, the wings expand as thermal pressure dominated flow.
The lobe length follows the analytical estimates of a 1D jet flow up to 0.9 Myr and later deviates and lags behind the analytical value due to lateral expansion, consistent with the results from Rossi et al. (2017).
Spectral index and viewing angle. The synthetic intensity maps in radio bands obtained with different viewing angles are qualitatively similar in terms of morphology observed in X-shaped radio galaxies. Owing to variation in the viewing angle, one also finds synthetic maps with wider wings as compared to the active lobes.
The synthetic spectra up to the optical B band show a typical peaked structure with the spectral peak around 1.4 GHz, as expected due to synchrotron emission. The associate spectral index (α) map of the galaxy infers that the wings generally show steeper spectral index distribution owing to the concentration of older particles (sufficiently cooled). However, there are significant patches of flatter α values that are generated due to re-energised particles at shocks. Moreover, this distribution depends on the choices of frequencies; that is to say, when wider frequencies are chosen, the obtained values become more and more steeper in the wings. Based on this and the viewing effect, we quantified  =
=  –
–  and find that the back-flow model is capable of producing values that span both in the +ve and −ve sides. However, we show that this is true only for frequencies that lie in the rising phase of the SED (up to the peak), whereas for higher frequencies, the obtained
  values are prone to have a +ve distribution due to the cooling of particles. Additionally, the projected size (viewing angle) of the structure also influences the trend of
  values. This degeneracy in the estimate of
  value indicates that such a measure is not sufficient to identify and uniquely determine the formation mechanism of XRGs.
Particle evolution and equipartition. The non-thermal electron population, initially distributed according to a power law, undergoes cooling due to the radiative (major influence) and adiabatic losses right after their injection into the domain. In this regard, the diffusive shock acceleration re-energises these particles and counters the effect of cooling in particle spectra. We show that this has a significant role to play in wing emission where the shocks pause the drastic cooling of particles that eventually keep the wing structure active during the evolution time. We find the accumulation of three types of particles in the wing that together governs its evolution. These are: (a) the old cooling particles, (b) freshly shocked particles, and (c) particles that have undergone shocks at their early stage but now are cooling.
Using the hybrid framework, we also compared equipartition magnetic field Beq with dynamical magnetic fields Bdyn. During the course of evolution, the majority of particles show a systematic shift from an initial sub-equipartition population Beq < Bdyn to near equipartition due to consistent evolution of particle distribution in presence of radiative losses from local magnetic fields and diffusive shock acceleration. This analysis indicates that equipartition between the radiating and magnetic energy is rather a dynamic process that evolves with time. Such an evolution has a significant impact on the estimate of age of the radio galaxies and observed discrepancy between spectral and dynamical age (Mahatma et al. 2020). We also have elaborated the effect of different aged particle population mixing in the dynamical and spectral age discrepancy, which one must take into consideration while estimating spectral age from radio observations.
The present study showcases the role of back-flow in forming X-shaped radio galaxies along with its emission signature from the hybrid modelling of non-thermal particles. The focus of this work has only been on the initial formation phase of XRGs. Our model demonstrates several characteristic features that are the possible origin of the XRG structures observed at much larger scales. We see that the adopted back-flow model with a combined effect of viewing angle and multi-band spectral maps can explain the observed features of XRGs. However, one would need to affirm the universality of this model in formation of XRGs using large-scale and long-term simulations (Hodges-Kluck & Reynolds 2011). Additionally, it would be interesting to understand the interplay of turbulence and shock acceleration (Kundu et al. 2021) in wings and its impact on the radiative signature. These studies, along with adopting competing formation models, will be discussed in forthcoming papers.
Acknowledgments
The authors thank Alessandro Capetti for providing valuable suggestions and comments. G.G. is supported by Prime Minister’s Research Fellowship and thank the financial support provided. B.V. is leading a Max Planck Partner Group at Indian Institute of Technology Indore would like to thank The Council of Scientific & Industrial Research (CSIR) [03(1435)/18/EMR-II]. Numerical simulations presented in this work are carried out using facilities at Indian Institute of Technology Indore and MPG Super-computing Cobra cluster https://www.mpcdf.mpg.de/services/supercomputing/cobra.
References
- Bassani, L., Venturi, T., Molina, M., et al. 2016, MNRAS, 461, 3165 [Google Scholar]
- Begelman, M. C., Blandford, R. D., & Rees, M. J. 1980, Nature, 287, 307 [Google Scholar]
- Bera, S., Pal, S., Sasmal, T. K., & Mondal, S. 2020, ApJS, 251, 9 [NASA ADS] [CrossRef] [Google Scholar]
- Borse, N., Acharya, S., Vaidya, B., et al. 2021, A&A, 649, A150 [NASA ADS] [CrossRef] [EDP Sciences] [Google Scholar]
- Bromberg, O., Nakar, E., Piran, T., & Sari, R. 2011, ApJ, 740, 100 [NASA ADS] [CrossRef] [Google Scholar]
- Bruni, G., Brienza, M., Panessa, F., et al. 2021, MNRAS, 503, 4681 [Google Scholar]
- Capetti, A., Zamfir, S., Rossi, P., et al. 2002, A&A, 394, 39 [NASA ADS] [CrossRef] [EDP Sciences] [Google Scholar]
- Cavaliere, A., & Fusco-Femiano, R. 1976, A&A, 500, 95 [NASA ADS] [Google Scholar]
- Cheung, C. C. 2007, AJ, 133, 2097 [NASA ADS] [CrossRef] [Google Scholar]
- Cotton, W. D., Thorat, K., Condon, J. J., et al. 2020, MNRAS, 495, 1271 [NASA ADS] [CrossRef] [Google Scholar]
- Croston, J. H., Hardcastle, M. J., Harris, D. E., et al. 2005, ApJ, 626, 733 [NASA ADS] [CrossRef] [Google Scholar]
- Dabhade, P., Mahato, M., Bagchi, J., et al. 2020, A&A, 642, A153 [NASA ADS] [CrossRef] [EDP Sciences] [Google Scholar]
- Dedner, A., Kemm, F., Kröner, D., et al. 2002, J. Comput. Phys., 175, 645 [Google Scholar]
- Dennett-Thorpe, J., Scheuer, P. A. G., Laing, R. A., et al. 2002, MNRAS, 330, 609 [NASA ADS] [CrossRef] [Google Scholar]
- Ekers, R. D., Fanti, R., Lari, C., & Parma, P. 1978, Nature, 276, 588 [NASA ADS] [CrossRef] [Google Scholar]
- Fanaroff, B. L., & Riley, J. M. 1974, MNRAS, 167, 31P [Google Scholar]
- Garofalo, D., Joshi, R., Yang, X., et al. 2020, ApJ, 889, 91 [NASA ADS] [CrossRef] [Google Scholar]
- Gillone, M., Capetti, A., & Rossi, P. 2016, A&A, 587, A25 [NASA ADS] [CrossRef] [EDP Sciences] [Google Scholar]
- Gopal-Krishna, Biermann, P. L., & Wiita, P. J. 2003, ApJ, 594, L103 [NASA ADS] [CrossRef] [Google Scholar]
- Gopal-Krishna, Biermann, P. L., Gergely, L. Á., & Wiita, P. J. 2012, Res. Astron. Astrophys., 12, 127 [NASA ADS] [CrossRef] [Google Scholar]
- Gull, S. F., & Northover, K. J. E. 1973, Nature, 244, 80 [NASA ADS] [CrossRef] [Google Scholar]
- Hardcastle, M. J., Birkinshaw, M., Cameron, R. A., et al. 2002, ApJ, 581, 948 [Google Scholar]
- Hardcastle, M. J., Croston, J. H., Shimwell, T. W., et al. 2019, MNRAS, 488, 3416 [Google Scholar]
- Hodges-Kluck, E. J., & Reynolds, C. S. 2011, ApJ, 733, 58 [NASA ADS] [CrossRef] [Google Scholar]
- Hodges-Kluck, E. J., Reynolds, C. S., Miller, M. C., & Cheung, C. C. 2010, ApJ, 717, L37 [NASA ADS] [CrossRef] [Google Scholar]
- Horton, M. A., Krause, M. G. H., & Hardcastle, M. J. 2020, MNRAS, 499, 5765 [NASA ADS] [CrossRef] [Google Scholar]
- Huber, D., Kissmann, R., Reimer, A., & Reimer, O. 2021, A&A, 646, A91 [NASA ADS] [CrossRef] [EDP Sciences] [Google Scholar]
- Ignesti, A., Shimwell, T., Brunetti, G., et al. 2020, A&A, 643, A172 [NASA ADS] [CrossRef] [EDP Sciences] [Google Scholar]
- Jones, T. W., Ryu, D., & Engel, A. 1999, ApJ, 512, 105 [NASA ADS] [CrossRef] [Google Scholar]
- Joshi, R., Krishna, G., Yang, X., et al. 2019, ApJ, 887, 266 [NASA ADS] [CrossRef] [Google Scholar]
- Kardashev, N. S. 1962, Sov. Astron., 6, 317 [NASA ADS] [Google Scholar]
- Kraft, R. P., Hardcastle, M. J., Worrall, D. M., & Murray, S. S. 2005, ApJ, 622, 149 [NASA ADS] [CrossRef] [Google Scholar]
- Kundu, S., Vaidya, B., & Mignone, A. 2021, ApJ, 921, 74 [NASA ADS] [CrossRef] [Google Scholar]
- Lal, D. V., & Rao, A. P. 2007, MNRAS, 374, 1085 [NASA ADS] [CrossRef] [Google Scholar]
- Lal, D. V., Sebastian, B., Cheung, C. C., & Pramesh Rao, A. 2019, AJ, 157, 195 [NASA ADS] [CrossRef] [Google Scholar]
- Leahy, J. P., & Williams, A. G. 1984, MNRAS, 210, 929 [CrossRef] [Google Scholar]
- Mahatma, V. H., Hardcastle, M. J., Croston, J. H., et al. 2020, MNRAS, 491, 5015 [Google Scholar]
- Martí, J. M., Müller, E., Font, J. A., Ibáñez, J. M. Z., & Marquina, A. 1997, ApJ, 479, 151 [Google Scholar]
- Matthews, J. H., Bell, A. R., Blundell, K. M., & Araudo, A. T. 2019, MNRAS, 482, 4303 [NASA ADS] [CrossRef] [Google Scholar]
- Merritt, D., & Ekers, R. D. 2002, Science, 297, 1310 [NASA ADS] [CrossRef] [Google Scholar]
- Mignone, A., & Bodo, G. 2006, MNRAS, 368, 1040 [Google Scholar]
- Mignone, A., Plewa, T., & Bodo, G. 2005, ApJS, 160, 199 [CrossRef] [Google Scholar]
- Mignone, A., Bodo, G., Massaglia, S., et al. 2007, ApJS, 170, 228 [Google Scholar]
- Mignone, A., Ugliano, M., & Bodo, G. 2009, MNRAS, 393, 1141 [NASA ADS] [CrossRef] [Google Scholar]
- Miley, G. 1980, ARA&A, 18, 165 [Google Scholar]
- Mukherjee, D., Bodo, G., Rossi, P., Mignone, A., & Vaidya, B. 2021, MNRAS, 505, 2267 [NASA ADS] [CrossRef] [Google Scholar]
- Müller, A., Pfrommer, C., Ignesti, A., et al. 2021, MNRAS, 508, 5326 [CrossRef] [Google Scholar]
- Natarajan, P., & Armitage, P. J. 1999, MNRAS, 309, 961 [NASA ADS] [CrossRef] [Google Scholar]
- Ogrodnik, M. A., Hanasz, M., & Wóltański, D. 2021, ApJS, 253, 18 [CrossRef] [Google Scholar]
- Pandge, M. B., Kale, R., Dabhade, P., Mahato, M., & Raychaudhury, S. 2022, MNRAS, 509, 1837 [Google Scholar]
- Rossi, P., Bodo, G., Capetti, A., & Massaglia, S. 2017, A&A, 606, A57 [NASA ADS] [CrossRef] [EDP Sciences] [Google Scholar]
- Rottmann, H. 2001, PhD Thesis, University Bonn [Google Scholar]
- Saripalli, L., & Roberts, D. H. 2018, ApJ, 852, 48 [NASA ADS] [CrossRef] [Google Scholar]
- Saripalli, L., & Subrahmanyan, R. 2009, ApJ, 695, 156 [NASA ADS] [CrossRef] [Google Scholar]
- Smolčić, V., Schinnerer, E., Finoguenov, A., et al. 2007, ApJS, 172, 295 [CrossRef] [Google Scholar]
- Taub, A. H. 1948, Phys. Rev., 74, 328 [NASA ADS] [CrossRef] [Google Scholar]
- Turner, R. J., Rogers, J. G., Shabala, S. S., & Krause, M. G. H. 2018, MNRAS, 473, 4179 [NASA ADS] [CrossRef] [Google Scholar]
- Vaidya, B., Mignone, A., Bodo, G., Rossi, P., & Massaglia, S. 2018, ApJ, 865, 144 [Google Scholar]
- Winner, G., Pfrommer, C., Girichidis, P., & Pakmor, R. 2019, MNRAS, 488, 2235 [Google Scholar]
All Tables
All Figures
|
Fig. 1. Distribution of density along major, intermediate, and minor axis of the tri-axial ellipsoidal galaxy is shown here (in the initial phase), where the value of ρ0 is 1 amu/cc. |
| In the text | |
|
Fig. 2. 3D representative image showing the line of sight visualisation angle (θ, ϕ) used in our study to get the synchrotron emissivity (and hence the intensity) along that direction. The major, intermediate, and minor axes of the central ellipsoidal galaxy are labelled here just to represent the relative configuration of the tri-axial ambient, where they shift slightly based on our different runs. |
| In the text | |
|
Fig. 3. Dynamical characteristics showing the formation of a wing-lobe structure for case 3Dmaj_ref. Left: 2D slice of our simulated 3D structure (at x = 0) representing the density distribution in the y − z plane. The formation of a prominent wing structure along the z-axis can be observed here. Right: velocity-distribution map (vy) of the bi-directional jet, representing the same structure as the left one but viewed at an angle to the jet ejection axis. Both of these structures have a dynamical age of 3.91 Myr. The measure of velocity, density, and length are represented here with respect to the light speed (c), unit density (ρ0 i.e. 1 amu/cc), and unit length ( |
| In the text | |
|
Fig. 4. Comparison of the theoretical estimation of lobe length with our simulated lobe length obtained for the run 3Dmaj_ref is shown. The time evolution of the wing lengths along the intermediate axis (i.e. along the x-axis) and the minor axis (i.e. along the z-axis) along with the comparison with the high resolution 3D run (3Dmaj_high) are also overlaid. The caption ref_res used here for the run 3Dmaj_ref and high_res for the run 3Dmaj_high. |
| In the text | |
|
Fig. 5. Time evolution of plasma-β (βpl) for all of our runs showing a gradual increasing nature throughout. The values of it obtained are much higher than unity indicating the presence of a thermally over-pressured cocoon. |
| In the text | |
|
Fig. 6. Density distribution (log ρ) of run 3Dang_ref in the plane y–z (left) and y–x (right) showing the wing formation along the z and x axis respectively. The asymmetry in wing formation i.e. the bending of back-flowing materials before reaching centre can be seen here along the x-axis, whose morphological relevance is discussed in Sect. 3.2. The dynamical age of this structure is 3.91 Myr. Here lengths are defined with respect to 4 kpc. |
| In the text | |
|
Fig. 7. Intensity maps (log I in Jy arcsec−2) obtained for the run 3Dmaj_ref are highlighted in this image for five line-of-sight angles; i.e. (θ = 70° ,ϕ = 0°), (θ = 20° ,ϕ = 70°), (θ = 45° ,ϕ = 45°), (θ = 70° ,ϕ = 45°), and (θ = 70° ,ϕ = 70°) for the first, second, third, fourth, and fifth rows, respectively (from top), at a time of 3.78 Myr. We used a separate colour bar for the optical image to highlight the small-scale variation in the intensity distribution. It is evident from figure that the relative extent of the active lobes and the wings depend on the viewing effect. The measure of ΔRA and ΔDec here are in arcseconds. |
| In the text | |
|
Fig. 8. Spectral index distribution (α) of the radio structure obtained for the run 3Dmaj_ref is shown. Here, wings show steep spectral index compared to the active lobes due to the accumulation of older particles. However, the presence of several flatter α patches are also noticeable (especially in the wings), which are generated due to re-energised particles at shock sites. The frequencies used here to produce this map are 240 MHz and 5 GHz. |
| In the text | |
|
Fig. 9. Distribution of spectral index (α) values for different frequency choices for the case of 3Dang_ref is shown here for a line-of-sight angle of (70° ,0°). The frequencies used to generate these maps are 0.240–0.610 GHz (left), 0.240–5.0 GHz (middle), and 5.0–43.0 GHz (right), respectively. The steepening of α values with increasing frequency choices in the wings is expected due to synchrotron cooling. The presence of flatter α patches (particularly in the wings) are prominent if the chosen frequencies are in the low-frequency regime (indication of particle re-energisation). |
| In the text | |
|
Fig. 10. Spectral energy distribution (vLv: Lv is specific luminosity) of our simulated XRGs in seven synchrotron frequencies are represented here. A low frequency hump, peaking at 1.4 GHz, is prominent in the image for both of our 3D cases. |
| In the text | |
|
Fig. 11. Representation of the regions identified as wing and lobe for evaluating the quantity |
| In the text | |
|
Fig. 12. Distribution of maximum Lorentz factors (γmax) of non-thermal electrons of the radio structure at a time of 3.78 Myr. This projected distribution (projected on y–z plane) provides evidence of re-energisation activities in the wings due to shock acceleration. For visualisation, we put limit in the colour bar. |
| In the text | |
|
Fig. 13. Histogram showing the maximum Lorentz factor distribution (γmax) of lobe and wing particles (considered without contamination) obtained at a time of 3.78 Myr. The vertical axis represents normalised number of particles (Np). We see a lower γmax peak for wing distribution in comparison to the lobe that peaks near 107.7. The wing distribution also shows a spread in values with a high γmax tail (extending up to ∼107.7), providing evidence of re-energisation activities in the wings due to diffusive shocks. |
| In the text | |
|
Fig. 14. 2D PDF of number of shocks that the wing particles have encountered vs. their corresponding γmax values. We see that significant wing particles have experienced a greater number of shocks than the lobes (≤2), providing hint of ongoing re-energisation activities in the wings. The corresponding colour bar represents the number of particles that are distributed in the bins, where we impose a visualisation limit. |
| In the text | |
|
Fig. 15. Time evolution of maximum Lorentz factor (γmax) of two wing particles that have undergone multiple shocks in their lifetime (≥4). The corresponding compression ratios suggest that the shocks are mostly moderate to weak in strength, which is responsible for the secondary peak as shown above. Despite this, the final γmax values have reduced significantly from their initial stage. |
| In the text | |
|
Fig. 16. 2D PDF of Beq/Bdyn vs. γmax of the particles that are in the lobe and in the wing, obtained at a time of 2.6 Myr (top) and 3.78 Myr (bottom). The particles inside the black dashed box are associated with lobes, outside of which are the wing particles. The figure shows that most of the particles have acquired a near-equipartition stage, i.e. Beq ≈ Bdyn, while a few have also deviated from it. Stripes 1, 2, and 3 (i.e. S1, S2, S3) marked in the figure are associated with three types of particles that are found in the wings, which indicate several micro-physical processes occurring in the wing (see Sect. 5.2 for details). The corresponding colour bar represents the number of particles that are distributed in the bins where we set a visualisation limit. |
| In the text | |
|
Fig. 17. Histograms showing the distribution of Beq/Bdyn for all the particles distributed over the domain at a simulation time (t) of 1.04 Myr and 3.78 Myr. The vertical axis represents the normalised number of particles (Np). A clear shift in the peak value of the histogram can be observed here as the galaxy ages. However, at 3.78 Myr the majority of particles show that the radio structure as a whole has achieved a near equipartition stage (Beq ≈ Bdyn). |
| In the text | |
Current usage metrics show cumulative count of Article Views (full-text article views including HTML views, PDF and ePub downloads, according to the available data) and Abstracts Views on Vision4Press platform.
Data correspond to usage on the plateform after 2015. The current usage metrics is available 48-96 hours after online publication and is updated daily on week days.
Initial download of the metrics may take a while.