Fig. 8.
Download original image
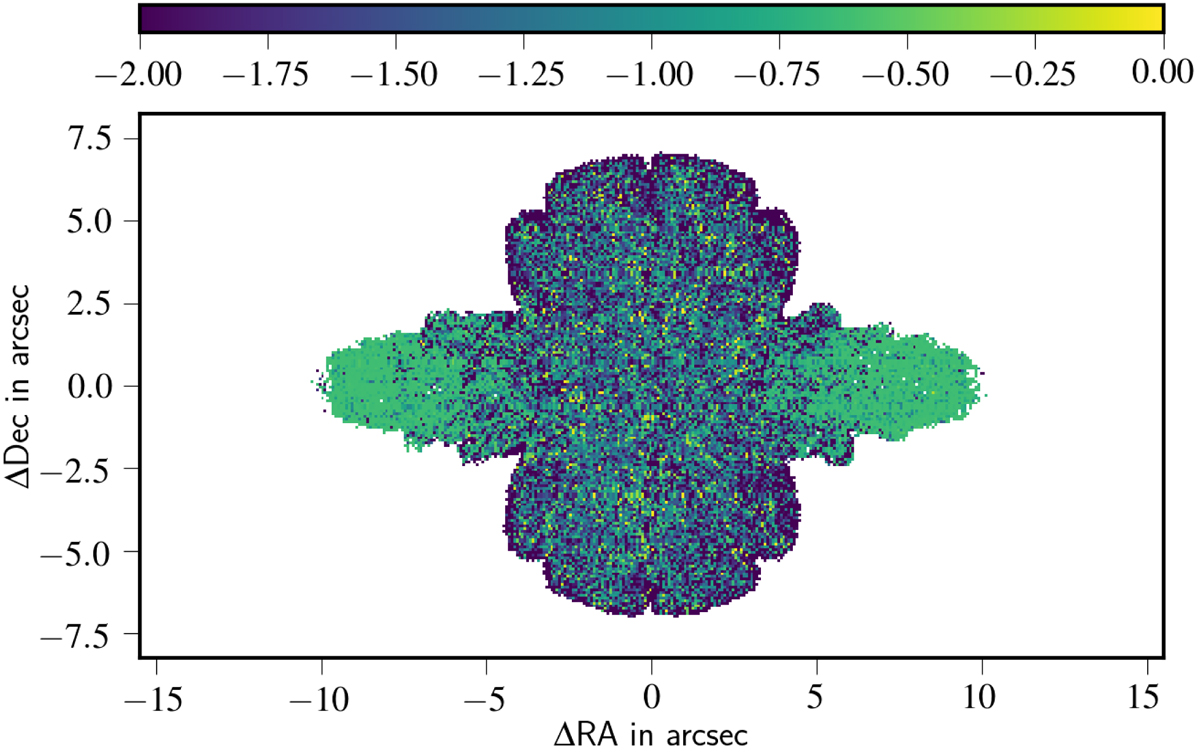
Spectral index distribution (α) of the radio structure obtained for the run 3Dmaj_ref is shown. Here, wings show steep spectral index compared to the active lobes due to the accumulation of older particles. However, the presence of several flatter α patches are also noticeable (especially in the wings), which are generated due to re-energised particles at shock sites. The frequencies used here to produce this map are 240 MHz and 5 GHz.
Current usage metrics show cumulative count of Article Views (full-text article views including HTML views, PDF and ePub downloads, according to the available data) and Abstracts Views on Vision4Press platform.
Data correspond to usage on the plateform after 2015. The current usage metrics is available 48-96 hours after online publication and is updated daily on week days.
Initial download of the metrics may take a while.