Fig. 9.
Download original image
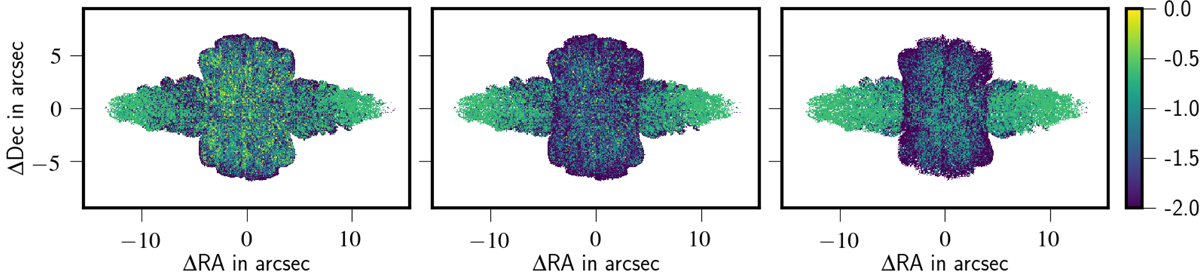
Distribution of spectral index (α) values for different frequency choices for the case of 3Dang_ref is shown here for a line-of-sight angle of (70° ,0°). The frequencies used to generate these maps are 0.240–0.610 GHz (left), 0.240–5.0 GHz (middle), and 5.0–43.0 GHz (right), respectively. The steepening of α values with increasing frequency choices in the wings is expected due to synchrotron cooling. The presence of flatter α patches (particularly in the wings) are prominent if the chosen frequencies are in the low-frequency regime (indication of particle re-energisation).
Current usage metrics show cumulative count of Article Views (full-text article views including HTML views, PDF and ePub downloads, according to the available data) and Abstracts Views on Vision4Press platform.
Data correspond to usage on the plateform after 2015. The current usage metrics is available 48-96 hours after online publication and is updated daily on week days.
Initial download of the metrics may take a while.