Fig. 11.
Download original image
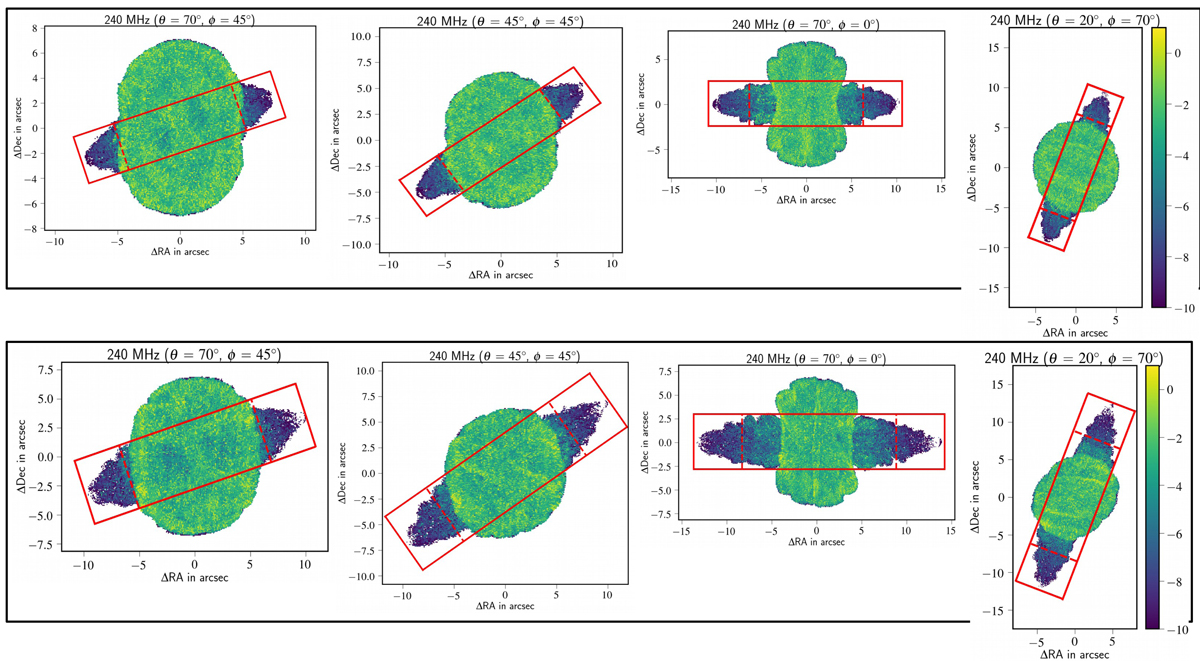
Representation of the regions identified as wing and lobe for evaluating the quantity ![]() . Top: intensity maps obtained for four line-of-sight angles for the case of 3Dmaj_ref. Bottom: intensity maps obtained for the same line-of-sight angles for the case of 3Dang_ref. We mark the jet region with a red rectangle (solid line), outside of which is the wing region. The rectangles drawn in the above images ensure that the jet remains well fit within that region which is verified using our optical B band images. The area enclosed by the dashed line indicates the tip of the jet (20% of the projected jet length), counted to avoid contamination while measuring
. Top: intensity maps obtained for four line-of-sight angles for the case of 3Dmaj_ref. Bottom: intensity maps obtained for the same line-of-sight angles for the case of 3Dang_ref. We mark the jet region with a red rectangle (solid line), outside of which is the wing region. The rectangles drawn in the above images ensure that the jet remains well fit within that region which is verified using our optical B band images. The area enclosed by the dashed line indicates the tip of the jet (20% of the projected jet length), counted to avoid contamination while measuring ![]() . The corresponding colour bar represents the 240 MHz intensity measures (log I) in Jy arcsec−2.
. The corresponding colour bar represents the 240 MHz intensity measures (log I) in Jy arcsec−2.
Current usage metrics show cumulative count of Article Views (full-text article views including HTML views, PDF and ePub downloads, according to the available data) and Abstracts Views on Vision4Press platform.
Data correspond to usage on the plateform after 2015. The current usage metrics is available 48-96 hours after online publication and is updated daily on week days.
Initial download of the metrics may take a while.