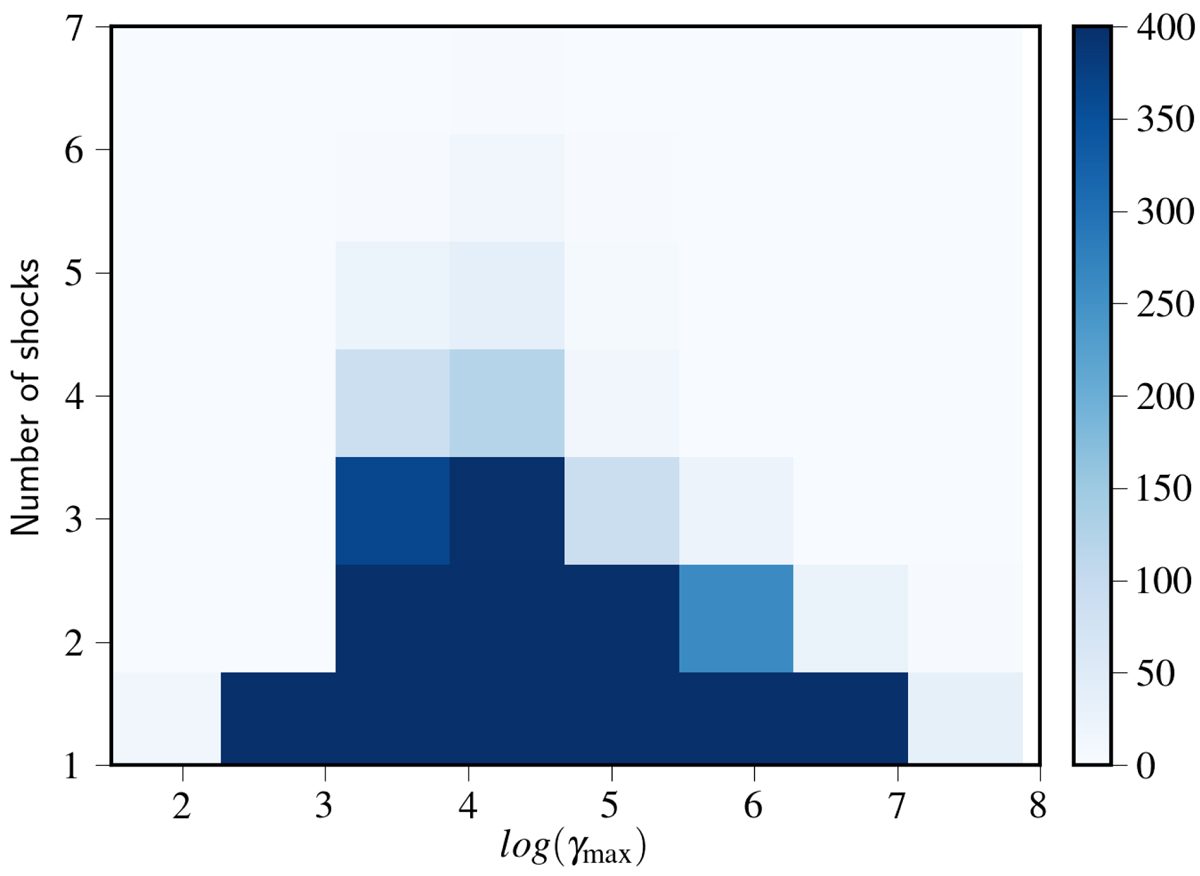
Fig. 14.
Download original image
2D PDF of number of shocks that the wing particles have encountered vs. their corresponding γmax values. We see that significant wing particles have experienced a greater number of shocks than the lobes (≤2), providing hint of ongoing re-energisation activities in the wings. The corresponding colour bar represents the number of particles that are distributed in the bins, where we impose a visualisation limit.
Current usage metrics show cumulative count of Article Views (full-text article views including HTML views, PDF and ePub downloads, according to the available data) and Abstracts Views on Vision4Press platform.
Data correspond to usage on the plateform after 2015. The current usage metrics is available 48-96 hours after online publication and is updated daily on week days.
Initial download of the metrics may take a while.